Recognition: 2 theorem links
· Lean TheoremLow-mass Active Galaxies in the SAMI Galaxy Survey with Spatially-resolved Spectroscopy
Pith reviewed 2026-05-13 22:01 UTC · model grok-4.3
The pith
Spatially-resolved spectroscopy finds active galactic nuclei in 4% of low-mass galaxies, higher than single-fiber estimates.
A machine-rendered reading of the paper's core claim, the machinery that carries it, and where it could break.
Core claim
Employing a novel automated scoring algorithm based on spatially resolved narrow emission-line diagnostics, signatures of active galactic nuclei are found in 41 galaxies plus 46 less secure candidates among 990 low-mass systems. The galaxies have stellar masses 10^9.4 ≲ M⋆/M⊙ ≲ 10^10, redshifts z ≲ 0.06, and a range of morphologies. The AGN fraction of 4 percent (9 percent including candidates) is significantly higher than fractions reported from single-fiber spectroscopy studies. Analysis of single-fiber spectra for the same objects demonstrates that many IFS detections are missed, highlighting the ability of integral field spectroscopy to capture extended or off-nuclear emission from accre
What carries the argument
Novel automated scoring algorithm based on spatially resolved narrow emission-line diagnostics, which identifies AGN ionization by scoring galaxies across their spatial extent.
If this is right
- The true fraction of active black holes in low-mass galaxies is at least 4 percent and likely higher than single-fiber surveys indicate.
- Many low-mass AGNs produce emission that is spatially extended or located away from the galaxy center, requiring integral field data to detect.
- Low-mass galaxies down to 10^8.5 solar masses can host detectable accreting black holes when observed with spatially resolved spectroscopy.
- Future AGN censuses of nearby galaxies will need to incorporate integral field spectroscopy to avoid systematic undercounts.
Where Pith is reading between the lines
- Single-fiber surveys may have missed a substantial population of low-mass active galaxies, requiring revised completeness corrections in black hole occupation fraction studies.
- Off-nuclear AGN activity could be more prevalent in low-mass systems, affecting models of black hole fueling and galaxy co-evolution.
- Cross-checking the candidates against multi-wavelength catalogs would provide an independent test of the emission-line scoring method.
Load-bearing premise
The automated scoring algorithm based on spatially resolved emission-line diagnostics accurately flags AGN activity without substantial contamination from star formation or other ionization sources.
What would settle it
Independent X-ray or radio observations of the 41 secure plus 46 candidate galaxies that find no accreting black hole signatures in the majority of them would show the reported AGN fraction is overstated.
Figures


read the original abstract
The smallest supermassive black holes (BHs), which provide constraints on BH seeds, reside in low-mass galaxies. Here, we present a systematic analysis of 990 low-mass galaxies in the SAMI Galaxy Survey to identify emission from accreting BHs using integral field spectroscopy (IFS). Employing a novel automated scoring algorithm based on spatially resolved narrow emission-line diagnostics, we find signatures of active galactic nuclei (AGNs) in 41 galaxies, as well as an additional 46 less secure candidates. The galaxies have stellar masses in the range $10^{9.4} \lesssim M_\star/M_\odot \lesssim 10^{10}$ (down to $10^{8.5}$ including less secure candidates), redshifts $z \lesssim 0.06$, and morphologies ranging from early-type ellipticals to late-type spirals. Our AGN fraction of 4% (9% including the less secure candidates) is significantly higher than those reported by studies using single-fiber spectroscopy ($\lesssim 1$--2%). Indeed, our additional analysis of single-fiber spectra of the objects in our sample demonstrates that many of our AGN candidates detected via IFS are missed. This work highlights the advantages of IFS, particularly its ability to capture extended or off-nuclear emission from accreting BHs.
Editorial analysis
A structured set of objections, weighed in public.
Referee Report
Summary. The paper analyzes 990 low-mass galaxies (M* ~ 10^9.4-10^10 Msun) from the SAMI Galaxy Survey using integral field spectroscopy and a novel automated scoring algorithm on spatially resolved narrow emission-line diagnostics. It reports 41 secure AGN detections plus 46 less secure candidates, yielding an AGN fraction of 4% (9% including candidates) that exceeds single-fiber spectroscopy results (≲1-2%), and shows that IFS recovers candidates missed by single-fiber spectra.
Significance. If the automated algorithm is robust, the result would be significant for constraining black hole seed models, as it implies a higher incidence of accreting low-mass black holes than single-fiber studies suggest and demonstrates the value of spatially resolved spectroscopy for detecting extended or off-nuclear AGN emission in low-mass systems.
major comments (2)
- [Methods] Methods section (automated scoring algorithm): No quantitative validation is reported for the novel algorithm, such as purity/completeness on a control sample of star-forming galaxies, recovery rate on known AGNs, or cross-checks against X-ray/radio/IR indicators; without these, contamination from H II regions or diffuse ionized gas cannot be ruled out and directly undermines the central 4-9% fraction claim.
- [Results] Results section (AGN fraction and single-fiber comparison): The re-analysis of single-fiber spectra shows IFS detects more candidates, but this does not establish that the additional detections are genuine AGNs rather than false positives; the excess over prior ≲1-2% studies therefore rests on an untested assumption about algorithm cleanliness.
minor comments (1)
- [Abstract] Abstract: Clarify the exact stellar-mass range for the secure 41 AGNs versus the 46 candidates (the text states down to 10^8.5 only for candidates) to avoid ambiguity in the reported sample properties.
Simulated Author's Rebuttal
We thank the referee for their careful review and constructive comments on our manuscript. We address each major comment below and have revised the paper accordingly to strengthen the presentation of our methods and results.
read point-by-point responses
-
Referee: [Methods] Methods section (automated scoring algorithm): No quantitative validation is reported for the novel algorithm, such as purity/completeness on a control sample of star-forming galaxies, recovery rate on known AGNs, or cross-checks against X-ray/radio/IR indicators; without these, contamination from H II regions or diffuse ionized gas cannot be ruled out and directly undermines the central 4-9% fraction claim.
Authors: We agree that explicit quantitative validation of the automated scoring algorithm is necessary to support the robustness of our AGN detections. In the revised manuscript we have added a new subsection to the Methods section that reports the algorithm's performance on a control sample of star-forming galaxies drawn from SAMI (to quantify false-positive rates) and on a literature compilation of known low-mass AGNs (to quantify recovery rates). We also discuss the role of spatial information in reducing contamination from H II regions and diffuse ionized gas. These additions directly address the concern about the reliability of the reported 4-9% fraction. revision: yes
-
Referee: [Results] Results section (AGN fraction and single-fiber comparison): The re-analysis of single-fiber spectra shows IFS detects more candidates, but this does not establish that the additional detections are genuine AGNs rather than false positives; the excess over prior ≲1-2% studies therefore rests on an untested assumption about algorithm cleanliness.
Authors: We have revised the Results section to clarify that the higher detection rate arises from IFS's ability to recover extended and off-nuclear emission that single-fiber spectra miss. The identification of these additional sources as AGN candidates is based on the spatially resolved line-ratio diagnostics and the scoring algorithm; we now explicitly cross-reference the validation tests added to the Methods section. We have also inserted a brief discussion of remaining limitations and the value of future multi-wavelength confirmation. This revision makes clear that the excess fraction is tied to the validated spatial diagnostics rather than an untested assumption. revision: partial
Circularity Check
No significant circularity; AGN fraction is direct observational count from applied diagnostics
full rationale
The paper reports an empirical AGN fraction (4-9%) obtained by applying a described automated scoring algorithm to spatially-resolved emission-line data from the independent SAMI survey sample of 990 galaxies. No equations, fitted parameters, or derivations are presented that reduce the reported fraction to itself by construction. The comparison to single-fiber studies is external. The algorithm is presented as novel but its application yields a straightforward census; no self-citation chain, ansatz smuggling, or renaming of known results is load-bearing for the headline count. This is a standard observational measurement with no circularity in the derivation chain.
Axiom & Free-Parameter Ledger
free parameters (1)
- scoring thresholds in automated algorithm
axioms (1)
- domain assumption Narrow emission-line ratios can distinguish AGN ionization from star formation or other sources in spatially resolved spectra
Lean theorems connected to this paper
-
IndisputableMonolith/Cost/FunctionalEquation.leanwashburn_uniqueness_aczel unclear?
unclearRelation between the paper passage and the cited Recognition theorem.
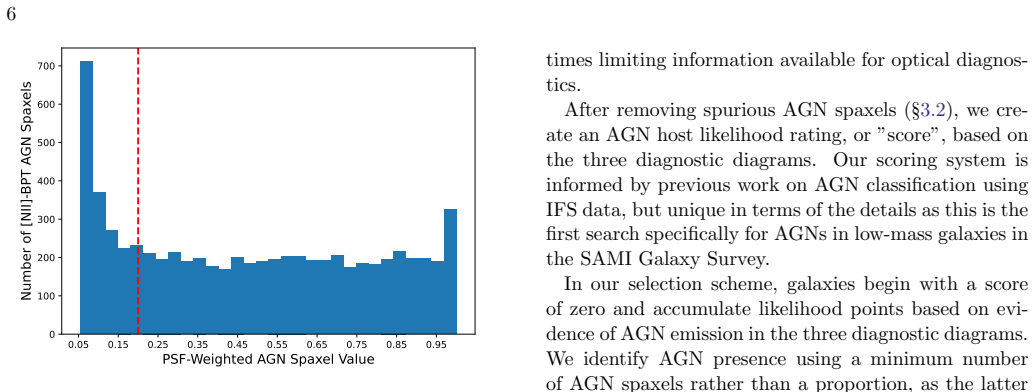
Employing a novel automated scoring algorithm based on spatially resolved narrow emission-line diagnostics... galaxies accumulate points based on the presence of AGN emission in these diagrams, subject to a minimum requirement of five spaxels
-
IndisputableMonolith/Foundation/AlexanderDuality.leanalexander_duality_circle_linking unclear?
unclearRelation between the paper passage and the cited Recognition theorem.
We convolve this mask with a two-dimensional normalized Gaussian PSF with σ=1.7 spaxels... adopt a PSF weighted threshold of 0.2
What do these tags mean?
- matches
- The paper's claim is directly supported by a theorem in the formal canon.
- supports
- The theorem supports part of the paper's argument, but the paper may add assumptions or extra steps.
- extends
- The paper goes beyond the formal theorem; the theorem is a base layer rather than the whole result.
- uses
- The paper appears to rely on the theorem as machinery.
- contradicts
- The paper's claim conflicts with a theorem or certificate in the canon.
- unclear
- Pith found a possible connection, but the passage is too broad, indirect, or ambiguous to say the theorem truly supports the claim.
Reference graph
Works this paper leans on
-
[1]
Baldassare, V. F., Geha, M., & Greene, J. 2018, The Astrophysical Journal, 868, 152, doi: 10.3847/1538-4357/aae6cf —. 2020, The Astrophysical Journal, 896, 10, doi: 10.3847/1538-4357/ab8936
-
[2]
Baldassare, V. F., Reines, A. E., Gallo, E., & Greene, J. E. 2017, The Astrophysical Journal, 836, 20, doi: 10.3847/1538-4357/836/1/20
-
[3]
Baldassare, V. F., Reines, A. E., Gallo, E., et al. 2016, The Astrophysical Journal, 829, 57, doi: 10.3847/0004-637X/829/1/57
-
[4]
Baldry, I. K., Liske, J., Brown, M. J. I., et al. 2018, Monthly Notices of the Royal Astronomical Society, 474, 3875, doi: 10.1093/mnras/stx3042
-
[5]
Baldwin, J. A., Phillips, M. M., & Terlevich, R. 1981, Publications of the Astronomical Society of the Pacific, 93, 5, doi: 10.1086/130766
-
[6]
Ram Pressure Stripping of Disc Galaxies: The Role of the Inclination Angle , shorttitle =
Begelman, M. C., Volonteri, M., & Rees, M. J. 2006, Monthly Notices of the Royal Astronomical Society, 370, 289, doi: 10.1111/j.1365-2966.2006.10467.x
-
[7]
2011, The Astrophysical Journal, 742, 13, doi: 10.1088/0004-637X/742/1/13
Bellovary, J., Volonteri, M., Governato, F., et al. 2011, The Astrophysical Journal, 742, 13, doi: 10.1088/0004-637X/742/1/13
-
[8]
Monthly Notices of the Royal Astronomical Society , volume =
Bellovary, J. M., Hayoune, S., Chafla, K., et al. 2021, MNRAS, 505, 5129, doi: 10.1093/mnras/stab1665
-
[9]
Birchall, K. L., Watson, M. G., & Aird, J. 2020, Monthly Notices of the Royal Astronomical Society, 492, 2268, doi: 10.1093/mnras/staa040
-
[10]
2011, Annual Review of Astronomy and Astrophysics, 49, 373, doi:10.1146/annurev-astro-081710-102608
Bromm, V., & Yoshida, N. 2011, Annual Review of Astronomy and Astrophysics, 49, 373, doi: 10.1146/annurev-astro-081710-102608
-
[11]
Bryant, J. J., Owers, M. S., Robotham, A. S. G., et al. 2015, Monthly Notices of the Royal Astronomical Society, 447, 2857, doi: 10.1093/mnras/stu2635 18
-
[12]
Bykov, S. D., Gilfanov, M. R., & Sunyaev, R. A. 2024, Monthly Notices of the Royal Astronomical Society, 527, 1962, doi: 10.1093/mnras/stad3355
-
[13]
Cann, J. M., Satyapal, S., Abel, N. P., et al. 2019, The Astrophysical Journal Letters, 870, L2, doi: 10.3847/2041-8213/aaf88d —. 2018, The Astrophysical Journal, 861, 142, doi: 10.3847/1538-4357/aac64a
-
[14]
Improving the Full Spectrum Fitting Method: Accurate Convolution with
Cappellari, M. 2017, Monthly Notices of the Royal Astronomical Society, 466, 798, doi: 10.1093/mnras/stw3020 —. 2023, Monthly Notices of the Royal Astronomical Society, 526, 3273, doi: 10.1093/mnras/stad2597
work page internal anchor Pith review doi:10.1093/mnras/stw3020 2017
-
[15]
Cappellari, M., & Emsellem, E. 2004, Publications of the Astronomical Society of the Pacific, 116, 138, doi: 10.1086/381875
-
[16]
Chen, C.-T. J., Brandt, W. N., Reines, A. E., et al. 2017, The Astrophysical Journal, 837, 48, doi: 10.3847/1538-4357/aa5d5b
-
[17]
2001, MNRAS, 322, 231, doi: 10.1046/j.1365-8711.2001.04022.x
Colless, M., Dalton, G. B., Maddox, S. J., et al. 2001, Monthly Notices of the Royal Astronomical Society, 328, 1039, doi: 10.1046/j.1365-8711.2001.04902.x
-
[18]
Conroy, C., & Gunn, J. E. 2010, The Astrophysical Journal, 712, 833, doi: 10.1088/0004-637X/712/2/833
-
[19]
Conroy, C., Gunn, J. E., & White, M. 2009, The Astrophysical Journal, 699, 486, doi: 10.1088/0004-637X/699/1/486
work page internal anchor Pith review doi:10.1088/0004-637x/699/1/486 2009
-
[20]
Cortese, L., Fogarty, L. M. R., Bekki, K., et al. 2016, Monthly Notices of the Royal Astronomical Society, 463, 170, doi: 10.1093/mnras/stw1891
-
[21]
Croom, S. M., Owers, M. S., Scott, N., et al. 2021, Monthly Notices of the Royal Astronomical Society, 505, 991, doi: 10.1093/mnras/stab229
-
[22]
Davis, F., Kaviraj, S., Hardcastle, M. J., et al. 2022, Monthly Notices of the Royal Astronomical Society, 511, 4109, doi: 10.1093/mnras/stac068
-
[23]
Delgado, R. M. G., Cervi˜ no, M., Martins, L. P., Leitherer, C., & Hauschildt, P. H. 2005, Monthly Notices of the Royal Astronomical Society, 357, 945, doi: 10.1111/j.1365-2966.2005.08692.x
-
[24]
Devecchi, B., & Volonteri, M. 2009, The Astrophysical Journal, 694, 302, doi: 10.1088/0004-637X/694/1/302
-
[25]
Dey, A., Schlegel, D. J., Lang, D., et al. 2019, The Astronomical Journal, 157, 168, doi: 10.3847/1538-3881/ab089d
-
[26]
Driver, S. P., Norberg, P., Baldry, I. K., et al. 2009, Astronomy and Geophysics, 50, 5.12, doi: 10.1111/j.1468-4004.2009.50512.x
-
[27]
Driver, S. P., Hill, D. T., Kelvin, L. S., et al. 2011, Monthly Notices of the Royal Astronomical Society, 413, 971, doi: 10.1111/j.1365-2966.2010.18188.x
-
[28]
Driver, S. P., Bellstedt, S., Robotham, A. S. G., et al. 2022, Monthly Notices of the Royal Astronomical Society, 513, 439, doi: 10.1093/mnras/stac472
-
[29]
Eberhard, J.-M., & Reines, A. E. 2025, The Astrophysical Journal, 994, 1, doi: 10.3847/1538-4357/ae0c0d
-
[30]
Greene, J. E. 2025, The Astrophysical Journal, 978, 158, doi: 10.3847/1538-4357/ad9584
-
[31]
2000, ApJL, 539, L9, doi: 10.1086/312838
Ferrarese, L., & Merritt, D. 2000, The Astrophysical Journal, 539, L9, doi: 10.1086/312838
-
[32]
Green, A. W., Croom, S. M., Scott, N., et al. 2018, Monthly Notices of the Royal Astronomical Society, 475, 716, doi: 10.1093/mnras/stx3135
-
[33]
Greene, J. E., Strader, J., & Ho, L. C. 2020, Annual Review of Astronomy and Astrophysics, 58, 257, doi: 10.1146/annurev-astro-032620-021835
-
[34]
Ram Pressure Stripping of Disc Galaxies: The Role of the Inclination Angle , shorttitle =
Groves, B., Heckman, T., & Kauffmann, G. 2006, Monthly Notices of the Royal Astronomical Society, 371, 1559, doi: 10.1111/j.1365-2966.2006.10812.x
-
[35]
Hampton, E. J., Medling, A. M., Groves, B., et al. 2017, Monthly Notices of the Royal Astronomical Society, 470, 3395, doi: 10.1093/mnras/stx1413
-
[36]
Butcher, H. R. 1981, The Astrophysical Journal, 247, 403, doi: 10.1086/159050
-
[37]
Ho, I.-T., Medling, A. M., Groves, B., et al. 2016, Astrophysics and Space Science, 361, 280, doi: 10.1007/s10509-016-2865-2
-
[38]
Hong, S., Calzetti, D., Gallagher, J. S., et al. 2013, The Astrophysical Journal, 777, 63, doi: 10.1088/0004-637X/777/1/63
-
[39]
Izotov, Y. I., Thuan, T. X., & Guseva, N. G. 2007, The Astrophysical Journal, 671, 1297, doi: 10.1086/522923
-
[40]
Johnston, V. D., Medling, A. M., Groves, B., et al. 2023, The Astrophysical Journal, 954, 77, doi: 10.3847/1538-4357/ace90e
-
[41]
2004, MNRAS, 351, 1379, doi: 10.1111/j.1365-2966.2004.07876.x
Jones, D. H., Saunders, W., Colless, M., et al. 2004, Monthly Notices of the Royal Astronomical Society, 355, 747, doi: 10.1111/j.1365-2966.2004.08353.x
-
[42]
Jones, D. H., Read, M. A., Saunders, W., et al. 2009, Monthly Notices of the Royal Astronomical Society, 399, 683, doi: 10.1111/j.1365-2966.2009.15338.x
-
[43]
Kauffmann, G., Heckman, T. M., Tremonti, C., et al. 2003, Monthly Notices of the Royal Astronomical Society, 346, 1055, doi: 10.1111/j.1365-2966.2003.07154.x 19
-
[44]
Kewley, L. J., Dopita, M. A., Sutherland, R. S., Heisler, C. A., & Trevena, J. 2001, The Astrophysical Journal, 556, 121, doi: 10.1086/321545
work page internal anchor Pith review doi:10.1086/321545 2001
-
[45]
Ram Pressure Stripping of Disc Galaxies: The Role of the Inclination Angle , shorttitle =
Kewley, L. J., Groves, B., Kauffmann, G., & Heckman, T. 2006, Monthly Notices of the Royal Astronomical Society, 372, 961, doi: 10.1111/j.1365-2966.2006.10859.x
-
[46]
Kewley, L. J., Nicholls, D. C., & Sutherland, R. S. 2019, Annual Review of Astronomy and Astrophysics, 57, 511, doi: 10.1146/annurev-astro-081817-051832
-
[47]
2021, The Astrophysical Journal, 911, 134, doi: 10.3847/1538-4357/abec40
Geha, M. 2021, The Astrophysical Journal, 911, 134, doi: 10.3847/1538-4357/abec40
-
[48]
Kormendy, J., & Ho, L. C. 2013, Annual Review of Astronomy and Astrophysics, 51, 511, doi: 10.1146/annurev-astro-082708-101811
work page internal anchor Pith review doi:10.1146/annurev-astro-082708-101811 2013
-
[49]
1995, ARA&A, 33, 581, doi: 10.1146/annurev.aa.33.090195.003053
Kormendy, J., & Richstone, D. 1995, Annual Review of Astronomy and Astrophysics, 33, 581, doi: 10.1146/annurev.aa.33.090195.003053
-
[50]
Latif, M. A., Whalen, D. J., Khochfar, S., Herrington, N. P., & Woods, T. E. 2022, Nature, 607, 48, doi: 10.1038/s41586-022-04813-y
-
[51]
Greene, J. E. 2015, The Astrophysical Journal, 805, 12, doi: 10.1088/0004-637X/805/1/12
-
[52]
Loeb, A., & Rasio, F. A. 1994, The Astrophysical Journal, 432, 52, doi: 10.1086/174548
-
[53]
Madgwick, D. S., Lahav, O., Baldry, I. K., et al. 2002, Monthly Notices of the Royal Astronomical Society, 333, 133, doi: 10.1046/j.1365-8711.2002.05393.x Mart´ ınez-Palomera, J., Lira, P., Bhalla-Ladd, I., F¨ orster, F., & Plotkin, R. M. 2020, The Astrophysical Journal, 889, 113, doi: 10.3847/1538-4357/ab5f5b
-
[54]
2018, Monthly Notices of the Royal Astronomical Society, 478, 2576, doi: 10.1093/mnras/sty1163
Mezcua, M., Civano, F., Marchesi, S., et al. 2018, Monthly Notices of the Royal Astronomical Society, 478, 2576, doi: 10.1093/mnras/sty1163
-
[55]
2020, The Astrophysical Journal Letters, 898, L30, doi: 10.3847/2041-8213/aba199
Mezcua, M., & Dom´ ınguez S´ anchez, H. 2020, The Astrophysical Journal Letters, 898, L30, doi: 10.3847/2041-8213/aba199
-
[56]
2019, Monthly Notices of the Royal Astronomical Society, 488, 685, doi: 10.1093/mnras/stz1760
Mezcua, M., Suh, H., & Civano, F. 2019, Monthly Notices of the Royal Astronomical Society, 488, 685, doi: 10.1093/mnras/stz1760
-
[57]
Mezcua, M., & S´ anchez, H. D. 2024, Monthly Notices of the Royal Astronomical Society, 528, 5252, doi: 10.1093/mnras/stae292
-
[58]
Miller, M. C., & Davies, M. B. 2012, The Astrophysical Journal, 755, 81, doi: 10.1088/0004-637X/755/1/81
-
[59]
Molina, M., Eracleous, M., Barth, A. J., et al. 2018, The Astrophysical Journal, 864, 90, doi: 10.3847/1538-4357/aad5ed
-
[60]
2021, The Astrophysical Journal, 922, 155, doi: 10.3847/1538-4357/ac1ffa
Salehirad, S. 2021, The Astrophysical Journal, 922, 155, doi: 10.3847/1538-4357/ac1ffa
-
[61]
C., Shahinyan, K., Sugarman, H
Moran, E. C., Shahinyan, K., Sugarman, H. R., V´ elez, D. O., & Eracleous, M. 2014, The Astronomical Journal, 148, 136, doi: 10.1088/0004-6256/148/6/136
-
[62]
Newville, M., Stensitzki, T., Allen, D. B., & Ingargiola, A. 2014, LMFIT: Non-Linear Least-Square Minimization and Curve-Fitting for Python, Zenodo, doi: 10.5281/zenodo.11813
-
[63]
Owers, M. S., Allen, J. T., Baldry, I., et al. 2017, Monthly Notices of the Royal Astronomical Society, 468, 1824, doi: 10.1093/mnras/stx562
-
[64]
Owers, M. S., Hudson, M. J., Oman, K. A., et al. 2019, The Astrophysical Journal, 873, 52, doi: 10.3847/1538-4357/ab0201
-
[65]
Pardo, K., Goulding, A. D., Greene, J. E., et al. 2016, The Astrophysical Journal, 831, 203, doi: 10.3847/0004-637X/831/2/203
-
[66]
Polimera, M. S., Kannappan, S. J., Richardson, C. T., et al. 2022, The Astrophysical Journal, 931, 44, doi: 10.3847/1538-4357/ac6595 Portegies Zwart, S. F., Baumgardt, H., Hut, P., Makino, J., & McMillan, S. L. W. 2004, Nature, 428, 724, doi: 10.1038/nature02448
-
[67]
Pucha, R., Juneau, S., Dey, A., et al. 2025, Tripling the Census of Dwarf AGN Candidates Using DESI Early Data, arXiv, doi: 10.48550/arXiv.2411.00091
-
[68]
Reines, A. E. 2022, Nature Astronomy, 6, 26, doi: 10.1038/s41550-021-01556-0
-
[69]
Reines, A. E., Condon, J. J., Darling, J., & Greene, J. E. 2020, The Astrophysical Journal, 888, 36, doi: 10.3847/1538-4357/ab4999
-
[70]
Reines, A. E., Greene, J. E., & Geha, M. 2013, The Astrophysical Journal, 775, 116, doi: 10.1088/0004-637X/775/2/116
-
[71]
Reines, A. E., Plotkin, R. M., Russell, T. D., et al. 2014, The Astrophysical Journal, 787, L30, doi: 10.1088/2041-8205/787/2/L30
-
[72]
Reines, A. E., Sivakoff, G. R., Johnson, K. E., & Brogan, C. L. 2011, Nature, 470, 66, doi: 10.1038/nature09724
-
[73]
Reines, A. E., & Volonteri, M. 2015, The Astrophysical Journal, 813, 82, doi: 10.1088/0004-637X/813/2/82
-
[74]
2018, Monthly Notices of the Royal Astronomical Society, 481, 3278, doi: 10.1093/mnras/sty2448
Ricarte, A., & Natarajan, P. 2018, Monthly Notices of the Royal Astronomical Society, 481, 3278, doi: 10.1093/mnras/sty2448
-
[75]
Salehirad, S., Reines, A. E., & Molina, M. 2022, The Astrophysical Journal, 937, 7, doi: 10.3847/1538-4357/ac8876 20
-
[76]
Scott, N., van de Sande, J., Croom, S. M., et al. 2018, Monthly Notices of the Royal Astronomical Society, 481, 2299, doi: 10.1093/mnras/sty2355
-
[77]
Secrest, N. J., & Satyapal, S. 2020, The Astrophysical Journal, 900, 56, doi: 10.3847/1538-4357/ab9309
-
[78]
Asari, N. V. 2006, Monthly Notices of the Royal Astronomical Society, 371, 972, doi: 10.1111/j.1365-2966.2006.10732.x
-
[79]
Taylor, E. N., Hopkins, A. M., Baldry, I. K., et al. 2011, Monthly Notices of the Royal Astronomical Society, 418, 1587, doi: 10.1111/j.1365-2966.2011.19536.x
-
[80]
Vazdekis, A., S´ anchez-Bl´ azquez, P., Falc´ on-Barroso, J., et al. 2010, Monthly Notices of the Royal Astronomical Society, 404, 1639, doi: 10.1111/j.1365-2966.2010.16407.x
discussion (0)
Sign in with ORCID, Apple, or X to comment. Anyone can read and Pith papers without signing in.