Recognition: 2 theorem links
· Lean TheoremFrom Elevation Maps To Contour Lines: SVM and Decision Trees to Detect Violin Width Reduction
Pith reviewed 2026-05-13 21:25 UTC · model grok-4.3
The pith
Contour lines from violin 3D meshes let SVM and decision trees detect width reduction at least as effectively as elevation maps.
A machine-rendered reading of the paper's core claim, the machinery that carries it, and where it could break.
Core claim
The central claim is that SVM and decision trees applied to parametric contour lines fitted to 3D photogrammetric violin meshes detect width reduction with performance that is never surpassed by the same models trained on elevation maps derived from the identical meshes, even though the elevation-map approach occasionally yields strong results on its own.
What carries the argument
Parametric contour lines fitted to 3D meshes, serving as compact input features for SVM and decision-tree classifiers that distinguish reduced versus unreduced violin widths.
If this is right
- Contour-line inputs supply a more stable or efficient representation than full elevation maps for this geometric classification task.
- Feature engineering that isolates contours can match or exceed raw data performance while using fewer input dimensions.
- The same SVM and decision-tree pipeline can be applied to contour lines for related violin measurements without needing the complete mesh surface.
- Detection of width reduction becomes feasible from standard photogrammetric scans once contour fitting is performed.
Where Pith is reading between the lines
- The same contour-fitting step could be tested on other string instruments such as violas or cellos to check whether the performance gap persists across similar shapes.
- If contour lines remain superior, future work might replace the full mesh with a small set of cross-sectional curves for faster scanning and storage in heritage databases.
- A direct comparison on synthetic meshes with controlled width reductions would isolate whether the advantage comes from noise rejection or from the parametric form itself.
Load-bearing premise
That the photogrammetric 3D meshes accurately represent the violins' true geometry and that width reductions produce consistent, detectable signals in either elevation maps or contour lines without being overwhelmed by scanning noise or unrelated shape variations.
What would settle it
Measure classification accuracy on a new set of violin meshes where width reduction is independently verified by precise caliper measurements on the physical instruments; if the contour-line models lose their advantage or both methods drop below usable accuracy, the claim is falsified.
Figures


read the original abstract
We explore the automatic detection of violin width reduction using 3D photogrammetric meshes. We compare SVM and Decision Trees applied to a geometry-based raw representation built from elevation maps with a more targeted, feature-engineered approach relying on parametric contour lines fitting. Although elevation maps occasionally achieve strong results, their performance does not surpass that of the contour-based inputs.
Editorial analysis
A structured set of objections, weighed in public.
Referee Report
Summary. The paper claims that SVM and Decision Trees can detect violin width reduction from 3D photogrammetric meshes, and that a feature-engineered representation based on parametric contour-line fitting outperforms or at least matches a raw geometry representation built from elevation maps, although elevation maps occasionally yield strong results.
Significance. If the comparative result is substantiated with quantitative metrics and reproducible validation, the work could inform feature design choices for detecting subtle geometric deformations in 3D cultural-heritage models. The direct head-to-head evaluation of raw elevation maps versus targeted contour features on the same meshes is a concrete contribution to the application of classical ML methods in this niche domain.
major comments (2)
- [Abstract] Abstract: the central comparative claim is stated without any dataset size, number of labeled meshes, performance numbers (accuracy, precision, recall, or AUC), cross-validation scheme, or statistical significance test, rendering the result impossible to assess or reproduce.
- [Methods] Methods/Experiments: no description is provided of how elevation maps are rasterized from the photogrammetric meshes, how parametric contour lines are fitted, the train/test split protocol, or the exact SVM kernel and Decision-Tree hyperparameters; without these details the attribution of any performance gap to feature choice versus data artifacts cannot be verified.
minor comments (1)
- [Abstract] Abstract: the sentence 'their performance does not surpass that of the contour-based inputs' is ambiguous; clarify whether contour lines are strictly superior or merely non-inferior.
Simulated Author's Rebuttal
We thank the referee for the constructive comments. We address each major point below and will incorporate the requested details into the revised manuscript.
read point-by-point responses
-
Referee: [Abstract] Abstract: the central comparative claim is stated without any dataset size, number of labeled meshes, performance numbers (accuracy, precision, recall, or AUC), cross-validation scheme, or statistical significance test, rendering the result impossible to assess or reproduce.
Authors: We agree that the abstract should include quantitative details to allow assessment of the claims. In the revision we will add the number of labeled meshes, key performance metrics (accuracy, AUC), the cross-validation protocol, and any significance testing results. revision: yes
-
Referee: [Methods] Methods/Experiments: no description is provided of how elevation maps are rasterized from the photogrammetric meshes, how parametric contour lines are fitted, the train/test split protocol, or the exact SVM kernel and Decision-Tree hyperparameters; without these details the attribution of any performance gap to feature choice versus data artifacts cannot be verified.
Authors: We acknowledge that additional implementation details are needed. The revised methods section will explicitly describe the rasterization of elevation maps from the meshes, the parametric contour-line fitting procedure, the train/test split protocol, the SVM kernel, and the hyperparameter settings for both classifiers. revision: yes
Circularity Check
No significant circularity
full rationale
The paper performs a direct empirical comparison of SVM and decision-tree classifiers on two input representations (elevation maps versus parametric contour lines) for detecting violin width reduction from photogrammetric meshes. No derivations, equations, fitted parameters renamed as predictions, or self-citation chains appear in the provided abstract or described content. The central claim rests on performance metrics obtained from the same labeled data under consistent splits, which is self-contained and externally falsifiable. No load-bearing step reduces to its own inputs by construction.
Axiom & Free-Parameter Ledger
axioms (1)
- domain assumption Photogrammetric meshes provide sufficiently accurate geometry for width reduction detection.
Lean theorems connected to this paper
-
IndisputableMonolith/Cost/FunctionalEquation.leanwashburn_uniqueness_aczel unclear?
unclearRelation between the paper passage and the cited Recognition theorem.
We compare SVM and Decision Trees applied to a geometry-based raw representation built from elevation maps with a more targeted, feature-engineered approach relying on parametric contour lines fitting.
-
IndisputableMonolith/Foundation/RealityFromDistinction.leanreality_from_one_distinction unclear?
unclearRelation between the paper passage and the cited Recognition theorem.
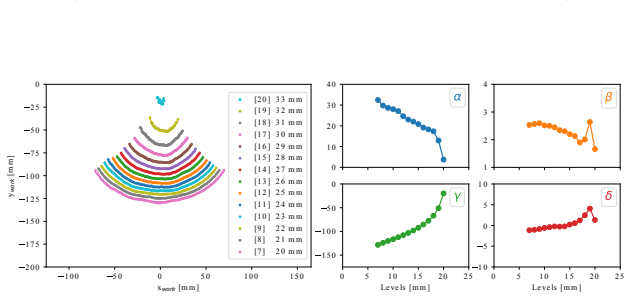
Each contour line was then fitted with a parabola-like curve described by four parameters α, β, γ, δ
What do these tags mean?
- matches
- The paper's claim is directly supported by a theorem in the formal canon.
- supports
- The theorem supports part of the paper's argument, but the paper may add assumptions or extra steps.
- extends
- The paper goes beyond the formal theorem; the theorem is a base layer rather than the whole result.
- uses
- The paper appears to rely on the theorem as machinery.
- contradicts
- The paper's claim conflicts with a theorem or certificate in the canon.
- unclear
- Pith found a possible connection, but the passage is too broad, indirect, or ambiguous to say the theorem truly supports the claim.
Reference graph
Works this paper leans on
-
[1]
Baroque violas with reduced soundboxes: An evaluation method
Anne-Emmanuelle Ceulemans, Phil´ emon Beghin, Paul Fisette, Fran¸ cois Glineur, and Iona Thys. Baroque violas with reduced soundboxes: An evaluation method. The Galpin Society Journal 76 (LXXVI), pages 109–126, 2023
work page 2023
-
[2]
Marie Radepont, Jean-Philippe ´Echard, Matthias Ockerm¨ uller, Hortense de la Co- dre, and Oulfa Belhadj. Revealing lost 16th-century royal emblems on two Andrea Amati’s violins using XRF scanning.Heritage Science, 8(1):1–12, 2020
work page 2020
-
[3]
Phil´ emon Beghin, Anne-Emmanuelle Ceulemans, Paul Fisette, and Fran¸ cois Glineur. Validation of a photogrammetric approach for the objective study of early bowed instruments.Heritage Science, 11(1):170, 2023
work page 2023
-
[4]
A discus- sion about violin reduction: Geometric analysis of contour lines and channel of minima
Phil´ emon Beghin, Anne-Emmanuelle Ceulemans, and Fran¸ cois Glineur. A discus- sion about violin reduction: Geometric analysis of contour lines and channel of minima. In Rocco Furferi, Lapo Governi, Yary Volpe, Francesco Gherardini, and Kate Seymour, editors,The Future of Heritage Science and Technologies II, pages 432–446, Cham, 2026. Springer Nature Sw...
work page 2026
-
[5]
Phil´ emon Beghin, Anne-Emmanuelle Ceulemans, and Fran¸ cois Glineur. Identifi- cation of violin reduction via contour lines classification.2025 Digital Heritage International Congress (Digital Heritage - Siena - September 2025) - To appear. arXiv preprint arXiv:2507.07743, 2025
-
[6]
Pointnet: Deep learning on point sets for 3d classification and segmentation
Charles R Qi, Hao Su, Kaichun Mo, and Leonidas J Guibas. Pointnet: Deep learning on point sets for 3d classification and segmentation. InProceedings of the IEEE conference on computer vision and pattern recognition, pages 652–660, 2017
work page 2017
-
[7]
Deep sets.Advances in neural information processing systems, 30, 2017
Manzil Zaheer, Satwik Kottur, Siamak Ravanbakhsh, Barnabas Poczos, Russ R Salakhutdinov, and Alexander J Smola. Deep sets.Advances in neural information processing systems, 30, 2017
work page 2017
discussion (0)
Sign in with ORCID, Apple, or X to comment. Anyone can read and Pith papers without signing in.