Recognition: 1 theorem link
· Lean TheoremRe-analysis of the Human Transcription Factor Atlas Recovers TF-Specific Signatures from Pooled Single-Cell Screens with Missing Controls
Pith reviewed 2026-05-13 20:52 UTC · model grok-4.3
The pith
Background subtraction with embryoid body cells recovers TF-specific signatures for 59 of 61 testable factors in a pooled screen missing internal controls.
A machine-rendered reading of the paper's core claim, the machinery that carries it, and where it could break.
Core claim
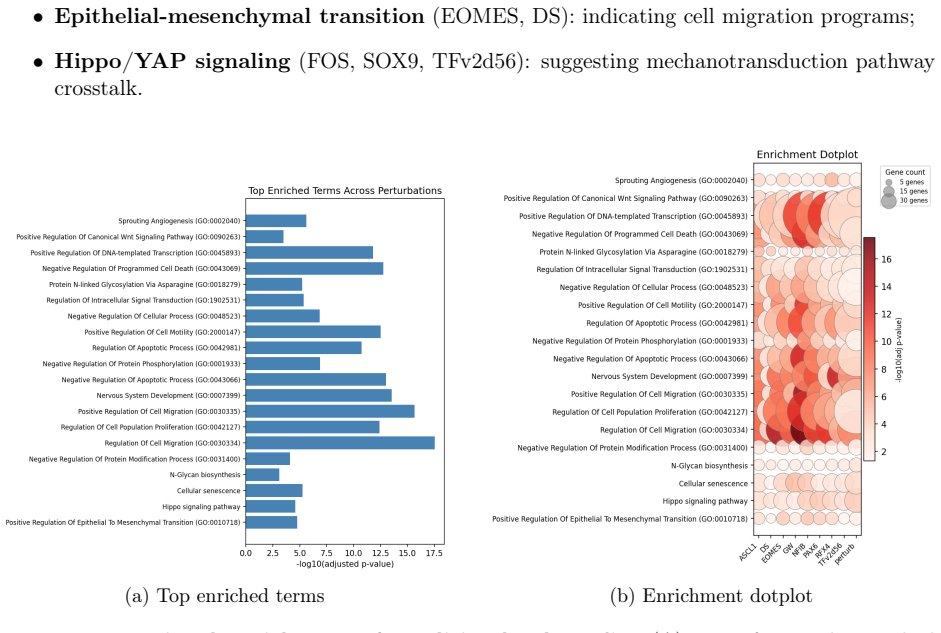
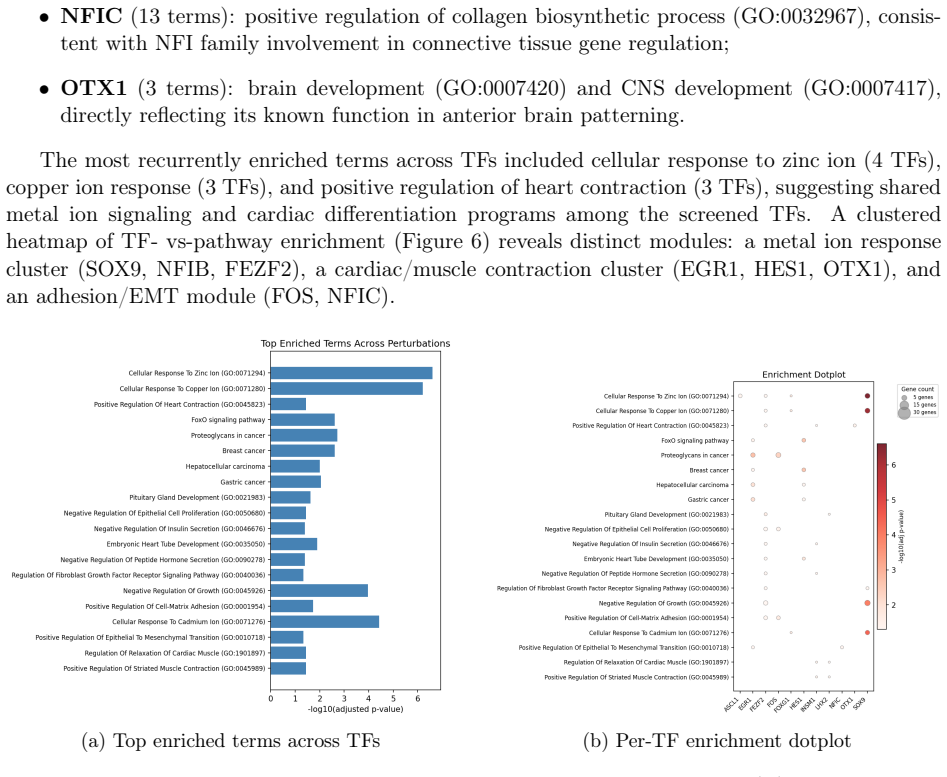
The central claim is that background subtraction against embryoid body cells as an external baseline identifies TF-specific transcriptional signatures for 59 of 61 testable transcription factors in the human TF Atlas pooled screen, compared with only 27 detected by one-vs-rest analysis. This approach recovers significant agreement with prior effect-size rankings, highlights HOPX, MAZ, PAX6, FOS, and FEZF2 as the strongest remodelers, and links individual TFs to pathways such as differentiation, Hippo signaling, focal adhesion, and collagen biosynthesis while revealing broader convergent signatures in Wnt, neurogenic, EMT, and Hippo programs.
What carries the argument
Background subtraction of shared batch and transduction patterns observed in embryoid body cells, applied after MORF barcode demultiplexing and quality control to isolate per-TF differential expression.
Load-bearing premise
Embryoid body cells supply a valid external baseline whose shared patterns represent only non-specific artifacts and do not remove or confound genuine TF-specific transcriptional changes.
What would settle it
If independent targeted TF perturbation experiments in matched cell types show that the recovered signatures share no more overlap with ground-truth TF targets than the one-vs-rest signatures do, the background-subtraction recovery would be falsified.
Figures


read the original abstract
Public pooled single-cell perturbation atlases are valuable resources for studying transcription factor (TF) function, but downstream re-analysis can be limited by incomplete deposited metadata and missing internal controls. Here we re-analyze the human TF Atlas dataset (GSE216481), a MORF-based pooled overexpression screen spanning 3,550 TF open reading frames and 254,519 cells, with a reproducible pipeline for quality control, MORF barcode demultiplexing, per-TF differential expression, and functional enrichment. From 77,018 cells in the pooled screen, we assign 60,997 (79.2\%) to 87 TF identities. Because the deposited barcode mapping lacks the GFP and mCherry negative controls present in the original library, we use embryoid body (EB) cells as an external baseline and remove shared batch/transduction artifacts by background subtraction. This strategy recovers TF-specific signatures for 59 of 61 testable TFs, compared with 27 detected by one-vs-rest alone, showing that robust TF-level signal can be rescued despite missing intra-pool controls. HOPX, MAZ, PAX6, FOS, and FEZF2 emerge as the strongest transcriptional remodelers, while per-TF enrichment links FEZF2 to regulation of differentiation, EGR1 to Hippo and cardiac programs, FOS to focal adhesion, and NFIC to collagen biosynthesis. Condition-level analyses reveal convergent Wnt, neurogenic, EMT, and Hippo signatures, and Harmony indicates minimal confounding batch effects across pooled replicates. Our per-TF effect sizes significantly agree with Joung et al.'s published rankings (Spearman $\rho = -0.316$, $p = 0.013$; negative because lower rank indicates stronger effect). Together, these results show that the deposited TF Atlas data can support validated TF-specific transcriptional and pathway analyses when paired with principled external controls, artifact removal, and reproducible computation.
Editorial analysis
A structured set of objections, weighed in public.
Referee Report
Summary. The manuscript re-analyzes the human TF Atlas pooled single-cell overexpression screen (GSE216481) spanning 3,550 TFs and 254,519 cells. Due to missing deposited GFP/mCherry negative controls, the authors employ embryoid body (EB) cells as an external baseline for background subtraction of shared batch/transduction artifacts. Using a reproducible pipeline for QC, MORF barcode demultiplexing, per-TF differential expression, and enrichment, they assign 79.2% of 77,018 screened cells to 87 TF identities and recover TF-specific signatures for 59 of 61 testable TFs (versus 27 by one-vs-rest). Top remodelers include HOPX, MAZ, PAX6, FOS, and FEZF2; per-TF and condition-level enrichments link TFs to differentiation, Hippo, cardiac, focal adhesion, and collagen programs. Harmony shows minimal batch effects, and per-TF effect sizes correlate with Joung et al. rankings (Spearman ρ = -0.316, p = 0.013).
Significance. If the EB baseline validly isolates TF effects, the work demonstrates a practical, reproducible strategy for rescuing TF-specific signals from incomplete public perturbation atlases, substantially increasing detectable signatures and enabling pathway analyses. The agreement with an independent prior ranking and the identification of convergent Wnt/neurogenic/EMT/Hippo programs add value for the field.
major comments (1)
- [Abstract and Methods] Abstract and Methods: The assumption that embryoid body cells contain only batch/transduction artifacts (with no overlapping differentiation or TF-related programs) is load-bearing for the central claim of recovering 59/61 signatures via background subtraction. No direct comparison to the original negative controls, no orthogonal validation of the subtracted gene set, and no sensitivity analysis of how partial signal removal would affect the Spearman correlation are described; this leaves open the possibility that the reported improvement over one-vs-rest partly reflects signal loss rather than rescue.
minor comments (2)
- [Abstract] Abstract: The reported cell assignment rate (79.2%), recovery counts, and Spearman correlation lack accompanying statistical test details, error bars, multiple-testing correction information, or sample-size clarification, which would strengthen assessment of the 59/61 recovery figure.
- [Abstract] Abstract: The negative sign of the Spearman correlation is explained, but the exact ranking metric from Joung et al. and whether the test accounts for ties should be stated explicitly for reproducibility.
Simulated Author's Rebuttal
We thank the referee for their constructive comments on our re-analysis of the TF Atlas dataset. We address the major concern point-by-point below and commit to revisions where feasible.
read point-by-point responses
-
Referee: [Abstract and Methods] Abstract and Methods: The assumption that embryoid body cells contain only batch/transduction artifacts (with no overlapping differentiation or TF-related programs) is load-bearing for the central claim of recovering 59/61 signatures via background subtraction. No direct comparison to the original negative controls, no orthogonal validation of the subtracted gene set, and no sensitivity analysis of how partial signal removal would affect the Spearman correlation are described; this leaves open the possibility that the reported improvement over one-vs-rest partly reflects signal loss rather than rescue.
Authors: We agree that the EB baseline assumption is central and that additional checks would strengthen the manuscript. The GFP/mCherry negative controls were not deposited with GSE216481, precluding direct comparison. EB cells were selected as an external baseline because they undergo comparable differentiation without TF overexpression, enabling subtraction of shared batch and transduction effects; this choice is justified by the similar culture conditions and the fact that EB cells lack the MORF barcodes used for TF assignment. To address potential signal loss, we will add a sensitivity analysis in the revised Methods and Results: we will vary the background subtraction threshold (e.g., using different quantiles of EB expression) and report the resulting changes in the number of recovered TF signatures (currently 59/61) and the Spearman correlation with Joung et al. rankings. We will also expand the Methods justification for EB with references to EB composition in the literature. While we lack independent orthogonal data for the subtracted gene set, the recovered signatures show biological coherence (e.g., FEZF2 linked to differentiation, FOS to focal adhesion) and the per-TF effect sizes correlate significantly with an independent ranking (ρ = -0.316, p = 0.013), supporting that the improvement over one-vs-rest reflects artifact removal rather than loss of true signal. revision: partial
- Direct comparison to the original GFP/mCherry negative controls cannot be performed because they are absent from the deposited dataset.
Circularity Check
No circularity: external EB baseline and independent validation keep derivation self-contained
full rationale
The paper subtracts shared patterns using embryoid body cells that are explicitly external to the pooled screen (not part of GSE216481) and reports Spearman agreement with Joung et al. rankings from a prior independent study. No equations, fitted parameters, or self-citations reduce the recovered TF signatures (59/61) or effect sizes to quantities defined or fitted from the same screen data. The one-vs-rest comparison and Harmony batch check are standard downstream steps that do not create self-referential loops. This is the normal case of an analysis anchored on external controls and external benchmarks.
Axiom & Free-Parameter Ledger
free parameters (1)
- TF assignment and detection thresholds
axioms (1)
- domain assumption Embryoid body cells serve as a suitable external negative control whose shared expression patterns represent only batch and transduction artifacts
Lean theorems connected to this paper
-
IndisputableMonolith/Cost/FunctionalEquation.leanwashburn_uniqueness_aczel unclear?
unclearRelation between the paper passage and the cited Recognition theorem.
we use embryoid body (EB) cells as an external baseline and remove shared batch/transduction artifacts by background subtraction. This strategy recovers TF-specific signatures for 59 of 61 testable TFs
What do these tags mean?
- matches
- The paper's claim is directly supported by a theorem in the formal canon.
- supports
- The theorem supports part of the paper's argument, but the paper may add assumptions or extra steps.
- extends
- The paper goes beyond the formal theorem; the theorem is a base layer rather than the whole result.
- uses
- The paper appears to rely on the theorem as machinery.
- contradicts
- The paper's claim conflicts with a theorem or certificate in the canon.
- unclear
- Pith found a possible connection, but the passage is too broad, indirect, or ambiguous to say the theorem truly supports the claim.
Reference graph
Works this paper leans on
-
[1]
The human transcription factors
Samuel A Lambert, Arttu Jolma, Laura F Campitelli, Prem K Das, Yimeng Yin, Mihai Albu, Xiaoting Chen, Jussi Taipale, Timothy R Hughes, and Matthew T Weirauch. The human transcription factors. Cell, 172 0 (4): 0 650--665, 2018
work page 2018
-
[2]
A census of human transcription factors: function, expression and evolution
Juan M Vaquerizas, Sarah K Kummerfeld, Sarah A Teichmann, and Nicholas M Luscombe. A census of human transcription factors: function, expression and evolution. Nature Reviews Genetics, 10 0 (4): 0 252--263, 2009
work page 2009
-
[3]
Fulco, Livnat Jerby-Arnon, Nemanja D
Atray Dixit, Oren Parnas, Biyu Li, Jenny Chen, Charles P. Fulco, Livnat Jerby-Arnon, Nemanja D. Marjanovic, Danielle Dionne, Tyler Burks, Raktima Raychowdhury, Britt Adamson, Thomas M. Norman, Eric S. Lander, Jonathan S. Weissman, Nir Friedman, and Aviv Regev. Perturb-seq: dissecting molecular circuits with scalable single-cell rna profiling of pooled gen...
work page 2016
-
[4]
Mapping information-rich genotype-phenotype landscapes with genome-scale perturb-seq
Joseph M Replogle, Reuben A Saunders, Angela N Pogson, Jeffrey A Hussmann, Alexander Lenail, Alina Guna, Lauren Mascibroda, Eric J Wagner, Karen Adelman, Jennifer A Doudna, et al. Mapping information-rich genotype-phenotype landscapes with genome-scale perturb-seq. Cell, 185 0 (14): 0 2559--2575, 2022
work page 2022
-
[5]
A transcription factor atlas of directed differentiation
Julia Joung, Sai Ma, Tristan Tay, Kathryn R Geiger-Schuller, Paul C Kirchgatterer, Vanessa K Verdine, Baolin Guo, Mario Arias-Garcia, William E Allen, Isha Singh, et al. A transcription factor atlas of directed differentiation. Cell, 186 0 (1): 0 209--229, 2023
work page 2023
-
[6]
Current best practices in single-cell rna-seq analysis: a tutorial
Malte D Luecken and Fabian J Theis. Current best practices in single-cell rna-seq analysis: a tutorial. Molecular Systems Biology, 15 0 (6): 0 e8746, 2019
work page 2019
-
[7]
Scanpy: large-scale single-cell gene expression data analysis
F Alexander Wolf, Philipp Angerer, and Fabian J Theis. Scanpy: large-scale single-cell gene expression data analysis. Genome Biology, 19 0 (1): 0 1--5, 2018
work page 2018
-
[8]
Comprehensive integration of single-cell data
Tim Stuart, Andrew Butler, Paul Hoffman, Christoph Hafemeister, Efthymia Papalexi, William M Mauck, Yuhan Hao, Marlon Stoeckius, Peter Smibert, and Rahul Satija. Comprehensive integration of single-cell data. Cell, 177 0 (7): 0 1888--1902, 2019
work page 1902
-
[9]
Enrichr: a comprehensive gene set enrichment analysis web server 2016 update
Maxim V Kuleshov, Matthew R Jones, Andrew D Rouillard, Nicolas F Fernandez, Qiaonan Duan, Zichen Wang, Simon Koplev, Sherry L Jenkins, Kathleen M Jagodnik, Alexander Lachmann, et al. Enrichr: a comprehensive gene set enrichment analysis web server 2016 update. Nucleic Acids Research, 44 0 (W1): 0 W90--W97, 2016
work page 2016
-
[10]
Gseapy: a comprehensive package for performing gene set enrichment analysis in python
Zhuoqing Fang, Xinyuan Liu, and Gary Peltz. Gseapy: a comprehensive package for performing gene set enrichment analysis in python. Bioinformatics, 39 0 (1): 0 btac757, 2023
work page 2023
-
[11]
Bin Chen, Laura R Schaevitz, and Susan K McConnell. Fezl regulates the differentiation and axon targeting of layer 5 subcortical projection neurons in cerebral cortex. Proceedings of the National Academy of Sciences, 102 0 (47): 0 17184--17189, 2005
work page 2005
-
[12]
Fast, sensitive and accurate integration of single-cell data with harmony
Ilya Korsunsky, Nghia Millard, Jean Fan, Kamil Slowikowski, Fan Zhang, Kevin Wei, Yuriy Baglaenko, Michael Brenner, Po-ru Loh, and Soumya Raychaudhuri. Fast, sensitive and accurate integration of single-cell data with harmony. Nature Methods, 16 0 (12): 0 1289--1296, 2019
work page 2019
-
[13]
Efthymia Papalexi, Eleni P Mimitou, Andrew W Butler, Samantha Foster, Bernadette Bracken, William M Mauck, Hans-Hermann Wessels, Yuhan Hao, Bonnie V Yeung, Peter Smibert, et al. Characterizing the molecular regulation of inhibitory immune checkpoints with multimodal single-cell screens. Nature Genetics, 53 0 (3): 0 322--331, 2021
work page 2021
-
[14]
Mingze Dong, Bao Wang, Jessica Wei, Antonio H. de O. Fonseca, Curtis J. Perry, Alexander Frey, Feriel Ouerghi, Ellen F. Foxman, Jeffrey J. Ishizuka, Rahul M. Dhodapkar, and David van Dijk. Causal identification of single-cell experimental perturbation effects with cinema-ot. Nature Methods, 20 0 (11): 0 1769--1779, 2023
work page 2023
discussion (0)
Sign in with ORCID, Apple, or X to comment. Anyone can read and Pith papers without signing in.