Recognition: 2 theorem links
· Lean TheoremDeepDISC-Euclid: Source Classification and Photometric Redshifts in Euclid Deep Field North With a Pixel-Level Deep Learning Approach
Pith reviewed 2026-05-13 18:36 UTC · model grok-4.3
The pith
A pixel-level deep learning framework applied to Euclid Deep Field North nine-band images delivers source detection at 93 percent completeness with 90 percent true purity plus classifications and photometric redshifts for galaxies and quas
A machine-rendered reading of the paper's core claim, the machinery that carries it, and where it could break.
Core claim
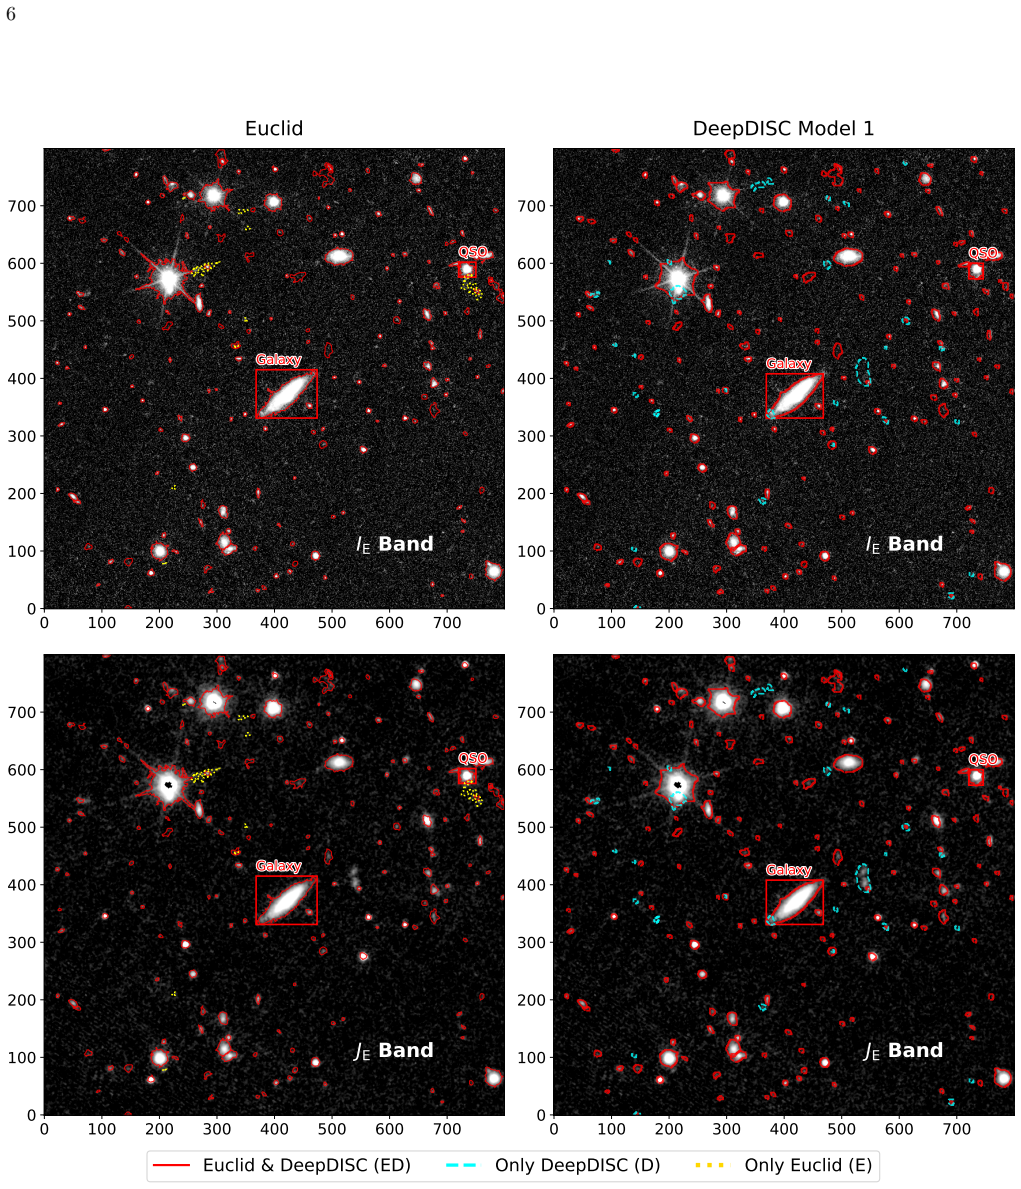
DeepDISC uses a pixel-level deep learning framework trained on Euclid Q1 source catalog and DESI DR1 spectroscopic redshifts to perform source detection and classification on 9-band images, followed by separate photo-z estimation for galaxies and quasars. It achieves ~93% completeness and ~80% purity in detection (with ~90% true purity vs JWST), correctly recovers 99.2% of stars, 99.0% of galaxies, and 84.8% of quasars according to spectroscopic classifications, and produces photo-zs in good agreement with spec-zs. This provides comparable or improved performance over other Euclid Q1 products in detection/deblending, classification, and photo-z, especially for quasars.
What carries the argument
DeepDISC, a deep learning model that ingests 9-band images simultaneously to detect sources, classify them as stars, galaxies or quasars, and estimate photometric redshifts with dedicated galaxy and quasar branches.
If this is right
- Source detection reaches 93% completeness and 80% purity against the Euclid catalog.
- True source purity is estimated at 90% using JWST as reference.
- Classification recovers over 99% of stars and galaxies and 85% of quasars from spectroscopic labels.
- Photometric redshifts agree well with spectroscopic redshifts for both galaxies and quasars.
- The released catalog covers 13 million objects in EDF-N with classifications and photo-z probability distributions.
Where Pith is reading between the lines
- If training labels improve in future data releases, the accuracy for faint quasars should rise further.
- Similar pixel-level methods could be applied to other Euclid deep fields for uniform catalogs.
- Combining this approach with data from the Roman Space Telescope might enhance photo-z precision through broader wavelength coverage.
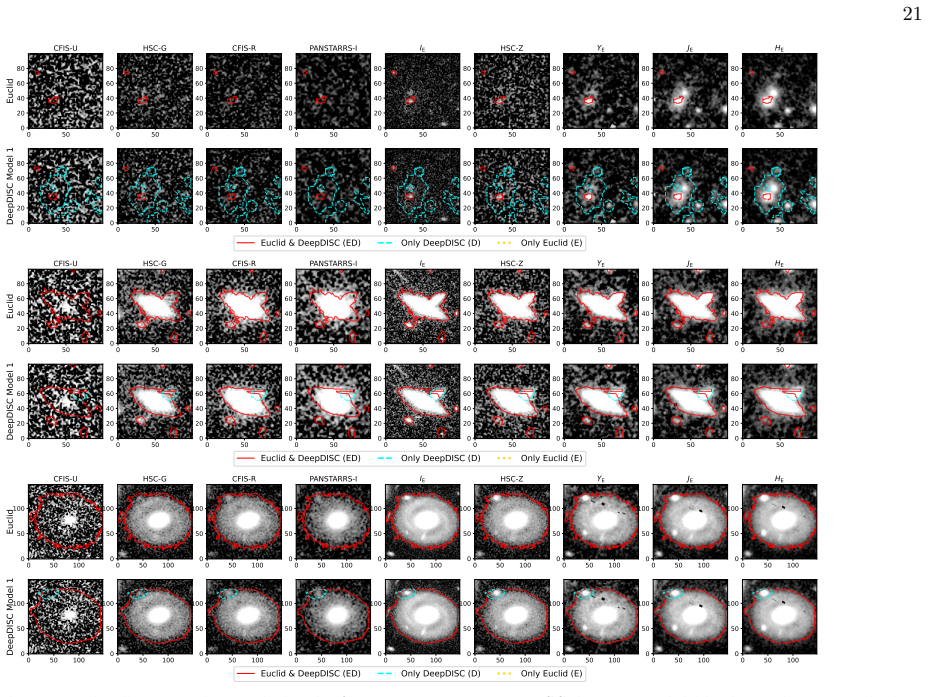
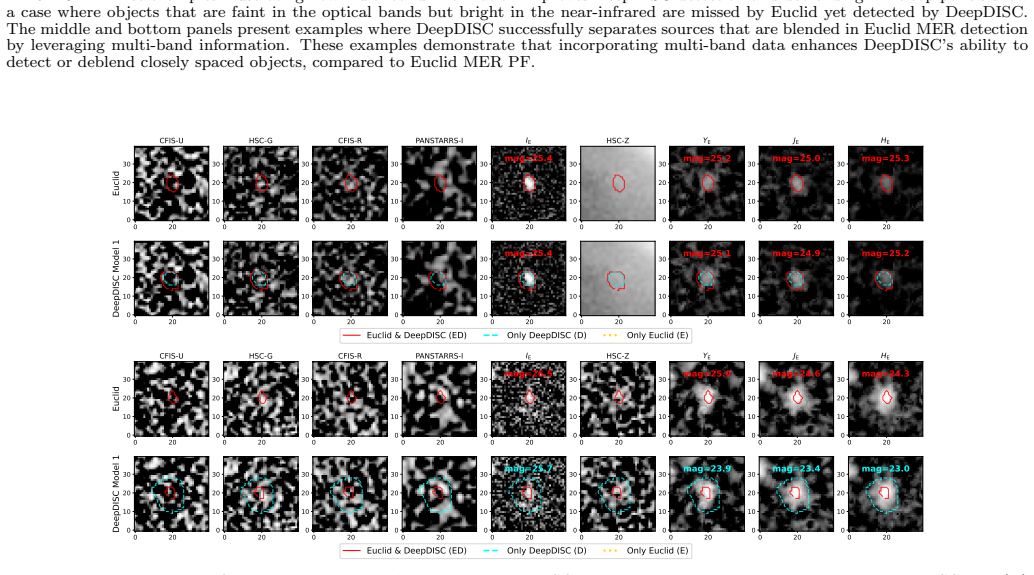
- Traditional catalog-based methods may underperform in deblending compared to this image-level learning in crowded regions.
Load-bearing premise
The training labels drawn from the Euclid Q1 source catalog and DESI DR1 spectroscopic redshifts are assumed to be sufficiently complete and unbiased for all magnitudes, colors, and object types in the field.
What would settle it
A deeper, more complete reference catalog from future JWST or spectroscopic observations revealing a purity significantly below 80% or classification recovery below 85% for quasars would falsify the performance claims.
Figures


read the original abstract
The first Euclid Quick Data Release (Q1) provides extensive imaging and spectroscopic data for hundreds of millions of photometric objects across several deep fields. Accurate classifications and photometric redshifts (photo-z) for these sources are crucial to maximizing the value of these data. In this work, we perform source classification and photo-z estimation for the Euclid Deep Field North (EDF-N) around the North Ecliptic Pole, using a deep learning framework (DeepDISC) that learns and infers using 9-band images simultaneously. We train three dedicated models for (1) source detection and classification, (2) galaxy photo-z, and (3) quasar photo-z. The Euclid Q1 input source catalog, and classifications and spectroscopic redshifts (spec-z) from the Dark Energy Spectroscopic Instrument Data Release 1 are adopted as our training data. DeepDISC source detection achieves overall completeness of ~93% and purity of ~80% if using the Euclid source catalog as the ground truth. Using a JWST source catalog within EDF-N as the reference, we estimate a true purity of ~ 90% for DeepDISC sources. About 99.2%, 99.0%, and 84.8% of stars, galaxies, and quasars, respectively, are correctly recovered with their spectroscopic classifications. The DeepDISC photo-zs show good agreement with spectroscopic redshifts, for both galaxies and quasars. Comparisons with other Euclid Q1 products demonstrate that DeepDISC provides comparable or improved performance in source detection/deblending, classification and photo-z, especially for quasars. These results demonstrate the potential of pixel-level deep learning approaches for large-scale sky surveys such as Euclid and Roman, which will continue to improve with better training labels. We release the full DeepDISC source catalog (~13 million objects) for EDF-N with classifications and photo-zs, including photo-z probability distributions.
Editorial analysis
A structured set of objections, weighed in public.
Referee Report
Summary. The manuscript presents DeepDISC, a pixel-level deep learning framework applied to 9-band Euclid Q1 imaging in the Euclid Deep Field North (EDF-N). Three models are trained on labels from the Euclid Q1 source catalog and DESI DR1 spectroscopic redshifts to perform source detection/classification (stars/galaxies/quasars), galaxy photo-z estimation, and quasar photo-z estimation. Reported metrics include ~93% completeness and ~80% purity relative to the Euclid catalog (with ~90% true purity vs. a JWST reference), recovery rates of 99.2% (stars), 99.0% (galaxies), and 84.8% (quasars), and good photo-z agreement with spec-z; the work claims comparable or improved performance over other Euclid Q1 products and releases a catalog of ~13 million objects with classifications and photo-z PDFs.
Significance. If the performance holds under more independent validation, the work demonstrates the practical utility of simultaneous multi-band pixel-level deep learning for source deblending, classification, and photo-z in large surveys such as Euclid. The public release of the full EDF-N catalog with probability distributions is a concrete strength that supports community reuse and further testing.
major comments (2)
- [§4] §4 (performance metrics): Completeness (~93%) and purity (~80%) are evaluated against the same Euclid Q1 source catalog used to supply training labels. This setup creates circularity that risks overestimating detection performance, as the model is optimized to reproduce the catalog's detections; the limited JWST overlap provides only a partial external anchor and does not fully mitigate the concern for the full field.
- [§4.3] §4.3 (quasar recovery): The 84.8% quasar recovery rate assumes DESI DR1 spec-z provide an unbiased sample across magnitude, color, and redshift; DESI fiber targeting and selection functions are known to miss subpopulations, and this potential bias is not quantified or tested against an alternative quasar reference.
minor comments (2)
- [§3] The description of the training/validation split and any steps taken to prevent data leakage between the Euclid Q1 labels and the evaluation should be expanded for clarity.
- [Figure 5] Figure captions and axis labels for the photo-z comparison plots would benefit from explicit mention of the outlier fraction definition used.
Simulated Author's Rebuttal
We thank the referee for the constructive comments and the recommendation for minor revision. We address each major comment point by point below.
read point-by-point responses
-
Referee: §4 (performance metrics): Completeness (~93%) and purity (~80%) are evaluated against the same Euclid Q1 source catalog used to supply training labels. This setup creates circularity that risks overestimating detection performance, as the model is optimized to reproduce the catalog's detections; the limited JWST overlap provides only a partial external anchor and does not fully mitigate the concern for the full field.
Authors: We agree that evaluating detection performance against the training catalog introduces circularity, as the model is trained to reproduce the Euclid Q1 detections. This is an inherent limitation of supervised approaches when no fully independent large-scale reference exists. The JWST overlap provides an external check yielding ~90% true purity, which we already report. We will revise §4 to explicitly discuss this circularity, clarify that the metrics measure fidelity to the input catalog, and emphasize the independent JWST validation as the primary external anchor. The reported numbers themselves will remain unchanged. revision: partial
-
Referee: §4.3 (quasar recovery): The 84.8% quasar recovery rate assumes DESI DR1 spec-z provide an unbiased sample across magnitude, color, and redshift; DESI fiber targeting and selection functions are known to miss subpopulations, and this potential bias is not quantified or tested against an alternative quasar reference.
Authors: We acknowledge that DESI DR1 quasar samples are affected by fiber-targeting selection biases. The 84.8% recovery rate is computed only for objects with existing DESI spectroscopic classifications and redshifts; it does not claim to represent the full underlying quasar population. No alternative large-area quasar reference catalog is available for the entire EDF-N that would allow a direct bias quantification. We will add a dedicated paragraph in §4.3 noting this limitation and stating that the recovery statistics are relative to the available spectroscopic subsample. revision: partial
Circularity Check
No significant circularity: performance metrics are standard supervised evaluations against external labels with independent JWST cross-check
full rationale
The paper trains DeepDISC models on labels from the Euclid Q1 source catalog and DESI DR1 spectroscopic redshifts, then reports completeness (~93%), purity (~80%), classification recovery rates, and photo-z agreement using those catalogs as ground truth while additionally validating true purity (~90%) against a JWST source catalog. This follows standard supervised learning practice of measuring model output against provided training/evaluation labels, with an external benchmark for one metric. No equations or steps reduce by construction to the inputs (no self-definitional definitions, no fitted parameters renamed as independent predictions). No load-bearing self-citations or ansatzes are present in the derivation. The claims are empirically grounded in comparisons to independent external references rather than internal tautology.
Axiom & Free-Parameter Ledger
axioms (1)
- domain assumption The Euclid Q1 source catalog and DESI DR1 spectroscopic redshifts provide sufficiently complete and unbiased training labels across the magnitude and color range of EDF-N.
Lean theorems connected to this paper
-
IndisputableMonolith/Cost/FunctionalEquation.leanwashburn_uniqueness_aczel unclear?
unclearRelation between the paper passage and the cited Recognition theorem.
We train three dedicated models for (1) source detection and classification, (2) galaxy photo-z, and (3) quasar photo-z... using 9-band images simultaneously.
-
IndisputableMonolith/Foundation/RealityFromDistinction.leanreality_from_one_distinction unclear?
unclearRelation between the paper passage and the cited Recognition theorem.
DeepDISC source detection achieves overall completeness of ~93% and purity of ~80% if using the Euclid source catalog as the ground truth.
What do these tags mean?
- matches
- The paper's claim is directly supported by a theorem in the formal canon.
- supports
- The theorem supports part of the paper's argument, but the paper may add assumptions or extra steps.
- extends
- The paper goes beyond the formal theorem; the theorem is a base layer rather than the whole result.
- uses
- The paper appears to rely on the theorem as machinery.
- contradicts
- The paper's claim conflicts with a theorem or certificate in the canon.
- unclear
- Pith found a possible connection, but the passage is too broad, indirect, or ambiguous to say the theorem truly supports the claim.
Forward citations
Cited by 1 Pith paper
-
A systematic evaluation of vision-language models for observational astronomical reasoning tasks
Vision-language models underperform specialized astronomical methods on real observational data, with accuracy improving when physical explanations are provided in prompts and when raw numerical measurements replace r...
Reference graph
Works this paper leans on
-
[1]
Bishop, C. M. 1994, Technical Report NCRG/94/004 Brammer, G. B., van Dokkum, P. G., & Coppi, P. 2008, ApJ, 686, 1503, doi: 10.1086/591786 Burke, C. J., Aleo, P. D., Chen, Y.-C., et al. 2019, MNRAS, 490, 3952, doi: 10.1093/mnras/stz2845 Cai, Z., & Vasconcelos, N. 2018, in Proceedings of the IEEE conference on computer vision and pattern recognition, 6154–6...
-
[2]
Data Release 1 of the Dark Energy Spectroscopic Instrument
https://arxiv.org/abs/1910.01259 Deng, J., Dong, W., Socher, R., et al. 2009, in 2009 IEEE conference on computer vision and pattern recognition, IEEE, 248–255 18 DESI Collaboration, Karim, M. A., Adame, A. G., et al. 2025, arXiv e-prints, arXiv:2503.14745, doi: 10.48550/arXiv.2503.14745 Dey, A., Schlegel, D. J., Lang, D., et al. 2019, AJ, 157, 168, doi: ...
work page internal anchor Pith review doi:10.48550/arxiv.2503.14745 1910
discussion (0)
Sign in with ORCID, Apple, or X to comment. Anyone can read and Pith papers without signing in.