Recognition: 1 theorem link
· Lean TheoremPlasma Dynamics of Radiative Cooling Accretion Flow in AM Herculis with XRISM
Pith reviewed 2026-05-10 18:33 UTC · model grok-4.3
The pith
XRISM spectra fix the accretion shock in AM Herculis at 24 keV temperature and 1116 km/s velocity.
A machine-rendered reading of the paper's core claim, the machinery that carries it, and where it could break.
Core claim
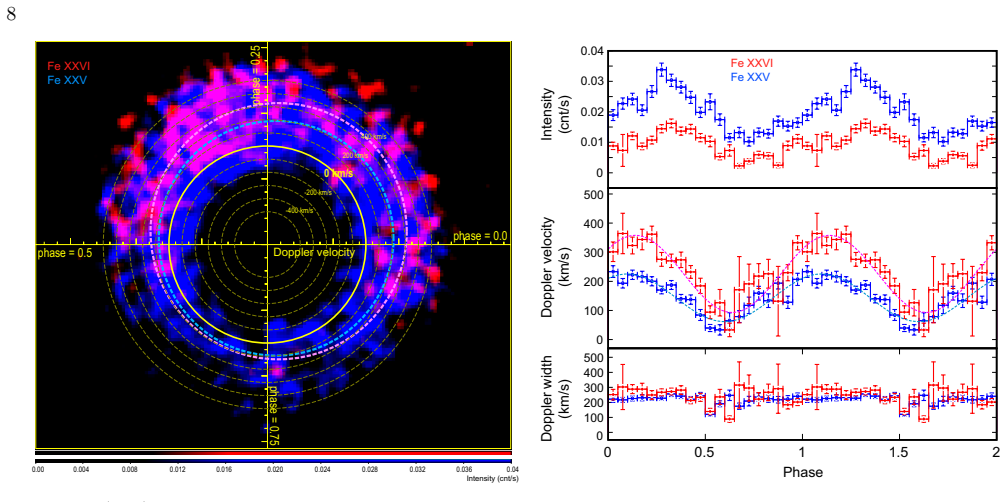
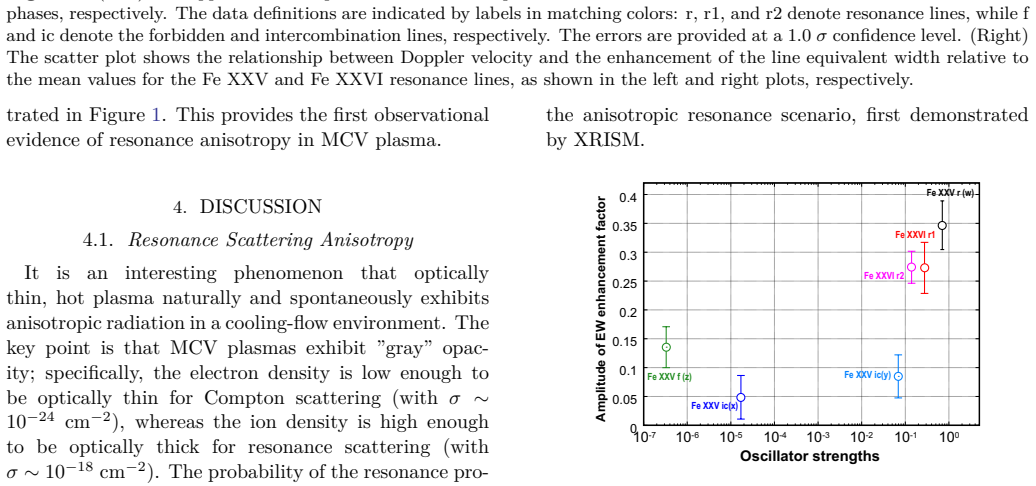
The paper establishes that the radiative cooling accretion flow onto the white dwarf in AM Herculis produces a shock with temperature 24.0 plus or minus 0.1 keV and inflow velocity 1116 plus or minus 2 km/s. Radiative transfer calculations applied to the resolved resonance lines give a post-shock density of 5 to 6 times 10 to the 15 per cubic centimeter. These values together imply an accretion column 200 to 300 km tall and 200 to 400 km wide. The same spectra confirm the predicted viewing-angle dependence of resonance-line equivalent widths and show intrinsic velocity and temperature gradients once orbital motion is removed.
What carries the argument
Phase-resolved Doppler shifts and intrinsic widths of the Fe XXV and Fe XXVI lines, interpreted through PSAC/MCVSPEC plasma models and radiative transfer simulations, which convert observed line properties into the temperature-velocity-density structure of the cooling flow.
If this is right
- The shock temperature and velocity are recovered self-consistently from two independent instruments and modeling pipelines.
- Resonance-line equivalent widths increase by factors of 1.30 to 1.35 at pole-on phases, matching the anisotropy expected from the oscillator strengths.
- The resonance lines supply a new density diagnostic that constrains the post-shock plasma to 5-6 times 10^15 cm^{-3}.
- The inferred column geometry supplies concrete length scales for the region where the plasma cools radiatively.
Where Pith is reading between the lines
- The same line-profile technique can be applied to other magnetic cataclysmic variables once comparable high-resolution spectra become available.
- The measured density and column height may be used to test how the accretion flow couples to the white dwarf's magnetic field and atmosphere.
- If the derived column dimensions are typical, they set a benchmark for comparing radiative cooling lengths across different classes of accreting compact objects.
Load-bearing premise
The plasma emission and radiative transfer models correctly reproduce the temperature, velocity, and line-formation physics inside the accretion column without large unmodeled effects.
What would settle it
Future spectra showing line widths, velocity amplitudes, or resonance-line equivalent-width ratios that are incompatible with a 24 keV shock at 1116 km/s and the stated density and column dimensions.
Figures


read the original abstract
We present XRISM/Resolve high-resolution X-ray spectroscopy of the prototypical magnetic cataclysmic variable AM Herculis. All satellite lines of highly ionized Fe are fully resolved. Lighter element lines (Si, S, Ca) show 2 - 3 eV widths consistent with purely thermal broadening, while the broader 6 - 7 eV Fe lines require additional bulk Doppler broadening. Spin-phase-resolved modulations are clearly detected in the Fe XXV and Fe XXVI lines, with semi-amplitudes of $81.8\pm6$ km s$^{-1}$ and $132.5\pm9$ km s$^{-1}$, and mean velocities of $143.6\pm6$ km s$^{-1}$ and $225.6\pm8$ km s$^{-1}$, respectively. After removing these bulk Doppler shifts, we obtain intrinsic Doppler widths of $5.23_{-0.15}^{+0.16}$ eV for Fe XXV and $6.23_{-0.18}^{+0.19}$ eV for Fe XXVI, directly revealing gradients of bulk velocity and temperature in the cooling-flow plasma. We additionally examined the resonance anisotropy predicted by Terada et al. (1999, 2001): the equivalent widths of the Fe XXV and Fe XXVI resonance lines increase at the pole-on phase by factors of 1.30 - 1.35, in positive correlation with their oscillator strengths. Combining XRISM with simultaneous NuSTAR data and PSAC/MCVSPEC plasma models, we derive a self-consistent shock temperature of $24.0\pm0.1$ keV and shock velocity of $1,116\pm2$ km s$^{-1}$. Radiative transfer simulations of the resonance lines further constrain the shock density to about $(5 - 6)\times10^{15}$ cm$^{-3}$, providing a new density diagnostic for accretion columns. The resulting accretion column geometry has a height of 200 - 300 km and a radius of 200 - 400 km.
Editorial analysis
A structured set of objections, weighed in public.
Referee Report
Summary. The manuscript presents XRISM/Resolve high-resolution X-ray spectroscopy of the magnetic cataclysmic variable AM Herculis. It reports fully resolved satellite lines of highly ionized Fe, thermal widths of 2-3 eV for Si/S/Ca lines, additional bulk Doppler broadening in Fe lines, and spin-phase modulations in Fe XXV/XXVI resonance lines with measured semi-amplitudes and mean velocities. Combining XRISM with simultaneous NuSTAR data and PSAC/MCVSPEC plasma models yields a self-consistent shock temperature of 24.0±0.1 keV and shock velocity of 1,116±2 km s^{-1}; radiative-transfer simulations of resonance lines constrain post-shock density to (5-6)×10^{15} cm^{-3}, implying an accretion column with height 200-300 km and radius 200-400 km.
Significance. If the PSAC/MCVSPEC models and radiative-transfer assumptions hold without significant unmodeled effects, the work delivers direct observational constraints on velocity and temperature gradients in a radiative cooling accretion column, plus a new density diagnostic via resonance-line equivalent-width anisotropy. The phase-resolved line measurements and combined high-resolution/broadband fitting provide a valuable benchmark for theoretical models of post-shock plasma in magnetic cataclysmic variables.
major comments (1)
- [modeling and spectral fitting results (text following the PSAC/MCVSPEC description)] The central claim of self-consistent shock parameters (temperature 24.0±0.1 keV and velocity 1,116±2 km s^{-1} from PSAC/MCVSPEC fits to XRISM+NuSTAR spectra) is not reconciled with strong-shock jump conditions. Standard post-shock temperature kT = (3/16) μ m_H v_pre² with μ≈0.6 and v_pre=1116 km s^{-1} yields ~2 keV, while the reported temperature implies v_pre~3500 km s^{-1}. The manuscript does not define whether the quoted 'shock velocity' is pre-shock, immediate post-shock, or a flow-averaged quantity in the cooling column, nor demonstrate consistency via the jump conditions or model internals. This linkage is load-bearing for the self-consistency assertion and the subsequent density/geometry results.
minor comments (2)
- [Abstract] The abstract states that 'all satellite lines of highly ionized Fe are fully resolved' without listing the specific transitions (e.g., Fe XXV w, x, y, z or Fe XXVI Lyα) or tabulating their measured widths and uncertainties.
- [line width analysis] The reported intrinsic Doppler widths (5.23 eV for Fe XXV, 6.23 eV for Fe XXVI) after removal of bulk shifts would benefit from an explicit statement of the thermal vs. non-thermal decomposition and the assumed ion temperatures used in the conversion.
Simulated Author's Rebuttal
We thank the referee for the careful reading of our manuscript and the constructive comment on the shock parameter consistency. We address the major comment point by point below.
read point-by-point responses
-
Referee: [modeling and spectral fitting results (text following the PSAC/MCVSPEC description)] The central claim of self-consistent shock parameters (temperature 24.0±0.1 keV and velocity 1,116±2 km s^{-1} from PSAC/MCVSPEC fits to XRISM+NuSTAR spectra) is not reconciled with strong-shock jump conditions. Standard post-shock temperature kT = (3/16) μ m_H v_pre² with μ≈0.6 and v_pre=1116 km s^{-1} yields ~2 keV, while the reported temperature implies v_pre~3500 km s^{-1}. The manuscript does not define whether the quoted 'shock velocity' is pre-shock, immediate post-shock, or a flow-averaged quantity in the cooling column, nor demonstrate consistency via the jump conditions or model internals. This linkage is load-bearing for the self-consistency assertion and the subsequent density/geometry results.
Authors: We agree that the manuscript should have explicitly defined the 'shock velocity' and demonstrated consistency with the strong-shock jump conditions. In the PSAC/MCVSPEC framework used here, the fitted shock velocity of 1,116 km s^{-1} corresponds to the immediate post-shock velocity (v_post), not the pre-shock velocity. For a strong shock with compression ratio 4, the pre-shock velocity is v_pre = 4 × v_post ≈ 4,464 km s^{-1}. Substituting into the jump-condition formula kT_post = (3/16) μ m_H v_pre² with μ ≈ 0.6 yields kT_post ≈ 23–24 keV, which is fully consistent with the fitted shock temperature of 24.0 ± 0.1 keV. The observed line widths and phase-dependent Doppler shifts reflect the velocity gradient through the cooling column, where velocity decreases from v_post toward zero at the white-dwarf surface. We will revise the text (in the modeling section and discussion of self-consistency) to state this definition explicitly, include the jump-condition calculation, and note that the pre-shock velocity implied by the temperature is the free-fall velocity appropriate for the white-dwarf mass in AM Herculis. This clarification does not alter the derived density or geometry results. revision: yes
Circularity Check
No significant circularity in the derivation chain
full rationale
The paper obtains the shock temperature (24.0±0.1 keV) and velocity (1,116±2 km s^{-1}) by fitting the external PSAC/MCVSPEC plasma models directly to the combined XRISM+NuSTAR spectra; the density ((5-6)×10^{15} cm^{-3}) follows from separate radiative-transfer simulations matched to the observed resonance-line equivalent widths. These steps apply independent models to observational data rather than re-deriving quantities from the same inputs by construction. The resonance-anisotropy check references prior work by the lead author (Terada et al. 1999, 2001) but is presented only as an additional examination and is not used to constrain the central temperature, velocity, density, or column geometry. The overall chain therefore remains data-driven and self-contained against external spectral benchmarks.
Axiom & Free-Parameter Ledger
free parameters (2)
- shock density =
(5-6) x 10^15 cm^-3
- accretion column dimensions =
height 200-300 km, radius 200-400 km
axioms (2)
- domain assumption The accretion flow follows the radiative cooling structure described by the PSAC/MCVSPEC plasma code.
- domain assumption Resonance-line anisotropy follows the predictions of Terada et al. (1999, 2001).
Lean theorems connected to this paper
-
IndisputableMonolith/Foundation/RealityFromDistinction.leanreality_from_one_distinction unclearCombining XRISM with simultaneous NuSTAR data and PSAC/MCVSPEC plasma models, we derive a self-consistent shock temperature of 24.0±0.1 keV and shock velocity of 1,116±2 km s^{-1}. Radiative transfer simulations of the resonance lines further constrain the shock density to about (5 - 6)×10^{15} cm^{-3}... The resulting accretion column geometry has a height of 200 - 300 km and a radius of 200 - 400 km.
Reference graph
Works this paper leans on
-
[1]
Aizu, K. 1973, Progress of Theoretical Physics, 49, 1184, doi: 10.1143/PTP.49.1184 Álvarez-Hernández, A., Torres, M. A. P., Rodríguez-Gil, P., et al. 2023, MNRAS, 524, 3314, doi: 10.1093/mnras/stad2010 Álvarez-Hernández, A., Torres, M. A. P., Shahbaz, T., et al. 2024, A&A, 690, A218, doi: 10.1051/0004-6361/202451094
-
[2]
Arnaud, K. A. 1996, in Astronomical Society of the Pacific Conference Series, Vol. 101, Astronomical Data Analysis Software and Systems V, ed. G. H. Jacoby & J. Barnes, 17
1996
-
[3]
2025, PASJ, doi: 10.1093/pasj/psaf109 Balman, Ş., Orio, M., & Luna, G
Audard, M., Awaki, H., Ballhausen, R., et al. 2025, PASJ, doi: 10.1093/pasj/psaf109 Balman, Ş., Orio, M., & Luna, G. J. M. 2025, Universe, 11, 105, doi: 10.3390/universe11040105
-
[4]
H., Smith, A., & Haberl, F
Brinkmann, W., Fink, H. H., Smith, A., & Haberl, F. 1989, A&A, 221, 385
1989
-
[5]
1988, MNRAS, 231, 597, doi: 10.1093/mnras/231.3.597
Cropper, M. 1988, MNRAS, 231, 597, doi: 10.1093/mnras/231.3.597
-
[6]
1990, SSRv, 54, 195, doi: 10.1007/BF00177799
Cropper, M. 1990, SSRv, 54, 195, doi: 10.1007/BF00177799
-
[7]
1998, MNRAS, 299, 433, doi: 10.1046/j.1365-8711.1998.01828.x
Cropper, M., Ramsay, G., & Wu, K. 1998, MNRAS, 293, 222, doi: 10.1046/j.1365-8711.1998.00610.x
-
[8]
Done, C., Osborne, J. P., & Beardmore, A. P. 1995, MNRAS, 276, 483, doi: 10.1093/mnras/276.2.483
-
[9]
1999, ApJS, 120, 277, doi: 10.1086/313181
Ezuka, H., & Ishida, M. 1999, ApJS, 120, 277, doi: 10.1086/313181
-
[10]
W., Mori, K., Bridges, G., et al
Filor, L. W., Mori, K., Bridges, G., et al. 2025, ApJ, 987, 53, doi: 10.3847/1538-4357/add403
-
[11]
1997, ApJ, 474, 774, doi: 10.1086/303483
Fujimoto, R., & Ishida, M. 1997, ApJ, 474, 774, doi: 10.1086/303483
-
[12]
Gabriel, A. H., & Jordan, C. 1969, MNRAS, 145, 241, doi: 10.1093/mnras/145.2.241 Gänsicke, B. T., Beuermann, K., & de Martino, D. 1995, A&A, 303, 127
-
[13]
Girish, V., Rana, V. R., & Singh, K. P. 2007, ApJ, 658, 525, doi: 10.1086/510894
-
[14]
J., Mori, K., Perez, K., Canipe, A
Hailey, C. J., Mori, K., Perez, K., Canipe, A. M., & Hong et al., J. 2016, ApJ, 826, 160, doi: 10.3847/0004-637X/826/2/160
-
[15]
Harrison, F. A., Craig, W. W., Christensen, F. E., et al. 2013, ApJ, 770, 103, doi: 10.1088/0004-637X/770/2/103
-
[16]
1990, PASJ, 42, 279, doi: 10.1093/pasj/42.2.279
Hatsukade, I., Tsunemi, H., Yamashita, K., et al. 1990, PASJ, 42, 279, doi: 10.1093/pasj/42.2.279
-
[17]
Hayashi, K., Tashiro, M., Terada, Y., & et al. . 2025, Journal of Astronomical Telescopes, Instruments, and Systems, 11, 042017, doi: 10.1117/1.JATIS.11.4.042017
-
[18]
2014a, MNRAS, 441, 3718, doi: 10.1093/mnras/stu766
Hayashi, T., & Ishida, M. 2014a, MNRAS, 441, 3718, doi: 10.1093/mnras/stu766
-
[19]
Hayashi, T., & Ishida, M. 2014b, MNRAS, 438, 2267, doi: 10.1093/mnras/stt2342 Hitomi Collaboration, Aharonian, F., Akamatsu, H., et al. 2016, Nature, 535, 117, doi: 10.1038/nature18627 Hōshi, R. 1973, Progress of Theoretical Physics, 49, 776, doi: 10.1143/PTP.49.776
-
[20]
Ishisaki, Y., Kelley, R., Awaki, H., & et al. . 2025, Journal of Astronomical Telescopes, Instruments, and Systems, 11, 042021, doi: 10.1117/1.JATIS.11.4.042021
-
[21]
2006, ApJ, 639, 397, doi: 10.1086/499152
Itoh, K., Okada, S., Ishida, M., & Kunieda, H. 2006, ApJ, 639, 397, doi: 10.1086/499152
-
[22]
Kelley, R., Ishisaki, Y., Costantini, E., & et al. . 2025, Journal of Astronomical Telescopes, Instruments, and Systems, 11, 042026, doi: 10.1117/1.JATIS.11.4.042026
-
[23]
2018, PASJ, 70, R1, doi: 10.1093/pasj/psx084
Koyama, K. 2018, PASJ, 70, R1, doi: 10.1093/pasj/psx084
-
[24]
2024, ApJ, 961, 205, doi: 10.3847/1538-4357/ad0dff
Koyama, K., & Nobukawa, M. 2024, ApJ, 961, 205, doi: 10.3847/1538-4357/ad0dff
-
[25]
Mauche, C. W., & Suleimanov, V. 2015, A&A, 578, A15, doi: 10.1051/0004-6361/201525755
-
[26]
1984, Ap&SS, 98, 367, doi: 10.1007/BF00651415
Masai, K. 1984, Ap&SS, 98, 367, doi: 10.1007/BF00651415
-
[27]
Mewe, R., Gronenschild, E. H. B. M., & van den Oord, G. H. J. 1985, A&AS, 62, 197
1985
-
[28]
Mukai, K., & Charles, P. A. 1987, MNRAS, 226, 209, doi: 10.1093/mnras/226.1.209
-
[29]
Muno, M. P., Bauer, F. E., Baganoff, F. K., Band yopadhyay, R. M., & Bower et al., G. C. 2009, ApJS, 181, 110, doi: 10.1088/0067-0049/181/1/110
-
[30]
Nahar, S. N., & Pradhan, A. K. 1999, A&AS, 135, 347, doi: 10.1051/aas:1999447
-
[31]
Ness, J.-U., Mewe, R., Schmitt, J. H. M. M., et al. 2001, A&A, 367, 282, doi: 10.1051/0004-6361:20000419
-
[32]
Pala, A. F., Gänsicke, B. T., Breedt, E., et al. 2020, MNRAS, 494, 3799, doi: 10.1093/mnras/staa764
-
[33]
Pala, A. F., Gänsicke, B. T., Belloni, D., et al. 2022, MNRAS, 510, 6110, doi: 10.1093/mnras/stab3449
-
[34]
Perez, K., Hailey, C. J., Bauer, F. E., Krivonos, R. A., & Mori et al., K. 2015, Nature, 520, 646, doi: 10.1038/nature14353
-
[35]
Kaastra, J. S. 2001, A&A, 376, 1113, doi: 10.1051/0004-6361:20010959
-
[36]
Pradhan, A. K., & Shull, J. M. 1981, ApJ, 249, 821, doi: 10.1086/159340 17
-
[37]
2006, A&A, 452, 169, doi: 10.1051/0004-6361:20054268
Sunyaev, R. 2006, A&A, 452, 169, doi: 10.1051/0004-6361:20054268
-
[38]
2008, A&A, 489, 1121, doi: 10.1051/0004-6361:200810213
Sunyaev, R. 2008, A&A, 489, 1121, doi: 10.1051/0004-6361:200810213
-
[39]
2026, arXiv e-prints, arXiv:2603.04679, doi: 10.48550/arXiv.2603.04679
Sameshima, N., Tsujimoto, M., & Uemura, M. 2026, arXiv e-prints, arXiv:2603.04679, doi: 10.48550/arXiv.2603.04679
-
[40]
Schwarz, R., Hedelt, P., Rau, A., Staude, A., & Schwope, A. D. 2002, in Astronomical Society of the Pacific Conference Series, Vol. 261, The Physics of Cataclysmic Variables and Related Objects, ed. B. T. Gänsicke, K. Beuermann, & K. Reinsch, 167
2002
-
[41]
Schwope, A. D. 2025, A&A, 698, A106, doi: 10.1051/0004-6361/202554519
-
[42]
D., Worpel, H., Traulsen, I., & Sablowski, D
Schwope, A. D., Worpel, H., Traulsen, I., & Sablowski, D. 2020, A&A, 642, A134, doi: 10.1051/0004-6361/202037714
-
[43]
Shaw, A. W., Heinke, C. O., Mukai, K., et al. 2020, MNRAS, 498, 3457, doi: 10.1093/mnras/staa2592
-
[44]
Raymond, J. C. 2001, ApJL, 556, L91, doi: 10.1086/322992
-
[45]
F., Doroshenko, V., & Werner, K
Suleimanov, V. F., Doroshenko, V., & Werner, K. 2019, MNRAS, 482, 3622, doi: 10.1093/mnras/sty2952
-
[46]
2025, PASJ, 77, S1, doi: 10.1093/pasj/psaf023
Tashiro, M., Kelley, R., Watanabe, S., et al. 2025, PASJ, 77, S1, doi: 10.1093/pasj/psaf023
-
[47]
G., Staveley-Smith, L., de Blok, W
Terada, Y., Ishida, M., Makishima, K., et al. 2001, MNRAS, 328, 112, doi: 10.1046/j.1365-8711.2001.04878.x
-
[48]
1999, PASJ, 51, 39, doi: 10.1093/pasj/51.1.39
Terada, Y., Kaneda, H., Makishima, K., et al. 1999, PASJ, 51, 39, doi: 10.1093/pasj/51.1.39
-
[49]
Terada, Y., Shidatsu, M., Sawada, M., & et al. . 2025, Journal of Astronomical Telescopes, Instruments, and Systems, 11, 042007, doi: 10.1117/1.JATIS.11.4.042007
-
[50]
Terada, Y., Holland, M., Loewenstein, M., et al. 2021, Journal of Astronomical Telescopes, Instruments, and Systems, 7, 037001, doi: 10.1117/1.JATIS.7.3.037001 Van Box Som, L., Falize, E., Koenig, M., et al. 2018, High Power Laser Science and Engineering, 6, e35, doi: 10.1017/hpl.2018.32
-
[51]
Verner, D. A., Verner, E. M., & Ferland, G. J. 1996, Atomic Data and Nuclear Data Tables, 64, 1, doi: 10.1006/adnd.1996.0018
-
[52]
1995, ApJ, 455, 260, doi: 10.1086/176574 XRISM Collaboration, Audard, M., Awaki, H., et al
Wu, K., Chanmugam, G., & Shaviv, G. 1995, ApJ, 455, 260, doi: 10.1086/176574 XRISM Collaboration, Audard, M., Awaki, H., et al. 2024a, ApJL, 977, L34, doi: 10.3847/2041-8213/ad8ed0 XRISM Collaboration, Audard, M., Awaki, H., et al. 2024b, ApJL, 973, L25, doi: 10.3847/2041-8213/ad7397 XRISM Collaboration, Audard, M., Awaki, H., et al. 2024c, PASJ, 76, 1186...
-
[54]
Xu, X.-j., Wang, Q. D., & Li, X.-D. 2016b, ApJ, 818, 136, doi: 10.3847/0004-637X/818/2/136
-
[55]
2012, ApJ, 753, 129, doi: 10.1088/0004-637X/753/2/129
Yuasa, T., Makishima, K., & Nakazawa, K. 2012, ApJ, 753, 129, doi: 10.1088/0004-637X/753/2/129
-
[56]
2010, A&A, 520, A25, doi: 10.1051/0004-6361/201014542
Yuasa, T., Nakazawa, K., Makishima, K., et al. 2010, A&A, 520, A25, doi: 10.1051/0004-6361/201014542
discussion (0)
Sign in with ORCID, Apple, or X to comment. Anyone can read and Pith papers without signing in.