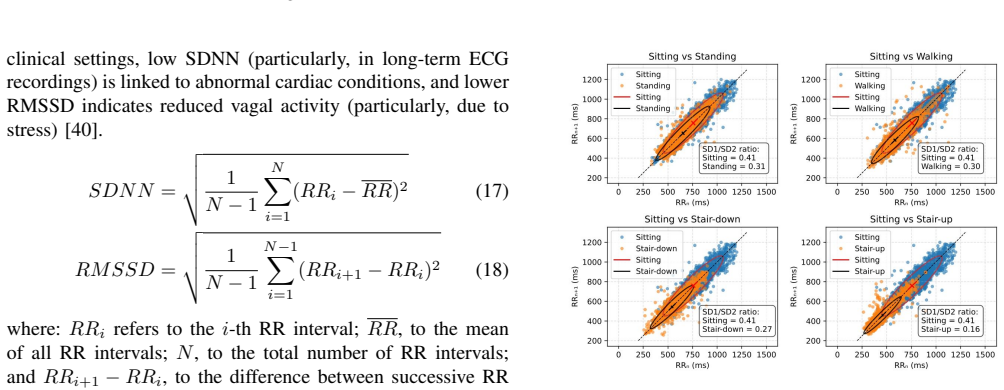
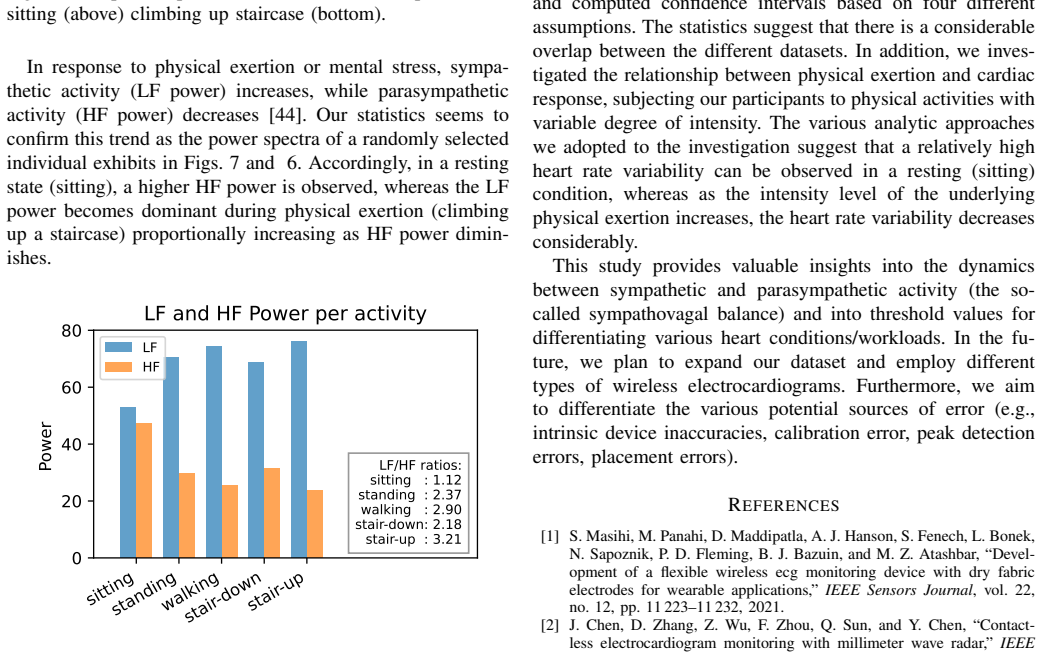
Recognition: 2 theorem links
· Lean TheoremStatistical Analysis of the Reliability of Data Collected with Wireless Electrocardiograms Outside Clinical Settings
Pith reviewed 2026-05-10 17:47 UTC · model grok-4.3
The pith
Wireless ECG data from unsupervised physical activities shows statistical agreement with clinical 12-lead and Holter records on RR intervals and heart rate variability.
A machine-rendered reading of the paper's core claim, the machinery that carries it, and where it could break.
Core claim
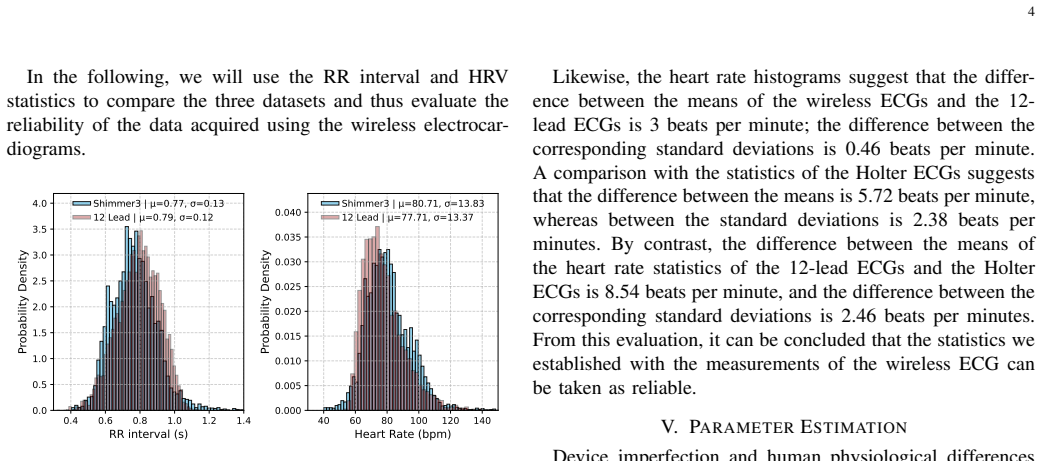
Data collected with wireless ECGs from 54 healthy subjects performing five physical activities outside clinical settings without medical supervision are compared with clinically collected data from standard 12-lead ECGs (2493 subjects) and Holter ECGs (29 subjects), with particular attention to the RR interval time series and heart rate variability. The study shows significant statistical agreement between the different datasets. The 95% confidence intervals for the mean RR interval and HRV were calculated assuming that the statistics of the 12-lead ECGs could serve as a reliable reference and assuming they cannot; the resulting p-values (RR interval: 0.23 and 0.26; HRV: 0.10 and 0.11) give
What carries the argument
Hypothesis testing of mean RR interval and heart rate variability via 95% confidence intervals and p-value calculations under two reference-data assumptions.
Load-bearing premise
That data collected with wireless ECGs during physical activities outside clinical settings without medical supervision can be directly and meaningfully compared to data from supervised clinical 12-lead ECGs and Holter monitors despite major differences in environment, supervision, and activity context.
What would settle it
A replication study that finds p-values below 0.05 or mean RR-interval or HRV values falling outside the reported 95% confidence intervals between wireless and clinical datasets would falsify the claim of statistical agreement.
Figures


read the original abstract
Cost-effective wireless electrocardiograms (ECGs) enable long-term and scalable monitoring of cardiac patients in their home and work environments. Because they offer greater freedom of movement, they are also suitable for investigating the relationship between cardiac workload and underlying physical exertion. However, this requires that the quality of the generated data meets the standards of clinical devices. The aim of this study is to examine this closely. We therefore analyze data from 54 healthy subjects who performed five physical activities using wireless ECGs outside of clinical settings and without medical supervision. The results are compared with clinically collected data from standard 12-lead ECGs (2493 subjects) and Holter ECGs (29 subjects), with particular attention to the RR interval time series (tachogram) and heart rate variability (HRV). Our study shows significant statistical agreement between the different datasets. We calculated the 95% confidence intervals for the mean RR interval and HRV assuming that (1) the statistics of the 12-lead ECGs could serve as reliable reference, and (2) the statistics of the 12-lead ECGs cannot be taken as reliable reference. The p-values for both conditions (for the RR interval: 0.23 and 0.26 respectively; for HRV: 0.10 and 0.11 respectively) suggest that there is insufficient evidence to reject the hypothesis that significant statistical agreement exists between the different datasets.
Editorial analysis
A structured set of objections, weighed in public.
Referee Report
Summary. The manuscript analyzes RR-interval and heart-rate-variability (HRV) statistics obtained from wireless ECGs worn by 54 healthy volunteers during five specified physical activities outside clinical settings. These data are compared with reference distributions from 2493 standard 12-lead ECG recordings and 29 Holter recordings; the authors compute 95 % confidence intervals under two assumptions about the reliability of the 12-lead data and report p-values (RR: 0.23/0.26; HRV: 0.10/0.11) that they interpret as evidence of “significant statistical agreement” between the wireless and clinical datasets.
Significance. If the statistical interpretation and contextual comparability issues were resolved, the study would provide useful empirical support for the reliability of low-cost wireless ECGs during everyday physical activity, thereby strengthening the case for scalable, unsupervised ambulatory monitoring. The work is a direct empirical comparison rather than a theoretical derivation, so its value hinges on the soundness of the data-matching and equivalence-testing procedures.
major comments (3)
- [Abstract] Abstract: The claim that the reported p-values (RR interval 0.23/0.26; HRV 0.10/0.11) indicate “significant statistical agreement” misinterprets classical hypothesis testing. Failure to reject the null of no difference does not constitute positive evidence of agreement or equivalence; equivalence testing with pre-specified margins or Bayesian methods would be required to support such a conclusion.
- [Abstract] Abstract: The wireless recordings (n=54) were acquired during five defined physical activities, while the 12-lead reference (n=2493) consists of standard supervised clinical recordings (typically short-duration, at rest) and the Holter set (n=29) is ambulatory but supervised. No activity-level matching, normalization for exertion, or adjustment for physiological state is described, so the direct mean comparison tests incompatible physiological regimes rather than device reliability.
- [Abstract] Abstract: The manuscript provides no information on data preprocessing steps, the precise statistical tests employed, handling of the extreme imbalance in sample sizes (54 vs 2493), or potential confounders such as age, sex, or activity intensity. These omissions prevent verification that the reported confidence intervals and p-values are correctly calculated and comparable across datasets.
minor comments (1)
- [Abstract] The abstract would be clearer if it explicitly named the statistical software, the exact test statistic, and whether any multiple-comparison correction was applied.
Simulated Author's Rebuttal
We thank the referee for their constructive comments, which have prompted important clarifications in our manuscript. We address each major point below and have revised the abstract, methods, and discussion sections to improve statistical interpretation, acknowledge limitations in data comparability, and provide missing methodological details.
read point-by-point responses
-
Referee: [Abstract] Abstract: The claim that the reported p-values (RR interval 0.23/0.26; HRV 0.10/0.11) indicate “significant statistical agreement” misinterprets classical hypothesis testing. Failure to reject the null of no difference does not constitute positive evidence of agreement or equivalence; equivalence testing with pre-specified margins or Bayesian methods would be required to support such a conclusion.
Authors: We agree that the original phrasing overstated the results. The p-values indicate failure to reject the null hypothesis of no difference under the two assumptions about the 12-lead reference, but do not constitute positive evidence of equivalence. We have revised the abstract and added a paragraph in the discussion to state that no statistically significant differences were detected, while explicitly noting the limitations of this approach and recommending equivalence testing or Bayesian methods for future work to assess agreement within clinically meaningful bounds. revision: yes
-
Referee: [Abstract] Abstract: The wireless recordings (n=54) were acquired during five defined physical activities, while the 12-lead reference (n=2493) consists of standard supervised clinical recordings (typically short-duration, at rest) and the Holter set (n=29) is ambulatory but supervised. No activity-level matching, normalization for exertion, or adjustment for physiological state is described, so the direct mean comparison tests incompatible physiological regimes rather than device reliability.
Authors: We acknowledge the mismatch in physiological conditions: wireless data were collected during unsupervised physical activities to simulate real-world use, whereas 12-lead recordings are typically resting clinical snapshots and Holter data are supervised ambulatory. We have added explicit discussion of this limitation, clarifying that the comparison evaluates whether wireless ECG statistics fall within clinical reference ranges despite differing exertion levels, rather than isolating pure device performance. The Holter set provides partial overlap with ambulatory conditions. Without new matched-activity data, full normalization is not feasible, but the interpretation has been substantially tempered to avoid overclaiming device reliability. revision: partial
-
Referee: [Abstract] Abstract: The manuscript provides no information on data preprocessing steps, the precise statistical tests employed, handling of the extreme imbalance in sample sizes (54 vs 2493), or potential confounders such as age, sex, or activity intensity. These omissions prevent verification that the reported confidence intervals and p-values are correctly calculated and comparable across datasets.
Authors: We apologize for the lack of detail in the original submission. The revised manuscript expands the Methods section to describe: preprocessing (band-pass filtering, R-peak detection via Pan-Tompkins algorithm with manual artifact review); statistical methods (calculation of means and 95% CIs under the two stated assumptions about the 12-lead reference, followed by two-sample t-tests yielding the reported p-values, with the large reference n incorporated via pooled variance); handling of sample imbalance (using the reference as a stable population benchmark rather than direct pooling); and confounders (all participants were healthy adults aged 20-45 with balanced sex distribution; activity intensity was standardized via the five defined tasks, though no cross-dataset normalization was applied). These additions enable full reproducibility and verification. revision: yes
Circularity Check
No circularity: direct empirical statistical comparison of independent datasets
full rationale
The paper conducts a straightforward empirical comparison of RR intervals and HRV statistics across three independently collected datasets (wireless ECGs from 54 subjects performing activities, 12-lead ECGs from 2493 subjects, and Holter from 29 subjects) using standard 95% confidence interval calculations and p-value tests under two explicit assumptions about the reference. No derivation, model fitting, parameter estimation from target data, or self-referential equations are present; the central claim rests on direct application of hypothesis testing to raw measurements without reducing any result to its own inputs by construction. The analysis is self-contained against external benchmarks and does not invoke self-citations or ansatzes for its load-bearing steps.
Axiom & Free-Parameter Ledger
axioms (2)
- domain assumption The statistics of the 12-lead ECGs can serve as a reliable reference for comparison.
- standard math Standard assumptions for 95% confidence intervals and p-value calculations (such as appropriate distributional properties) hold for the RR interval and HRV data across datasets.
Lean theorems connected to this paper
-
IndisputableMonolith/Cost/FunctionalEquation.leanwashburn_uniqueness_aczel unclearThe p-values for both conditions (for the RR interval: 0.23 and 0.26 respectively; for HRV: 0.10 and 0.11 respectively) suggest that there is insufficient evidence to reject the hypothesis that significant statistical agreement exists
-
IndisputableMonolith/Foundation/ArrowOfTime.leanforward_accumulates unclearWe therefore analyze data from 54 healthy subjects who performed five physical activities using wireless ECGs outside of clinical settings
Reference graph
Works this paper leans on
-
[1]
Devel- opment of a flexible wireless ecg monitoring device with dry fabric electrodes for wearable applications,
S. Masihi, M. Panahi, D. Maddipatla, A. J. Hanson, S. Fenech, L. Bonek, N. Sapoznik, P. D. Fleming, B. J. Bazuin, and M. Z. Atashbar, “Devel- opment of a flexible wireless ecg monitoring device with dry fabric electrodes for wearable applications,”IEEE Sensors Journal, vol. 22, no. 12, pp. 11 223–11 232, 2021
2021
-
[2]
Contact- less electrocardiogram monitoring with millimeter wave radar,
J. Chen, D. Zhang, Z. Wu, F. Zhou, Q. Sun, and Y . Chen, “Contact- less electrocardiogram monitoring with millimeter wave radar,”IEEE Transactions on Mobile Computing, vol. 23, no. 1, pp. 270–285, 2022
2022
-
[3]
A wearable wireless sensor system using machine learning classification to detect arrhythmia,
A. Farooq, M. Seyedmahmoudian, and A. Stojcevski, “A wearable wireless sensor system using machine learning classification to detect arrhythmia,”IEEE Sensors Journal, vol. 21, no. 9, pp. 11 109–11 116, 2021
2021
-
[4]
Human activity recognition based on wireless electrocardiogram and inertial sensors,
S. Farrokhi, W. Dargie, and C. Poellabauer, “Human activity recognition based on wireless electrocardiogram and inertial sensors,”IEEE Sensors Journal, vol. 24, no. 5, pp. 6490–6499, 2024. 10
2024
-
[5]
Deep learning for ecg analysis: Benchmarks and insights from ptb-xl,
N. Strodthoff, P. Wagner, T. Schaeffter, and W. Samek, “Deep learning for ecg analysis: Benchmarks and insights from ptb-xl,”IEEE journal of biomedical and health informatics, vol. 25, no. 5, pp. 1519–1528, 2020
2020
-
[6]
Platform for healthcare promotion and cardiovascular disease preven- tion,
C. A. Gómez-García, M. Askar-Rodriguez, and J. Velasco-Medina, “Platform for healthcare promotion and cardiovascular disease preven- tion,”IEEE Journal of Biomedical and Health Informatics, vol. 25, no. 7, pp. 2758–2767, 2021
2021
-
[7]
Big-ecg: Cardiographic predictive cyber- physical system for stroke management,
I. Hussain and S. J. Park, “Big-ecg: Cardiographic predictive cyber- physical system for stroke management,”IEEe Access, vol. 9, pp. 123 146–123 164, 2021
2021
-
[8]
Ecg interpretation skill ac- quisition: A review of learning, teaching and assessment,
C. Breen, G. Kelly, and W. Kernohan, “Ecg interpretation skill ac- quisition: A review of learning, teaching and assessment,”Journal of electrocardiology, vol. 73, pp. 125–128, 2022
2022
-
[9]
Houghton,Making sense of the ECG: a hands-on guide
A. Houghton,Making sense of the ECG: a hands-on guide. CRC press, 2025
2025
-
[10]
Smart wearable devices in cardiovascular care: where we are and how to move forward,
K. Bayoumy, M. Gaber, A. Elshafeey, O. Mhaimeed, E. H. Dineen, F. A. Marvel, S. S. Martin, E. D. Muse, M. P. Turakhia, K. G. Tarakji et al., “Smart wearable devices in cardiovascular care: where we are and how to move forward,”Nature Reviews Cardiology, vol. 18, no. 8, pp. 581–599, 2021
2021
-
[11]
Heart rate variability- based driver drowsiness detection and its validation with eeg,
K. Fujiwara, E. Abe, K. Kamata, C. Nakayama, Y . Suzuki, T. Yamakawa, T. Hiraoka, M. Kano, Y . Sumi, F. Masudaet al., “Heart rate variability- based driver drowsiness detection and its validation with eeg,”IEEE transactions on biomedical engineering, vol. 66, no. 6, pp. 1769–1778, 2018
2018
-
[12]
Continuous heart rate recovery monitoring with ecg signals from wearables: Identi- fying risk groups in the general population,
A. Dogan, A. Bishnoi, R. B. Sowers, and M. E. Hernandez, “Continuous heart rate recovery monitoring with ecg signals from wearables: Identi- fying risk groups in the general population,”IEEE Journal of Biomedical and Health Informatics, 2025
2025
-
[13]
Sympathetic control of short-term heart rate variability and its pharmacological modulation,
J.-L. Elghozi and C. Julien, “Sympathetic control of short-term heart rate variability and its pharmacological modulation,”Fundamental & clinical pharmacology, vol. 21, no. 4, pp. 337–347, 2007
2007
-
[14]
Psychosocial stress-induced activation of salivary alpha-amylase: an indicator of sympathetic activity?
N. Rohleder, U. M. Nater, J. M. Wolf, U. Ehlert, and C. Kirschbaum, “Psychosocial stress-induced activation of salivary alpha-amylase: an indicator of sympathetic activity?”Annals of the New York Academy of Sciences, vol. 1032, no. 1, pp. 258–263, 2004
2004
-
[15]
Physical activity and stress resistance: sympathetic nervous system adaptations prevent stress-induced immunosuppression,
F. Fleshner, “Physical activity and stress resistance: sympathetic nervous system adaptations prevent stress-induced immunosuppression,”Exer- cise and sport sciences reviews, vol. 33, no. 3, pp. 120–126, 2005
2005
-
[16]
Interoception, homeostatic emotions and sympathovagal balance,
I. A. Strigo and A. D. Craig, “Interoception, homeostatic emotions and sympathovagal balance,”Philosophical Transactions of the Royal Society B: Biological Sciences, vol. 371, no. 1708, p. 20160010, 2016
2016
-
[17]
Di Raimondo, G
D. Di Raimondo, G. Miceli, A. Casuccio, A. Tuttolomondo, C. Butta, V . Zappulla, C. Schimmenti, G. Musiari, and A. Pinto, “Does sympa- thetic overactivation feature all hypertensives? differences of sympatho- vagal balance according to night/day blood pressure ratio in patients with essential hypertension,”Hypertension Research, vol. 39, no. 6, pp. 440–448, 2016
2016
-
[18]
Reliability and validity of commercially available wearable devices for measuring steps, energy expenditure, and heart rate: systematic review,
D. Fuller, E. Colwell, J. Low, K. Orychock, M. A. Tobin, B. Simango, R. Buote, D. Van Heerden, H. Luan, K. Cullenet al., “Reliability and validity of commercially available wearable devices for measuring steps, energy expenditure, and heart rate: systematic review,”JMIR mHealth and uHealth, vol. 8, no. 9, p. e18694, 2020
2020
-
[19]
A novel wearable device integrating ecg and pcg for cardiac health monitoring,
J. Zang, Q. An, B. Li, Z. Zhang, L. Gao, and C. Xue, “A novel wearable device integrating ecg and pcg for cardiac health monitoring,” Microsystems & Nanoengineering, vol. 11, no. 1, p. 7, 2025
2025
-
[20]
Evaluation of a wearable device to determine cardiorespiratory parameters from surface diaphragm electromyogra- phy,
M. Rafols-de Urquia, L. Estrada, J. Estevez-Piorno, L. Sarlabous, R. Jane, and A. Torres, “Evaluation of a wearable device to determine cardiorespiratory parameters from surface diaphragm electromyogra- phy,”IEEE journal of biomedical and health informatics, vol. 23, no. 5, pp. 1964–1971, 2018
1964
-
[21]
Wearable armband device for daily life electrocardiogram monitoring,
J. Lázaro, N. Reljin, M.-B. Hossain, Y . Noh, P. Laguna, and K. H. Chon, “Wearable armband device for daily life electrocardiogram monitoring,” IEEE Transactions on Biomedical Engineering, vol. 67, no. 12, pp. 3464–3473, 2020
2020
-
[22]
Investigating sources of inaccuracy in wearable optical heart rate sensors,
B. Bent, B. A. Goldstein, W. A. Kibbe, and J. P. Dunn, “Investigating sources of inaccuracy in wearable optical heart rate sensors,”NPJ digital medicine, vol. 3, no. 1, p. 18, 2020
2020
-
[23]
Heart rate variability with photoplethysmography in 8 million individ- uals: a cross-sectional study,
A. Natarajan, A. Pantelopoulos, H. Emir-Farinas, and P. Natarajan, “Heart rate variability with photoplethysmography in 8 million individ- uals: a cross-sectional study,”The Lancet Digital Health, vol. 2, no. 12, pp. e650–e657, 2020
2020
-
[24]
Evaluation of an integrated system of wearable physiological sensors for stress monitoring in working environ- ments by using biological markers,
S. Betti, R. M. Lova, E. Rovini, G. Acerbi, L. Santarelli, M. Cabiati, S. Del Ry, and F. Cavallo, “Evaluation of an integrated system of wearable physiological sensors for stress monitoring in working environ- ments by using biological markers,”IEEE transactions on biomedical engineering, vol. 65, no. 8, pp. 1748–1758, 2017
2017
-
[25]
Viability of cardiac parameters measured unobtrusively using capacitive coupled electrocardiography (cecg) to estimate driver performance,
R. Bhardwaj and V . Balasubramanian, “Viability of cardiac parameters measured unobtrusively using capacitive coupled electrocardiography (cecg) to estimate driver performance,”IEEE Sensors Journal, vol. 19, no. 11, pp. 4321–4330, 2019
2019
-
[26]
Motion-unrestricted dynamic electrocardiogram system utilizing imperceptible electronics,
D. Li, T.-R. Cui, J.-H. Liu, W.-C. Shao, X. Liu, Z.-K. Chen, Z.-G. Xu, X. Li, S.-Y . Xu, Z.-Y . Xieet al., “Motion-unrestricted dynamic electrocardiogram system utilizing imperceptible electronics,”Nature Communications, vol. 16, no. 1, p. 3259, 2025
2025
-
[27]
Shimmer™–a wireless sensor platform for noninvasive biomedical research,
A. Burns, B. R. Greene, M. J. McGrath, T. J. O’Shea, B. Kuris, S. M. Ayer, F. Stroiescu, and V . Cionca, “Shimmer™–a wireless sensor platform for noninvasive biomedical research,”IEEE Sensors Journal, vol. 10, no. 9, pp. 1527–1534, 2010
2010
-
[28]
Ptb-xl, a large publicly available electro- cardiography dataset,
P. Wagner, N. Strodthoff, R.-D. Bousseljot, D. Kreiseler, F. I. Lunze, W. Samek, and T. Schaeffter, “Ptb-xl, a large publicly available electro- cardiography dataset,”Scientific data, vol. 7, no. 1, pp. 1–15, 2020
2020
-
[29]
Neurokit2: A python toolbox for neurophysiological signal processing,
D. Makowski, T. Pham, Z. J. Lau, J. C. Brammer, F. Lespinasse, H. Pham, C. Schölzel, and S. A. Chen, “Neurokit2: A python toolbox for neurophysiological signal processing,”Behavior research methods, vol. 53, no. 4, pp. 1689–1696, 2021
2021
-
[30]
A wavelet-based ecg delineator: evaluation on standard databases,
J. P. Martínez, R. Almeida, S. Olmos, A. P. Rocha, and P. Laguna, “A wavelet-based ecg delineator: evaluation on standard databases,”IEEE Transactions on biomedical engineering, vol. 51, no. 4, pp. 570–581, 2004
2004
-
[31]
Automated multilabel diagnosis on electrocardiographic images and signals,
V . Sangha, B. J. Mortazavi, A. D. Haimovich, A. H. Ribeiro, C. A. Brandt, D. L. Jacoby, W. L. Schulz, H. M. Krumholz, A. L. P. Ribeiro, and R. Khera, “Automated multilabel diagnosis on electrocardiographic images and signals,”Nature communications, vol. 13, no. 1, p. 1583, 2022
2022
-
[32]
An improved cardiac arrhythmia classification using an rr interval-based approach,
J. Rahul, M. Sora, L. D. Sharma, and V . K. Bohat, “An improved cardiac arrhythmia classification using an rr interval-based approach,” Biocybernetics and Biomedical Engineering, vol. 41, no. 2, pp. 656– 666, 2021
2021
-
[33]
A dynamical model for generating synthetic electrocardiogram signals,
P. E. McSharry, G. D. Clifford, L. Tarassenko, and L. A. Smith, “A dynamical model for generating synthetic electrocardiogram signals,” IEEE transactions on biomedical engineering, vol. 50, no. 3, pp. 289– 294, 2003
2003
-
[34]
Mean-shift outlier detection and filtering,
J. Yang, S. Rahardja, and P. Fränti, “Mean-shift outlier detection and filtering,”Pattern Recognition, vol. 115, p. 107874, 2021
2021
-
[35]
A review on outlier/anomaly detection in time series data,
A. Blázquez-García, A. Conde, U. Mori, and J. A. Lozano, “A review on outlier/anomaly detection in time series data,”ACM computing surveys (CSUR), vol. 54, no. 3, pp. 1–33, 2021
2021
-
[36]
Continuous heart rate recovery monitoring with ecg signals from wearables: Identi- fying risk groups in the general population,
A. Dogan, A. Bishnoi, R. B. Sowers, and M. E. Hernandez, “Continuous heart rate recovery monitoring with ecg signals from wearables: Identi- fying risk groups in the general population,”IEEE Journal of Biomedical and Health Informatics, vol. 29, no. 8, pp. 5493–5502, 2025
2025
-
[37]
A machine learning approach to improve contactless heart rate monitoring using a webcam,
H. Monkaresi, R. A. Calvo, and H. Yan, “A machine learning approach to improve contactless heart rate monitoring using a webcam,”IEEE journal of biomedical and health informatics, vol. 18, no. 4, pp. 1153– 1160, 2013
2013
-
[38]
Papoulis and S
A. Papoulis and S. U. Pillai,Probability. McGraw-hill, 2002
2002
-
[39]
Confidence intervals,
B. Ci and R.-O. Rule, “Confidence intervals,”Lancet, vol. 1, no. 8531, pp. 494–7, 1987
1987
-
[40]
An overview of heart rate variability metrics and norms,
F. Shaffer and J. P. Ginsberg, “An overview of heart rate variability metrics and norms,”Frontiers in public health, vol. 5, p. 258, 2017
2017
-
[41]
Recognizing emotions induced by affective sounds through heart rate variability,
M. Nardelli, G. Valenza, A. Greco, A. Lanata, and E. P. Scilingo, “Recognizing emotions induced by affective sounds through heart rate variability,”IEEE Transactions on Affective Computing, vol. 6, no. 4, pp. 385–394, 2015
2015
-
[42]
Lomb- scargle periodogram applied to heart rate variability study,
D. S. Fonseca, A. Netto, R. B. Ferreira, and A. M. De Sa, “Lomb- scargle periodogram applied to heart rate variability study,” in2013 ISSNIP Biosignals and Biorobotics Conference: Biosignals and Robotics for Better and Safer Living (BRC). IEEE, 2013, pp. 1–4
2013
-
[43]
Welch method revisited: nonparametric power spectrum estimation via circular overlap,
K. Barbe, R. Pintelon, and J. Schoukens, “Welch method revisited: nonparametric power spectrum estimation via circular overlap,”IEEE Transactions on signal processing, vol. 58, no. 2, pp. 553–565, 2009
2009
-
[44]
Inclusion of respiratory frequency information in heart rate variability analysis for stress assessment,
A. Hernando, J. Lazaro, E. Gil, A. Arza, J. M. Garzón, R. Lopez-Anton, C. De La Camara, P. Laguna, J. Aguiló, and R. Bailón, “Inclusion of respiratory frequency information in heart rate variability analysis for stress assessment,”IEEE journal of biomedical and health informatics, vol. 20, no. 4, pp. 1016–1025, 2016
2016
discussion (0)
Sign in with ORCID, Apple, or X to comment. Anyone can read and Pith papers without signing in.