Recognition: unknown
Measurement of Generative AI Workload Power Profiles for Whole-Facility Data Center Infrastructure Planning
Pith reviewed 2026-05-10 17:18 UTC · model grok-4.3
The pith
High-resolution power measurements of generative AI workloads scale to realistic whole-facility energy profiles via a bottom-up model.
A machine-rendered reading of the paper's core claim, the machinery that carries it, and where it could break.
Core claim
The authors introduce a methodology that records power use of generative AI workloads at 0.1-second intervals, then applies a bottom-up, event-driven data center energy model to produce whole-facility demand profiles. These profiles incorporate the temporal variations that arise from different workload types and user behavior, supplying data suitable for planning grid connections, on-site generation, and microgrids.
What carries the argument
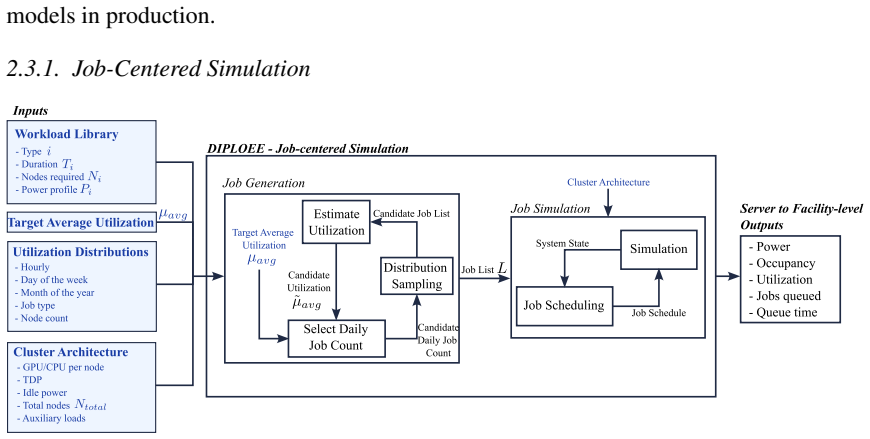
The bottom-up, event-driven data center energy model that aggregates individual workload power measurements into facility-wide demand while preserving realistic time fluctuations.
If this is right
- Facility planners gain time-resolved demand traces that better match actual AI-driven loads for grid-connection sizing.
- On-site generation and microgrid designs can be matched to fluctuating patterns instead of steady-state assumptions.
- The public release of the high-resolution profiles supports repeated or comparative studies of energy impact.
- Infrastructure decisions can differentiate effects from training versus inference workloads.
Where Pith is reading between the lines
- The same measurement-and-scaling approach could be applied to other hardware generations to test whether the fluctuation patterns remain similar.
- Combining these profiles with time-varying renewable supply data could show how AI facilities might shift workloads to improve grid stability.
- Extending the model to include future changes in model size or utilization rates would allow forward-looking capacity estimates.
Load-bearing premise
The scaling model converts individual workload power readings into accurate facility-level energy use without large unaccounted losses, cooling overheads, or component interactions.
What would settle it
A side-by-side comparison of the model's predicted facility power trace against direct measurements of total data-center power during a known period of AI workloads would confirm or disprove the scaling accuracy.
Figures


read the original abstract
The rapid growth of generative artificial intelligence (AI) has introduced unprecedented computational demands, driving significant increases in the energy footprint of data centers. However, existing power consumption data is largely proprietary and reported at varying resolutions, creating challenges for estimating whole-facility energy use and planning infrastructure. In this work, we present a methodology that bridges this gap by linking high-resolution workload power measurements to whole-facility energy demand. Using NLR's high-performance computing data center equipped with NVIDIA H100 GPUs, we measure power consumption of AI workloads at 0.1-second resolution for AI training, fine-tuning and inference jobs. Workloads are characterized using MLCommons benchmarks for model training and fine-tuning, and vLLM benchmarks for inference, enabling reproducible and standardized workload profiling. The dataset of power consumption profiles is made publicly available. These power profiles are then scaled to the whole-facility-level using a bottom-up, event-driven, data center energy model. The resulting whole-facility energy profiles capture realistic temporal fluctuations driven by AI workloads and user-behavior, and can be used to inform infrastructure planning for grid connection, on-site energy generation, and distributed microgrids.
Editorial analysis
A structured set of objections, weighed in public.
Referee Report
Summary. The paper presents high-resolution (0.1 s) power measurements of generative AI workloads (training, fine-tuning, inference) on NVIDIA H100 GPUs in NLR's data center, using MLCommons and vLLM benchmarks for reproducibility. It releases the resulting power-profile dataset publicly and scales the traces to whole-facility energy demand via a bottom-up, event-driven data-center model that incorporates workload events and user behavior, producing time-varying facility-level profiles intended for grid-connection, on-site generation, and microgrid planning.
Significance. If the scaling step is shown to be accurate, the public dataset and methodology would supply a rare non-proprietary, high-resolution resource for AI-driven data-center planning, where most existing data are aggregated or proprietary. The choice of standardized benchmarks and the explicit release of raw traces are clear strengths that could enable community reuse and further modeling.
major comments (2)
- [Scaling methodology] The scaling procedure (described after the measurement section) asserts that the bottom-up event-driven model produces 'realistic temporal fluctuations' at facility scale, yet no comparison of modeled totals against metered whole-facility power data, no calibration constants, and no sensitivity analysis on cooling or distribution losses are reported. This directly undermines the central claim that the profiles are suitable for infrastructure planning.
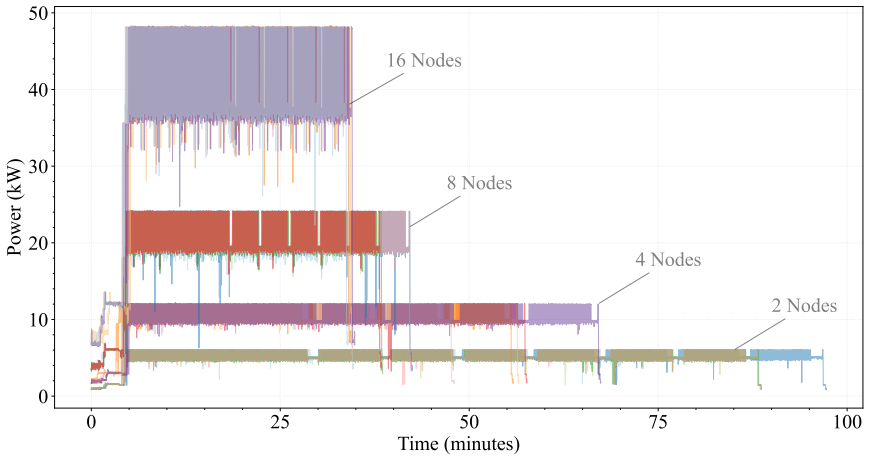
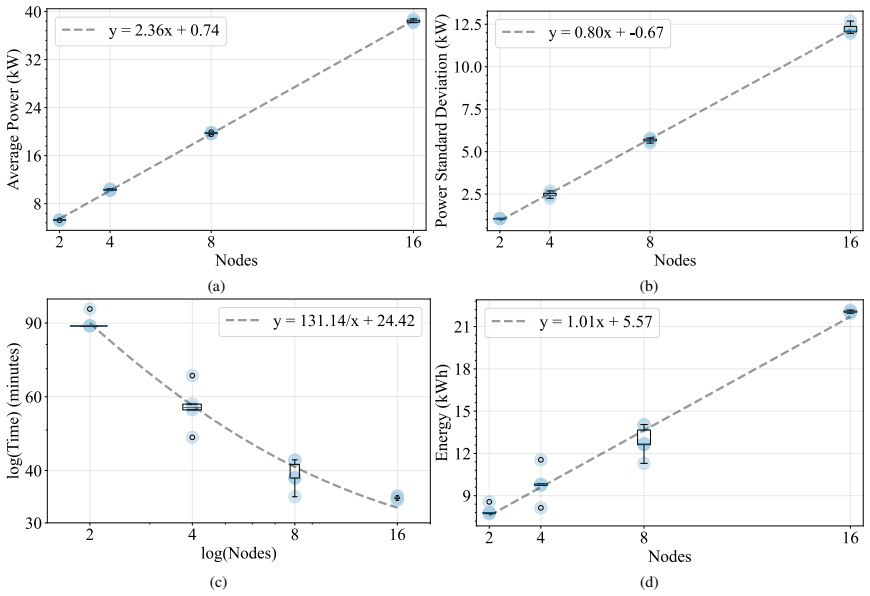
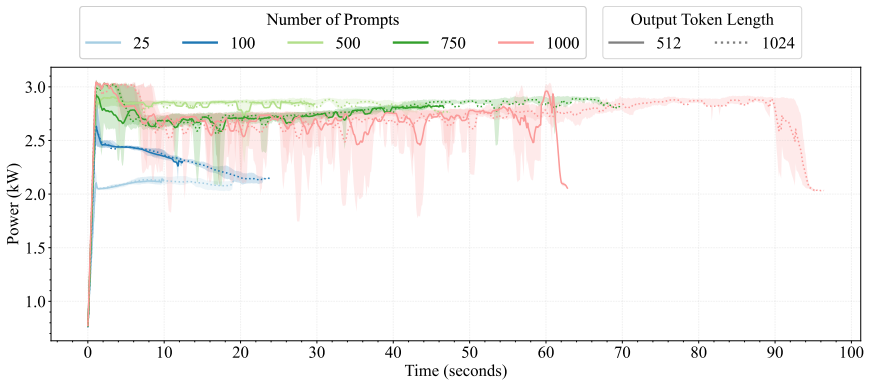
- [Results and discussion] No quantitative results—peak-to-average ratios, total energy per job class, or error statistics—are supplied for either the per-GPU traces or the scaled facility profiles, leaving the practical magnitude of the reported fluctuations unassessed.
minor comments (2)
- [Abstract] The abstract states the dataset is made publicly available but supplies neither a DOI, repository URL, nor license; this information should be added in the data-availability statement.
- [Model description] Clarify the precise definition of 'event-driven' in the model (e.g., how concurrent jobs, idle periods, and cooling-system response times are scheduled) so that readers can reproduce the aggregation step.
Simulated Author's Rebuttal
We thank the referee for the constructive feedback and for recognizing the value of the high-resolution measurements and public dataset. We address each major comment below.
read point-by-point responses
-
Referee: [Scaling methodology] The scaling procedure (described after the measurement section) asserts that the bottom-up event-driven model produces 'realistic temporal fluctuations' at facility scale, yet no comparison of modeled totals against metered whole-facility power data, no calibration constants, and no sensitivity analysis on cooling or distribution losses are reported. This directly undermines the central claim that the profiles are suitable for infrastructure planning.
Authors: We agree that the absence of direct validation against metered facility-level data limits the strength of claims for immediate use in infrastructure planning. The model is presented as a generalizable bottom-up framework rather than a calibrated site-specific simulator. In revision we have added a limitations subsection that explicitly states the lack of calibration constants, discusses model assumptions on losses, and includes a basic sensitivity analysis (varying cooling and distribution loss factors by ±20% and reporting resulting changes in peak and average facility demand). We have also clarified in the text that the generated profiles illustrate workload-driven temporal structure and are intended to be combined with site-specific data by end users. revision: partial
-
Referee: [Results and discussion] No quantitative results—peak-to-average ratios, total energy per job class, or error statistics—are supplied for either the per-GPU traces or the scaled facility profiles, leaving the practical magnitude of the reported fluctuations unassessed.
Authors: We accept that the original manuscript relied too heavily on visual inspection of traces. The revised version adds a quantitative results subsection that reports: (i) peak-to-average power ratios for each workload class on single H100 GPUs, (ii) total energy per job (kWh) for representative training, fine-tuning, and inference runs, and (iii) run-to-run variability (standard deviation and coefficient of variation) computed from the repeated benchmark executions. These statistics are also computed for the scaled facility-level traces and presented in a new summary table. revision: yes
- Direct comparison of modeled facility totals against metered whole-facility power data at matching resolution, because such proprietary meter data were not collected or released as part of this study.
Circularity Check
No circularity: direct measurements scaled by bottom-up model
full rationale
The paper's derivation chain consists of (1) direct 0.1 s power measurements on H100 GPUs using MLCommons and vLLM benchmarks and (2) scaling those traces via an event-driven bottom-up facility model. No step reduces a claimed prediction or result to the input data by construction, no fitted parameters are renamed as predictions, and no load-bearing claims rest on self-citations. The methodology is self-contained and externally falsifiable against metered facility data.
Axiom & Free-Parameter Ledger
Reference graph
Works this paper leans on
-
[1]
2024 United States Data Center Energy Usage Report,
A. Shehabi, S. J. Smith, A. Hubbard, A. Newkirk, N. Lei, M. A. Siddik, B. Holecek, J. G. Koomey, E. R. Masanet, and D. A. Sartor, “2024 United States Data Center Energy Usage Report,” tech. rep., Lawrence Berkeley National Laboratory (LBNL),
2024
-
[2]
doi: 10.71468/P1WC7Q
-
[3]
Energy and AI,
International Energy Agency, “Energy and AI,” tech. rep., International Energy Agency (IEA), Paris, France, 2025. url: https://www.iea.org/reports/energy-and- ai/executive-summary
2025
-
[4]
DOE Releases New Report Eval- uating Increase in Electricity Demand from Data Centers,
U.S. Department of Energy (DOE), “DOE Releases New Report Eval- uating Increase in Electricity Demand from Data Centers,” 2024. url: https://www.energy.gov/articles/doe-releases-new-report-evaluating-increase- electricity-demand-data-centers, (Accessed: 2026-04-06)
2024
-
[5]
Electricity demand and grid impacts of AI data centers: Challenges and prospects,
X. Chen, X. Wang, A. Colacelli, M. Lee, and L. Xie, “Electricity demand and grid impacts of AI data centers: Challenges and prospects,”arXiv, 2025. doi: 10.48550/arXiv.2509.07218
-
[6]
Preprint at https://arxiv.org/abs/ 2508.14318 (2025)
E. Choukse, B. Warrier, S. Heath, L. Belmont, A. Zhao, H. A. Khan, B. Harry, M. Kappel, R. J. Hewett, K. Datta, Y . Pei, C. Lichtenberger, J. Siegler, D. Lukofsky, Z. Kahn, G. Sahota, A. Sullivan, C. Frederick, H. Thai, R. Naughton, D. Jurnove, J. Harp, R. Carper, N. Mahalingam, S. Varkala, A. G. Kumbhare, S. Desai, V . Rama- murthy, P. Gottumukkala, G. B...
-
[7]
Incident re- view, considering simultaneous voltage-sensitive load reductions,
North American Electric Reliability Corporation (NERC), “Incident re- view, considering simultaneous voltage-sensitive load reductions,” tech. rep., North American Electric Reliability Corporation (NERC), 2025. url: https://www.nerc.com/newsroom/nerc-publishes-incident-review-and-guidance- on-voltage-sensitive-large-load-integration
2025
-
[8]
Machine learning-based cloud resource allocation al- gorithms: a comprehensive comparative review,
D. Bodra and S. Khairnar, “Machine learning-based cloud resource allocation al- gorithms: a comprehensive comparative review,”Frontiers in Computer Science, vol. V olume 7 - 2025, 2025. doi: 10.3389/fcomp.2025.1678976
-
[9]
Data center power supply systems: From grid edge to point-of-load,
Y . Chen, K. Shi, M. Chen, and D. Xu, “Data center power supply systems: From grid edge to point-of-load,”IEEE Journal of Emerging and Selected Topics in Power Elec- tronics, vol. 11, no. 3, pp. 2441–2456, 2023. doi: 10.1109/JESTPE.2022.3229063
-
[10]
Sources of data center energy estimates: A comprehensive review,
D. Mytton and M. Ashtine, “Sources of data center energy estimates: A comprehensive review,”Joule, vol. 6, no. 9, pp. 2032–2056, 2022. doi: https://doi.org/10.1016/j.joule.2022.07.011
-
[11]
Dynamic model and converter-based emulator of a data center power distribution system,
J. Sun, S. Wang, J. Wang, and L. M. Tolbert, “Dynamic model and converter-based emulator of a data center power distribution system,”IEEE Transactions on Power Electronics, vol. 37, no. 7, pp. 8420–8432, 2022. doi: 10.1109/TPEL.2022.3146354
-
[12]
Electromagnetic transient modeling of large data cen- ters for grid-level studies,
B. A. Ross and J. D. Follum, “Electromagnetic transient modeling of large data cen- ters for grid-level studies,” Tech. Rep. PNNL–38817, Pacific Northwest National Laboratory (PNNL), Richland, W A (United States), 2026. doi: 10.2172/3013288
-
[13]
Short-term load forecasting for ai-data center,
M. Mughees, Y . Li, Y . Chen, and Y . R. Li, “Short-term load forecasting for AI-data center,”arXiv, no. arXiv:2503.07756, 2025. doi: 10.48550/arXiv.2503.07756
-
[14]
Empirical measurements of AI training power demand on a GPU - accelerated node,
I. Latif, A. C. Newkirk, M. R. Carbone, A. Munir, Y . Lin, J. Koomey, X. Yu, and Z. Dong, “Empirical measurements of ai training power demand on a gpu-accelerated node,”arXiv, 2024. doi: 10.48550/arXiv.2412.08602
-
[15]
P. Patel, E. Choukse, C. Zhang, I. n. Goiri, B. Warrier, N. Mahalingam, and R. Bian- chini, “Characterizing power management opportunities for llms in the cloud,” in Proceedings of the 29th ACM International Conference on Architectural Support for Programming Languages and Operating Systems, Volume 3, ASPLOS ’24, (New York, NY , USA), p. 207–222, Associat...
-
[16]
Splitwise: Efficient generative llm inference using phase splitting
P. Patel, E. Choukse, C. Zhang, A. Shah, I. Goiri, S. Maleki, and R. Bianchini, “Split- wise: Efficient generative llm inference using phase splitting,” in2024 ACM/IEEE 51st Annual International Symposium on Computer Architecture (ISCA), pp. 118– 132, 2024. doi: 10.1109/ISCA59077.2024.00019
-
[17]
Azure public dataset: Azure llm inference trace 2023,
Microsoft, “Azure public dataset: Azure llm inference trace 2023,” 2023. url: https://github.com/Azure/AzurePublicDataset/blob/master/AzureLLMInferenceDataset2023.md, (Accessed: 2026-04-06)
2023
-
[18]
Characterization of large lan- guage model development in the datacenter,
Q. Hu, Z. Ye, Z. Wang, G. Wang, M. Zhang, Q. Chen, P. Sun, D. Lin, X. Wang, Y . Luo, Y . Wen, and T. Zhang, “Characterization of large lan- guage model development in the datacenter,” inProceedings of the 21st USENIX Symposium on Networked Systems Design and Implementation (NSDI ’24), (Santa Clara, CA), pp. 709–729, USENIX Association, Apr. 2024. url: htt...
2024
-
[19]
Acmetrace: Gpu workload traces from shanghai ai lab,
InternLM, “Acmetrace: Gpu workload traces from shanghai ai lab,” 2023. url: https://github.com/InternLM/AcmeTrace, (Accessed: 2026-04-06)
2023
-
[20]
MLaaS in the wild: Workload analysis and scheduling in Large-Scale het- erogeneous GPU clusters,
Q. Weng, W. Xiao, Y . Yu, W. Wang, C. Wang, J. He, Y . Li, L. Zhang, W. Lin, and Y . Ding, “MLaaS in the wild: Workload analysis and scheduling in Large-Scale het- erogeneous GPU clusters,” in19th USENIX Symposium on Networked Systems De- sign and Implementation (NSDI 22), (Renton, W A), pp. 945–960, USENIX Associ- ation, Apr. 2022. url: https://www.useni...
2022
-
[21]
Alibaba cluster trace gpu 2020,
Alibaba, “Alibaba cluster trace gpu 2020,” 2020. url: https://github.com/alibaba/clusterdata/tree/master/cluster-trace-gpu-v2020, (Accessed: 2026-04-06)
2020
-
[22]
BurstGPT: A real-world workload dataset to optimize LLM serving systems,
Y . Wang, Y . Chen, Z. Li, X. Kang, Y . Fang, Y . Zhou, Y . Zheng, Z. Tang, X. He, R. Guo, X. Wang, Q. Wang, A. C. Zhou, and X. Chu, “Burstgpt: A real-world workload dataset to optimize llm serving systems,” inProceedings of the 31st ACM SIGKDD Conference on Knowledge Discovery and Data Mining (KDD ’25), (Toronto, ON, Canada), ACM, 2025. doi: 10.1145/3711...
-
[23]
BurstGPT: A chatgpt (gpt-3.5) & gpt-4 workload trace to optimize llm serving systems,
HPMLL, “BurstGPT: A chatgpt (gpt-3.5) & gpt-4 workload trace to optimize llm serving systems,” 2024. url: https://github.com/HPMLL/BurstGPT, (Accessed: 2026-04-06)
2024
-
[24]
Awesome-CloudComputing-Datasets: A curated list of cloud computing datasets,
ACAT-SCUT, “Awesome-CloudComputing-Datasets: A curated list of cloud computing datasets,” 2024. url: https://github.com/ACAT-SCUT/Awesome- CloudComputing-Datasets, (Accessed: 2026-04-06). 39
2024
-
[25]
Dataset of generative ai workload power profiles,
R. Vercellino, J. Willard, G. Campos, W. da Silva Pereira, O. Hull, M. Selen- sky, and J. Mueller, “Dataset of generative ai workload power profiles,” 01 2026. doi: 10.7799/3025227
-
[26]
At- lanta, GA: American Society of Heating, Refrigerating and Air-Conditioning Engineers (ASHRAE), 5th ed., 2021
ASHRAE TC 9.9,Thermal Guidelines for Data Processing Environments. At- lanta, GA: American Society of Heating, Refrigerating and Air-Conditioning Engineers (ASHRAE), 5th ed., 2021. url: https://www.ashrae.org/technical- resources/bookstore/datacom-series
2021
-
[27]
WattAMeter,
W. da Silva Pereira, “WattAMeter,” 2025. url: https://github.com/NatLabRockies/WattAMeter, (Accessed: 2026-04-06)
2025
-
[28]
NLR HPC Resources,
NLR, “NLR HPC Resources,” 2025. url: https://natlabrockies.github.io/HPC, (Ac- cessed: 2026-04-06)
2025
-
[29]
url: https://docs.nvidia.com/deploy/nvml-api
Nvidia Corporation,NVML API Reference Guide, vR580 ed., September 2025. url: https://docs.nvidia.com/deploy/nvml-api
2025
-
[30]
Z. Yang, K. Adamek, and W. Armour, “Accurate and convenient energy mea- surements for gpus: A detailed study of nvidia gpu’s built-in power sen- sor,” inProceedings of the International Conference for High Performance Computing, Networking, Storage, and Analysis, SC ’24, IEEE Press, 2024. doi: 10.1109/SC41406.2024.00028
-
[31]
Rapl in action: Experiences in using rapl for power measurements,
K. N. Khan, M. Hirki, T. Niemi, J. K. Nurminen, and Z. Ou, “Rapl in action: Expe- riences in using rapl for power measurements,”ACM Trans. Model. Perform. Eval. Comput. Syst., vol. 3, Mar. 2018. doi: 10.1145/3177754
-
[32]
A validation of dram rapl power mea- surements,
S. Desrochers, C. Paradis, and V . M. Weaver, “A validation of dram rapl power mea- surements,” inProceedings of the Second International Symposium on Memory Sys- tems, MEMSYS ’16, (New York, NY , USA), p. 455–470, Association for Computing Machinery, 2016. doi: 10.1145/2989081.2989088
-
[33]
P. Mattson, C. Cheng, C. Coleman, G. Diamos, P. Micikevicius, D. Patterson, H. Tang, G.-Y . Wei, P. Bailis, V . Bittorf, D. Brooks, D. Chen, D. Dutta, U. Gupta, K. Hazelwood, A. Hock, X. Huang, A. Ike, B. Jia, D. Kang, D. Kanter, N. Kumar, J. Liao, G. Ma, D. Narayanan, T. Oguntebi, G. Pekhimenko, L. Pentecost, V . J. Reddi, T. Robie, T. St. John, T. Tabar...
-
[34]
Mlperf training benchmark v4.0,
MLCommons, “Mlperf training benchmark v4.0,” 2024. url: https://mlcommons.org/2024/06/mlperf-training-v4-benchmark-results/, (Ac- cessed: 2026-04-06)
2024
-
[35]
Llama 2: Open Foundation and Fine-Tuned Chat Models
H. Touvron, L. Martin, K. Stone, P. Albert, A. Almahairi, Y . Babaei, N. Bashlykov, S. Batra, P. Bhargava, S. Bhosale, D. Bikel, L. Blecher, C. Canton Ferrer, M. Chen, G. Cucurull, D. Esiobu, J. Fernandes, J. Fu, W. Fu, B. Fuller, C. Gao, V . Goswami, N. Goyal, A. Hartshorn, S. Hosseini, R. Hou, H. Inan, M. Kardas, V . Kerkez, M. Khabsa, I. Kloumann, A. K...
work page internal anchor Pith review Pith/arXiv arXiv doi:10.48550/arxiv.2307.09288 2023
-
[36]
U. Shaham, E. Segal, M. Ivgi, A. Efrat, O. Yoran, A. Haviv, A. Gupta, W. Xiong, M. Geva, J. Berant,et al., “Scrolls: Standardized comparison over long language sequences,”arXiv, 2022. doi: 10.48550/arXiv.2201.03533
-
[37]
LoRA: Low-Rank Adaptation of Large Language Models
E. J. Hu, Y . Shen, P. Wallis, Z. Allen-Zhu, Y . Li, S. Wang, L. Wang, and W. Chen, “LoRA: Low-rank adaptation of large language models,”arXiv, no. arXiv:2106.09685, 2021. doi: 10.48550/arXiv.2106.09685
work page internal anchor Pith review Pith/arXiv arXiv doi:10.48550/arxiv.2106.09685 2021
-
[38]
Zero-offload: Democratizing billion-scale model training,
J. Ren, S. Rajbhandari, R. Y . Aminabadi, O. Ruwase, S. Yang, M. Zhang, D. Li, and Y . He, “Zero-offload: Democratizing billion-scale model training,” in2021 USENIX Annual Technical Conference (USENIX ATC 21), pp. 551–564, 2021. url: https://www.usenix.org/conference/atc21/presentation/ren-jie
2021
-
[39]
LAION-400M: Open Dataset of CLIP-Filtered 400 Million Image-Text Pairs
C. Schuhmann, R. Vencu, R. Beaumont, R. Kaczmarczyk, C. Mullis, A. Katta, T. Coombes, J. Jitsev, and A. Komatsuzaki, “Laion-400m: Open dataset of clip- filtered 400 million image-text pairs,”arXiv, 2021. doi: 10.48550/arXiv.2111.02114
work page internal anchor Pith review doi:10.48550/arxiv.2111.02114 2021
-
[40]
Mlcommons training: Reference implementations of mlperf,
MLCommons, “Mlcommons training: Reference implementations of mlperf,” 2025. url: https://github.com/mlcommons/training, (Accessed: 2026-04-06)
2025
-
[41]
Efficient Memory Management for Large Language Model Serving with PagedAttention
W. Kwon, Z. Li, S. Zhuang, Y . Sheng, L. Zheng, C. H. Yu, J. E. Gonzalez, H. Zhang, and I. Stoica, “Efficient memory management for large language model serving with pagedattention,”arXiv, 2023. doi: 10.48550/arXiv.2309.06180. 41
work page internal anchor Pith review doi:10.48550/arxiv.2309.06180 2023
-
[42]
What are tokens and how to count them?,
OpenAI, “What are tokens and how to count them?,” 2025. url: https://help.openai.com/en/articles/4936856-what-are-tokens-and-how-to- count-them, (Accessed: 2026-04-06)
-
[43]
What is a context window?,
D. Bergmann, “What is a context window?,” 2025. url: https://www.ibm.com/think/topics/context-window, (Accessed: 2026-04-06)
2025
-
[44]
AI Load Dynamics-A Power Electronics Perspec- tive
Y . Li and Y . Li, “AI load dynamics–a power electronics perspective,”arXiv, no. arXiv:2502.01647, 2025. doi: 10.48550/arXiv.2502.01647
-
[45]
In: Proceedings of the 29th Symposium on Operating Systems Principles
W. Kwon, Z. Li, S. Zhuang, Y . Sheng, L. Zheng, C. H. Yu, J. Gonzalez, H. Zhang, and I. Stoica, “Efficient memory management for large language model serving with pagedattention,” inProceedings of the 29th Symposium on Operating Systems Prin- ciples, SOSP ’23, (New York, NY , USA), p. 611–626, Association for Computing Machinery, 2023. doi: 10.1145/360000...
-
[46]
Scherfke and O
S. Scherfke and O. Lünsdorf, “SimPy,” 2023. url: https://simpy.readthedocs.io/en/latest/index.html
2023
-
[47]
Nvidia h100 tensor core gpu - datasheet,
NVIDIA, “Nvidia h100 tensor core gpu - datasheet,” N.D. url: https://www.nvidia.com/en-us/data-center/h100/, (Accessed: 2026-04-06)
2026
-
[48]
4th generation amd epyc™processors,
AMD, “4th generation amd epyc™processors,” N.D. url: https://www.amd.com/en/products/processors/server/epyc/4th-generation- 9004-and-8004-series.html, (Accessed: 2026-04-06)
2026
-
[49]
Zero: Memory optimizations toward training trillion parameter models,
S. Rajbhandari, J. Rasley, O. Ruwase, and Y . He, “Zero: Memory optimizations toward training trillion parameter models,” inSC20: international conference for high performance computing, networking, storage and analysis, pp. 1–16, IEEE,
-
[50]
doi: 10.1109/SC41405.2020.00024
work page internal anchor Pith review Pith/arXiv arXiv doi:10.1109/sc41405.2020.00024 2020
-
[51]
Instructcoder: Instruction tuning large language models for code editing,
K. Li, Q. Hu, J. Zhao, H. Chen, Y . Xie, T. Liu, M. Shieh, and J. He, “Instructcoder: Instruction tuning large language models for code editing,” in Proceedings of the 62nd Annual Meeting of the Association for Computa- tional Linguistics (Volume 4: Student Research Workshop), pp. 50–70, 2024. url: https://huggingface.co/datasets/likaixin/InstructCoder
2024
-
[52]
mlperf-inference-llama2-data
mgoin, “mlperf-inference-llama2-data.” url: https://huggingface.co/datasets/mgoin/mlperf- inference-llama2-data, (Accessed: 2026-04-06)
2026
-
[53]
gpu-burn
V . Timonen, “gpu-burn.” url: https://github.com/wilicc/gpu-burn, (Accessed: 2026- 04-06). 42
2026
-
[54]
Insight Gained from Migrating a Machine Learning Model to Intelligence Processing Units,
M. Bachstein, C. Gropp, V . Hazlewood, and G. Peterson, “Lessons from bench- marking the ai tennessee initiative resources,” inPractice and Experience in Advanced Research Computing 2024: Human Powered Computing, PEARC ’24, (New York, NY , USA), Association for Computing Machinery, 2024. doi: 10.1145/3626203.3670524. 43
discussion (0)
Sign in with ORCID, Apple, or X to comment. Anyone can read and Pith papers without signing in.