Recognition: unknown
Isolating Sgr A East: The First Uncontaminated X-ray Maps of a Galactic Center Supernova Remnant
Pith reviewed 2026-05-10 16:58 UTC · model grok-4.3
The pith
Isolating Sgr A East supernova remnant yields lower ionization age and higher density than prior estimates.
A machine-rendered reading of the paper's core claim, the machinery that carries it, and where it could break.
Core claim
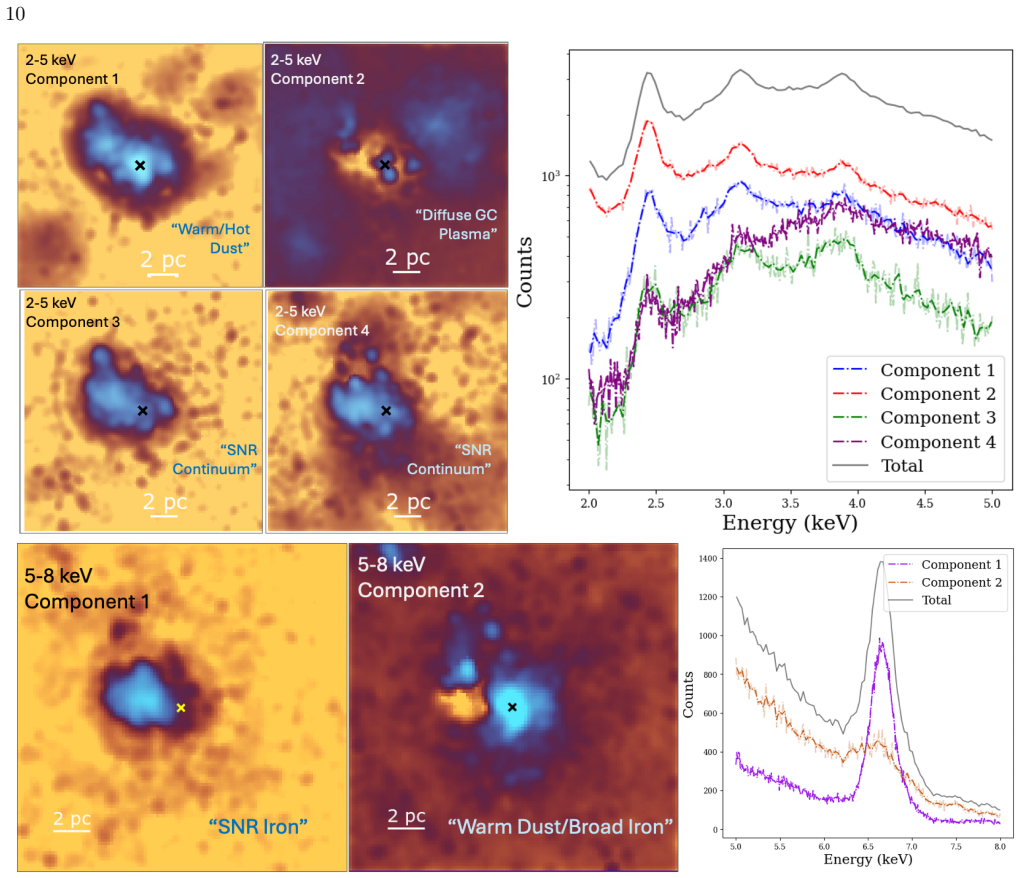
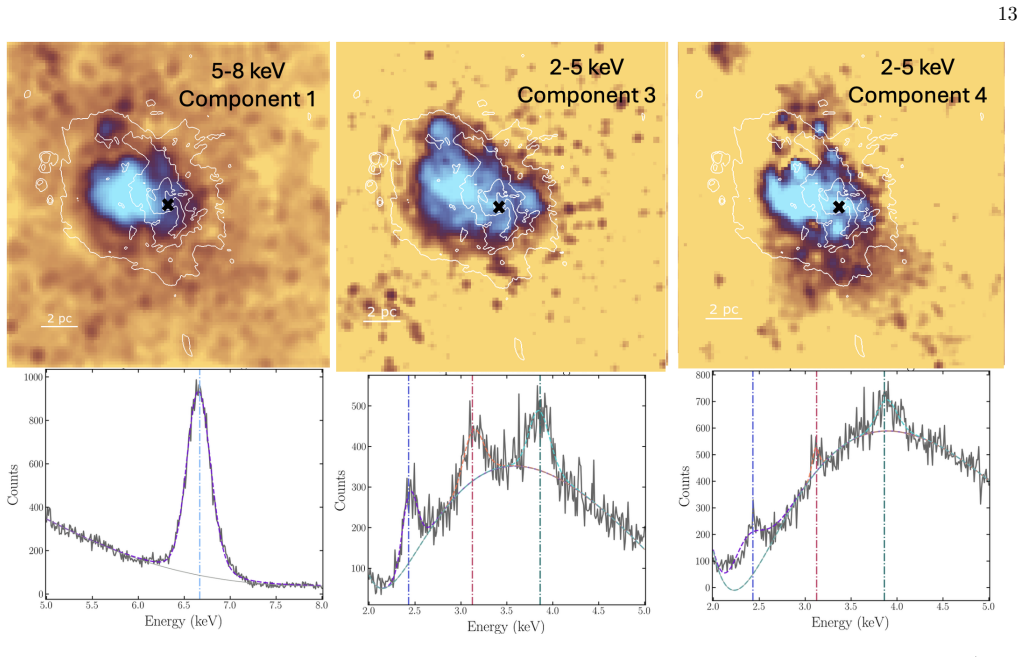
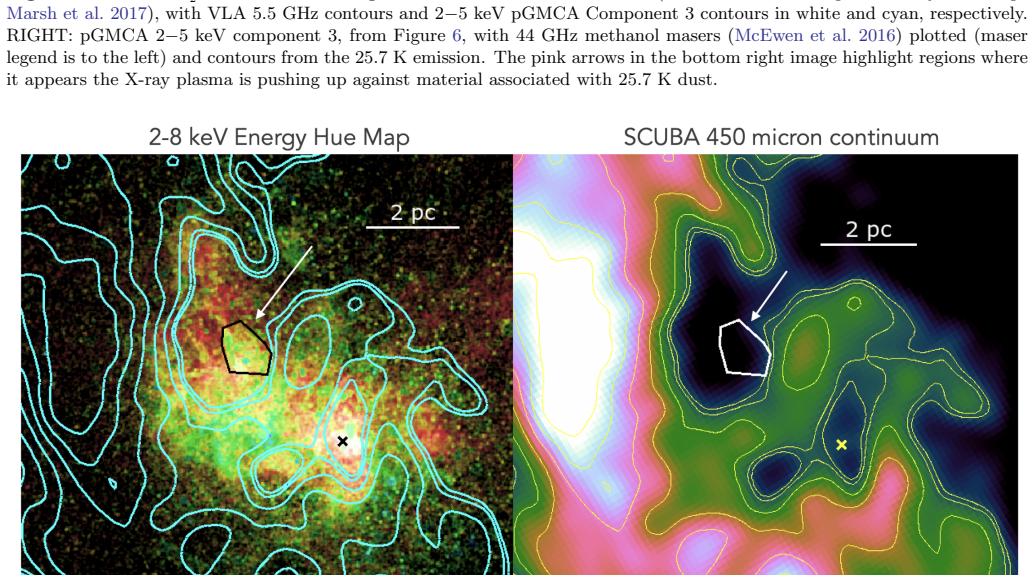
By decomposing the blended X-ray data with pGMCA, the authors isolate uncontaminated emission from Sgr A East and recover spectral models showing a lower ionization age and higher electron density than previously reported, consistent with strong interaction between the remnant and dense surrounding material.
What carries the argument
Poissonian Generalized Morphological Component Analysis (pGMCA), which decomposes the observed X-ray counts into distinct spatial-spectral components for the supernova remnant and the surrounding plasma.
If this is right
- The revised parameters imply the remnant has interacted more strongly with dense gas, altering estimates of its age, energy budget, and expansion into the Galactic Center environment.
- Spatially resolved maps of Fe, S, Ar, and Ca emission can now be used to study metal mixing in mixed-morphology remnants without confusion bias.
- The location of the reflected shock provides a direct anchor for modeling the remnant's dynamical history.
- Demonstrates a general method for extracting intrinsic properties from confused X-ray fields near galactic nuclei.
Where Pith is reading between the lines
- The same separation technique could be tested on other line-of-sight confused regions such as the Galactic ridge or nearby starburst nuclei to extract clean supernova remnant spectra.
- Higher electron density and lower ionization age together suggest the remnant is currently sweeping up material at a rate that could be checked against future infrared or radio observations of the surrounding molecular clouds.
- If confirmed, the revised parameters would tighten constraints on the supernova rate and energy injection needed to sustain the observed hot plasma in the central few parsecs.
Load-bearing premise
That the pGMCA decomposition cleanly separates the supernova remnant emission from the stellar wind plasma without residual contamination or artifacts that would alter the measured ionization age and density.
What would settle it
New observations or independent separation methods that produce ionization ages and densities for Sgr A East matching the older contaminated values, or multiwavelength data showing no dense material interaction.
Figures


read the original abstract
The central few parsecs of the Milky Way host a complex X-ray-emitting environment in which several extended plasma components are blended along the line of sight, complicating attempts to measure the intrinsic properties of individual components. In particular, the supernova remnant (SNR) Sgr A East is strongly confused with the stellar wind-fed plasma associated with Sagittarius A* and the surrounding nuclear environment. Here we apply Poissonian Generalized Morphological Component Analysis (pGMCA) to deep, stacked Chandra ACIS-I observations of the Galactic Center to disentangle these overlapping X-ray components. By comparing the separated X-ray components with multiwavelength data, we identify the location of the reflected shock in Sgr A East and construct spatially resolved maps of Fe and S/Ar/Ca emission. The Fe emission is centrally concentrated, consistent with the properties of mixed-morphology supernova remnants. Separating the SNR emission from the shocked wind plasma around Sgr A* allows us to recover uncontaminated SNR properties and improve the robustness of the derived parameters. Spectral modeling of the isolated Sgr A East component reveals a lower ionization age and a higher electron density than previously reported, indicating strong interaction with dense surrounding material.
Editorial analysis
A structured set of objections, weighed in public.
Referee Report
Summary. The paper applies Poissonian Generalized Morphological Component Analysis (pGMCA) to deep stacked Chandra ACIS-I observations of the Galactic Center to separate the X-ray emission of the supernova remnant Sgr A East from the overlapping stellar wind-fed plasma around Sgr A*. The authors compare the isolated components with multiwavelength data to locate the reflected shock, produce spatially resolved maps of Fe, S/Ar/Ca emission, and perform spectral modeling on the uncontaminated SNR component. They report a lower ionization age and higher electron density than prior studies, interpreting this as evidence of strong interaction with dense surrounding material.
Significance. If the component separation is robust, the work delivers the first spectrally uncontaminated view of Sgr A East, revising key plasma parameters and strengthening the case for its classification as a mixed-morphology SNR interacting with dense gas. This has direct implications for SNR evolution models in the Galactic Center environment and demonstrates the utility of morphological component analysis on blended X-ray fields. The multiwavelength morphological validation and construction of elemental maps are positive contributions.
major comments (3)
- [§3] §3 (Component Separation): The manuscript provides no end-to-end simulation tests that inject synthetic SNR and stellar-wind components with realistic spatial overlap, Poisson statistics, and known spectral parameters, then recover the spectra to quantify leakage and bias in the fitted ionization age (τ) and electron density (n_e). Without this, the central claim of revised lower τ and higher n_e rests on an unquantified assumption of negligible contamination.
- [§4.3] §4.3 (Spectral Modeling): The reported shifts in ionization age and density are presented as robust improvements, yet the text does not propagate uncertainties from the pGMCA separation step into the spectral fit errors or demonstrate that residual harder wind plasma cannot systematically lower τ while raising n_e.
- [§4.1] §4.1 (Morphological Comparison): The multiwavelength overlays confirm the spatial location of the reflected shock but do not test whether the extracted SNR spectrum is free of spectral contamination; morphological agreement alone does not guarantee spectral purity for the derived plasma parameters.
minor comments (3)
- [§4.3] The notation for ionization age (τ) and electron density (n_e) should be defined explicitly on first use in the spectral fitting section, and units should be stated consistently in the text and figure captions.
- [Figure 3] Figure 3 (elemental maps): The color bars lack explicit units or scaling information, making it difficult to assess the dynamic range of the Fe versus S/Ar/Ca emission.
- [§4.3] A brief comparison table of the new τ and n_e values against the specific literature values being revised would improve clarity.
Simulated Author's Rebuttal
We thank the referee for their detailed and constructive review. We address each of the major comments below and have made revisions to the manuscript to incorporate the suggested improvements where possible.
read point-by-point responses
-
Referee: [§3] The manuscript provides no end-to-end simulation tests that inject synthetic SNR and stellar-wind components with realistic spatial overlap, Poisson statistics, and known spectral parameters, then recover the spectra to quantify leakage and bias in the fitted ionization age (τ) and electron density (n_e). Without this, the central claim of revised lower τ and higher n_e rests on an unquantified assumption of negligible contamination.
Authors: We agree that end-to-end simulations would provide valuable quantitative validation of the component separation. In the revised version of the manuscript, we will add a new subsection in §3 describing results from such simulations. We inject synthetic SNR and stellar wind components with realistic spatial distributions, Poisson noise, and known spectral parameters into the Chandra data, then apply pGMCA and recover the spectra to measure any leakage or bias in τ and n_e. This will directly quantify the robustness of our separation and support the revised plasma parameters. revision: yes
-
Referee: [§4.3] The reported shifts in ionization age and density are presented as robust improvements, yet the text does not propagate uncertainties from the pGMCA separation step into the spectral fit errors or demonstrate that residual harder wind plasma cannot systematically lower τ while raising n_e.
Authors: We will update §4.3 to include an analysis of uncertainties arising from the pGMCA separation. This will involve performing spectral fits on multiple realizations of the separated components (varying the regularization parameters in pGMCA) and propagating these into the errors on τ and n_e. Additionally, we will demonstrate through spectral simulations that any residual harder wind plasma contamination would tend to increase rather than decrease the apparent ionization age, contrary to our findings, thus supporting that the observed shifts are not due to such bias. revision: yes
-
Referee: [§4.1] The multiwavelength overlays confirm the spatial location of the reflected shock but do not test whether the extracted SNR spectrum is free of spectral contamination; morphological agreement alone does not guarantee spectral purity for the derived plasma parameters.
Authors: We acknowledge the distinction between morphological and spectral validation. However, pGMCA performs a joint morphological and spectral separation, leveraging the different spatial distributions and spectral shapes of the components. The extracted SNR component shows a spectrum with prominent Fe emission lines and a thermal continuum that is softer than the stellar wind plasma, consistent with expectations for Sgr A East. The multiwavelength comparison further corroborates the spatial distribution. We will revise the text in §4.1 to explicitly discuss how the spectral properties of the separated component provide evidence against significant contamination. revision: partial
Circularity Check
No significant circularity detected
full rationale
The paper applies the external pGMCA component-separation algorithm to stacked Chandra ACIS-I data, performs multiwavelength morphological validation, extracts a spectrum for the isolated Sgr A East component, and then carries out standard spectral fitting to obtain ionization age and electron density. These fitted parameters are direct outputs of the modeling step applied to the separated data and are not equivalent to any input by construction. No self-citations, ansatzes, or uniqueness theorems are invoked in the provided text that would reduce the central claim to a prior result or fitted quantity. The derivation remains an independent data-analysis pipeline.
Axiom & Free-Parameter Ledger
axioms (1)
- domain assumption pGMCA can separate blended X-ray components based on morphological and spectral differences
Forward citations
Cited by 1 Pith paper
-
Ionization Structure and Metal Enrichment of the Galactic Center Minispiral Observed with JWST
JWST MIRI MRS observations show the Galactic Center Minispiral gas has 1-2.5 solar metallicity, Wolf-Rayet driven ionization, significant Ni and Fe dust destruction, and harder radiation in compact structures near Sgr A*.
Reference graph
Works this paper leans on
-
[1]
Astropy Collaboration, Robitaille, T. P., Tollerud, E. J., et al. 2013, A&A, 558, A33, doi: 10.1051/0004-6361/201322068 Astropy Collaboration, Price-Whelan, A. M., Sip˝ ocz, B. M., et al. 2018, AJ, 156, 123, doi: 10.3847/1538-3881/aabc4f Astropy Collaboration, Price-Whelan, A. M., Lim, P. L., et al. 2022, ApJ, 935, 167, doi: 10.3847/1538-4357/ac7c74
-
[2]
K., Maeda, Y., Morris, M., et al
Baganoff, F. K., Maeda, Y., Morris, M., et al. 2003, ApJ, 591, 891, doi: 10.1086/375145
-
[3]
2024, ApJ, 974, 98, doi: 10.3847/1538-4357/ad6c08
Balakrishnan, M., Corrales, L., Markoff, S., et al. 2024a, ApJ, 974, 98, doi: 10.3847/1538-4357/ad6c08
-
[4]
Balakrishnan, M., Russell, C. M. P., Corrales, L., et al. 2024b, ApJ, 974, 99, doi: 10.3847/1538-4357/ad6866
-
[5]
Bobin, J., Hamzaoui, I. E., Picquenot, A., & Acero, F. 2020, IEEE Transactions on Image Processing, 29, 9429, doi: 10.1109/TIP.2020.3027986
-
[6]
Bobin, J., Rapin, J., Larue, A., & Starck, J.-L. 2015, IEEE Transactions on Signal Processing, 63, 1199, doi: 10.1109/TSP.2015.2391071
-
[7]
2016, A&A, 591, A50, doi: 10.1051/0004-6361/201527822
Bobin, J., Sureau, F., & Starck, J.-L. 2016, A&A, 591, A50, doi: 10.1051/0004-6361/201527822
-
[8]
Borkowski, K. J., Reynolds, S. P., Hwang, U., et al. 2013, ApJL, 771, L9, doi: 10.1088/2041-8205/771/1/L9 Calder´ on, D., Cuadra, J., Schartmann, M., Burkert, A., &
-
[9]
Russell, C. M. P. 2020, ApJL, 888, L2, doi: 10.3847/2041-8213/ab5e81
-
[10]
Chatzopoulos, S., Fritz, T. K., Gerhard, O., et al. 2015, MNRAS, 447, 948, doi: 10.1093/mnras/stu2452
-
[11]
Coil, A. L., & Ho, P. T. P. 2000, ApJ, 533, 245, doi: 10.1086/308650
-
[12]
Cox, D. P., Shelton, R. L., Maciejewski, W., et al. 1999, ApJ, 524, 179, doi: 10.1086/307781
-
[13]
Cuadra, J., Nayakshin, S., & Wang, Q. D. 2015, MNRAS, 450, 277, doi: 10.1093/mnras/stv584
-
[14]
Draine, B. T. 2011, Physics of the Interstellar and Intergalactic Medium Ehlerov´ a, S., Palouˇ s, J., Morris, M. R., et al. 2022, A&A, 668, A124, doi: 10.1051/0004-6361/202244682
-
[15]
Hunter, J. D. 2007, Computing in Science and Engineering, 9, 90, doi: 10.1109/MCSE.2007.55
-
[16]
M., Herter, T
Lau, R. M., Herter, T. L., Morris, M. R., Li, Z., & Adams, J. D. 2015, VizieR Online Data Catalog (other), 0210, J/other/Sci/348
2015
-
[17]
2018, ApJS, 237, 13, doi: 10.3847/1538-4365/aacb24
Limongi, M., & Chieffi, A. 2018, ApJS, 237, 13, doi: 10.3847/1538-4365/aacb24
-
[18]
Maeda, Y., Baganoff, F. K., Feigelson, E. D., et al. 2002, ApJ, 570, 671, doi: 10.1086/339773 25 Figure 14.MergedChandraevent image created usingreproject obs, with point sources identified bywavdetectshown as green ellipses. These regions were manually refined to exclude diffuse structures misidentified as compact sources. The black diamond near the cent...
-
[19]
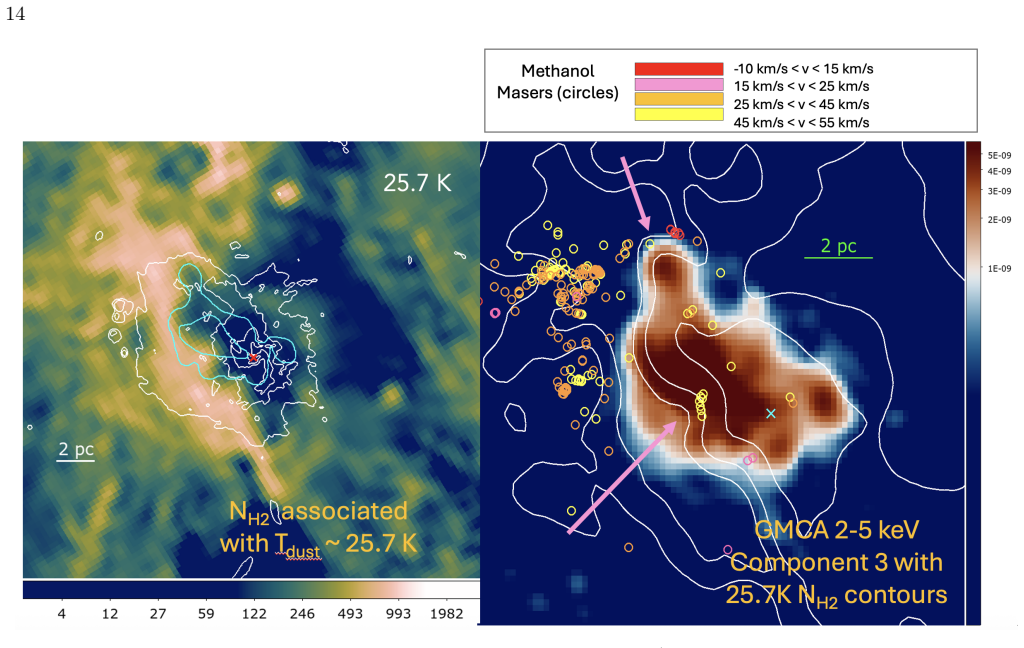
Marsh, K. A., Whitworth, A. P., Lomax, O., et al. 2017, MNRAS, 471, 2730, doi: 10.1093/mnras/stx1723
-
[20]
Martins, F., Genzel, R., Hillier, D. J., et al. 2007, A&A, 468, 233, doi: 10.1051/0004-6361:20066688
-
[21]
McEwen, B. C., Sjouwerman, L. O., & Pihlstr¨ om, Y. M. 2016, ApJ, 832, 129, doi: 10.3847/0004-637X/832/2/129
-
[22]
2024, ApJ, 964, 9, doi: 10.3847/1538-4357/ad25fa
Montez, R. 2024, ApJ, 964, 9, doi: 10.3847/1538-4357/ad25fa
-
[23]
Nesterov, Y. 2005, Math. Program., 103, 127–152, doi: 10.1007/s10107-004-0552-5
-
[24]
2010, PASJ, 62, 423, doi: 10.1093/pasj/62.2.423
Tatischeff, V. 2010, PASJ, 62, 423, doi: 10.1093/pasj/62.2.423
-
[25]
2006, NuPhA, 777, 424, doi: 10.1016/j.nuclphysa.2006.05.008
Maeda, K. 2006, NuPhA, 777, 424, doi: 10.1016/j.nuclphysa.2006.05.008
-
[26]
2025, Nature Astronomy, doi: 10.1038/s41550-024-02473-8
Olivares, V., Picquenot, A., Su, Y., et al. 2025, Nature Astronomy, doi: 10.1038/s41550-024-02473-8
-
[27]
2019, PASJ, 71, 52, doi: 10.1093/pasj/psz025
Ono, A., Uchiyama, H., Yamauchi, S., et al. 2019, PASJ, 71, 52, doi: 10.1093/pasj/psz025
-
[28]
Park, S., Muno, M. P., Baganoff, F. K., et al. 2004, ApJ, 603, 548, doi: 10.1086/381542
-
[29]
2006, ApJ, 643, 1011, doi: 10.1086/503273
Paumard, T., Genzel, R., Martins, F., et al. 2006, ApJ, 643, 1011, doi: 10.1086/503273
-
[30]
2019, A&A, 627, A139, doi: 10.1051/0004-6361/201834933
Picquenot, A., Acero, F., Bobin, J., et al. 2019, A&A, 627, A139, doi: 10.1051/0004-6361/201834933
-
[31]
Picquenot, A., Acero, F., Holland-Ashford, T., Lopez, L. A., & Bobin, J. 2021, A&A, 646, A82, doi: 10.1051/0004-6361/202039170
-
[32]
Pierce-Price, D., Richer, J. S., Greaves, J. S., et al. 2000, ApJL, 545, L121, doi: 10.1086/317884 Pihlstr¨ om, Y. M., & Sjouwerman, L. O. 2006, in Journal of Physics Conference Series, Vol. 54, Journal of Physics Conference Series, ed. R. Sch¨ odel, G. C. Bower, M. P
-
[33]
Muno, S. Nayakshin, & T. Ott (IOP), 77–80, doi: 10.1088/1742-6596/54/1/014
-
[34]
Rockefeller, G., Fryer, C. L., Baganoff, F. K., & Melia, F. 2005, ApJL, 635, L141, doi: 10.1086/499360
-
[35]
Sakano, M., Warwick, R. S., Decourchelle, A., & Predehl, P. 2004, MNRAS, 350, 129, doi: 10.1111/j.1365-2966.2004.07571.x 26
-
[36]
Sjouwerman, L. O., & Pihlstr¨ om, Y. M. 2008, ApJ, 681, 1287, doi: 10.1086/588753
-
[37]
Janka, H.-T. 2016, ApJ, 821, 38, doi: 10.3847/0004-637X/821/1/38
-
[38]
1996, ApJ, 460, 408, doi: 10.1086/176980
Thielemann, F.-K., Nomoto, K., & Hashimoto, M.-A. 1996, ApJ, 460, 408, doi: 10.1086/176980
-
[39]
2019, PASJ, 71, 105, doi: 10.1093/pasj/psz089
Tsuboi, M., Kitamura, Y., Tsutsumi, T., et al. 2019, PASJ, 71, 105, doi: 10.1093/pasj/psz089
-
[40]
2011, PASJ, 63, 763, doi: 10.1093/pasj/63.4.763
Tsuboi, M., Tadaki, K.-i., Miyazaki, A., & Handa, T. 2011, PASJ, 63, 763, doi: 10.1093/pasj/63.4.763
-
[41]
Vink, J. 2012, A&A Rv, 20, 49, doi: 10.1007/s00159-011-0049-1
-
[42]
Wang, Q. D. 2022, Universe, 8, 515, doi: 10.3390/universe8100515
-
[43]
Wang, Q. D., Dong, H., Cotera, A., et al. 2010, MNRAS, 402, 895, doi: 10.1111/j.1365-2966.2009.15973.x
-
[44]
White, R. L., & Long, K. S. 1991, ApJ, 373, 543, doi: 10.1086/170073
-
[45]
Woosley, S. E., & Weaver, T. A. 1995, ApJS, 101, 181, doi: 10.1086/192237 XRISM Collaboration. 2024, arXiv e-prints, arXiv:2412.00676, doi: 10.48550/arXiv.2412.00676
-
[46]
2015, A globally convergent algorithm for nonconvex optimization based on block coordinate update
Xu, Y., & Yin, W. 2015, A globally convergent algorithm for nonconvex optimization based on block coordinate update. https://arxiv.org/abs/1410.1386
-
[47]
2017, ApJ, 838, 12, doi: 10.3847/1538-4357/aa5d0f
Yalinewich, A., Piran, T., & Sari, R. 2017, ApJ, 838, 12, doi: 10.3847/1538-4357/aa5d0f
-
[48]
1986, PhD thesis, Columbia University, New York
Yusef-Zadeh, F. 1986, PhD thesis, Columbia University, New York
1986
-
[49]
Yusef-Zadeh, F., Lacy, J. H., Wardle, M., et al. 2010, ApJ, 725, 1429, doi: 10.1088/0004-637X/725/2/1429
-
[50]
1987, ApJ, 320, 545, doi: 10.1086/165572
Yusef-Zadeh, F., & Morris, M. 1987, ApJ, 320, 545, doi: 10.1086/165572
-
[51]
Yusef-Zadeh, F., Roberts, D. A., Goss, W. M., Frail, D. A., & Green, A. J. 1996, ApJL, 466, L25, doi: 10.1086/310165 —. 1999a, ApJ, 512, 230, doi: 10.1086/306769 —. 1999b, ApJ, 512, 230, doi: 10.1086/306769
-
[52]
Yusef-Zadeh, F., Roberts, D. A., & Wardle, M. 1997, ApJL, 490, L83, doi: 10.1086/310997
-
[53]
2005, Advances in Space Research, 35, 1074, doi: 10.1016/j.asr.2005.02.057
Yusef-Zadeh, F., Wardle, M., Muno, M., Law, C., & Pound, M. 2005, Advances in Space Research, 35, 1074, doi: 10.1016/j.asr.2005.02.057
-
[54]
Zhao, J.-H., Morris, M. R., & Goss, W. M. 2013, ApJ, 777, 146, doi: 10.1088/0004-637X/777/2/146 —. 2016, ApJ, 817, 171, doi: 10.3847/0004-637X/817/2/171
discussion (0)
Sign in with ORCID, Apple, or X to comment. Anyone can read and Pith papers without signing in.