Recognition: unknown
Bridging Natural Language and Interactive What-If Interfaces via LLM-Generated Declarative Specification
Pith reviewed 2026-05-10 17:01 UTC · model grok-4.3
The pith
An intermediate declarative specification lets large language models turn natural-language what-if questions into reliable interactive visual interfaces.
A machine-rendered reading of the paper's core claim, the machinery that carries it, and where it could break.
Core claim
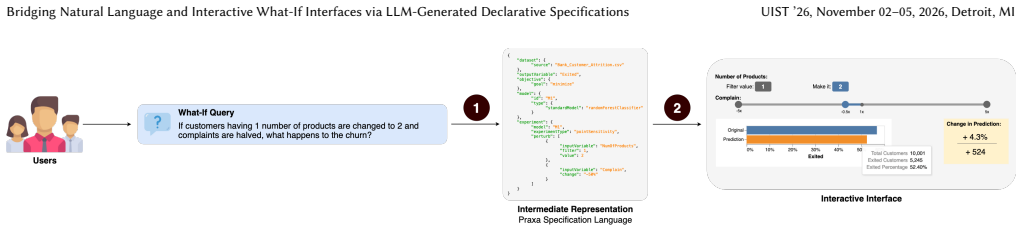
Large language models can generate declarative specifications from natural-language what-if questions that capture analytical intent and logic; these specifications can be validated and repaired, then compiled into interactive visual interfaces with parameter controls and linked views; when this intermediate layer is omitted, errors propagate and produce plausible but misleading interfaces.
What carries the argument
The declarative specification that encodes user intent, parameters, constraints, and analysis logic, which is generated by the model, repaired as needed, and then compiled into the interactive interface.
If this is right
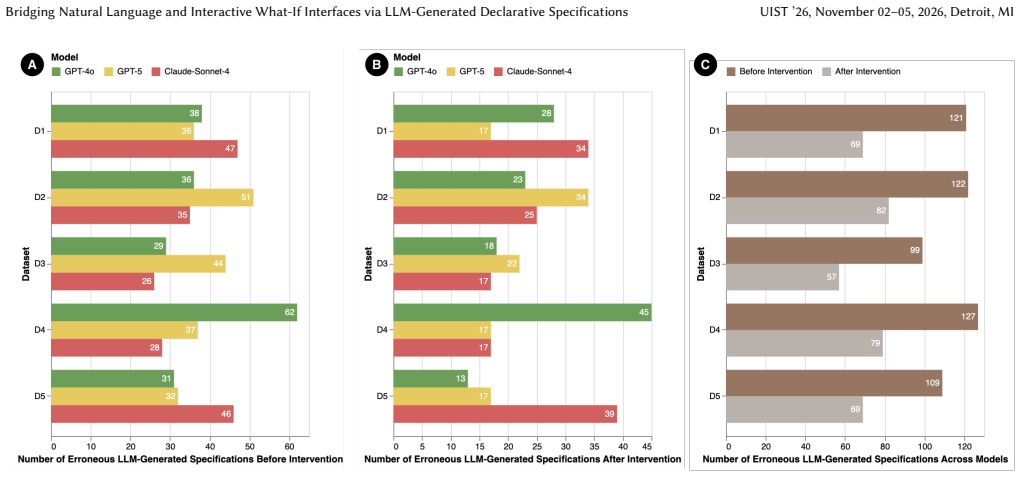
- Roughly half of LLM-generated specifications require no intervention across tested models.
- Few-shot repair prompts can raise the overall success rate to more than 80 percent.
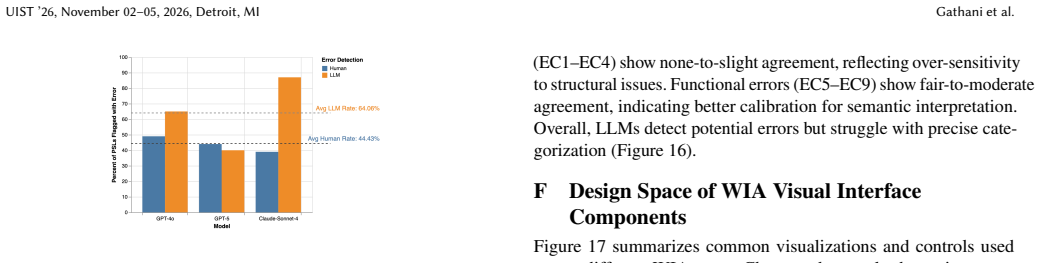
- Functional errors that survive compilation produce interfaces that appear correct but answer the wrong question.
- An error taxonomy separating compilation failures from intent mismatches guides repair strategies.
Where Pith is reading between the lines
- The same specification layer could be reused to support editing or reuse of previously created what-if scenarios.
- Displaying the generated specification alongside the interface would let users verify or adjust intent directly.
- The error taxonomy could inform fine-tuning of models specifically for analytical specification tasks.
Load-bearing premise
Large language models can produce specifications that correctly represent user intent in the majority of cases, so that only targeted repairs are required for the remainder.
What would settle it
A collection of natural-language what-if questions for which a generated specification compiles successfully yet the resulting interface sets parameter values or displays visualizations that contradict the original question.
Figures


read the original abstract
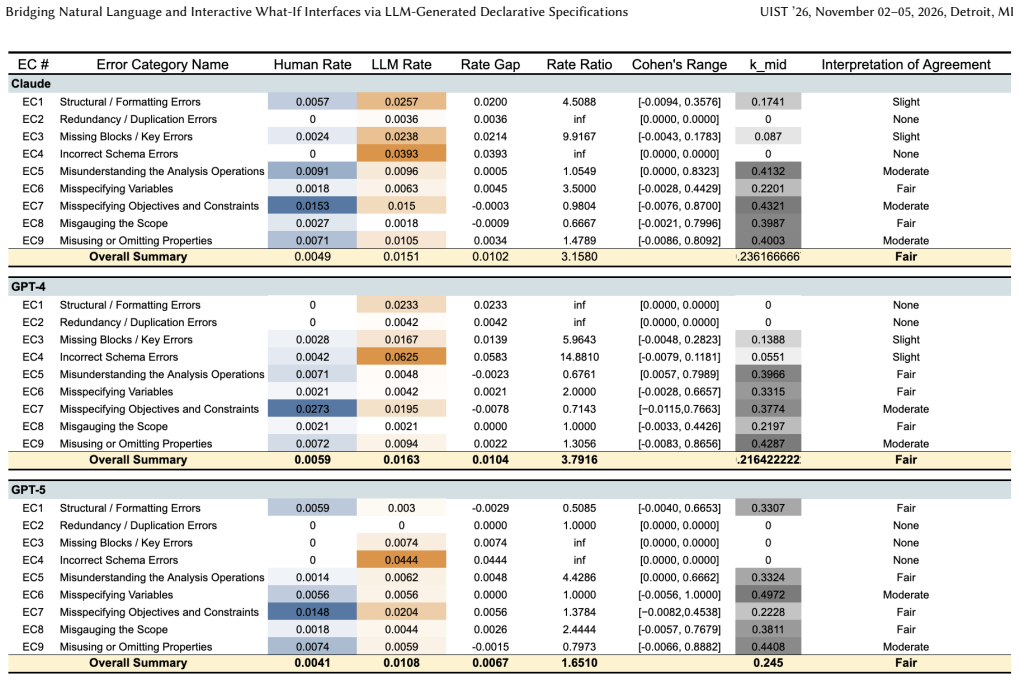
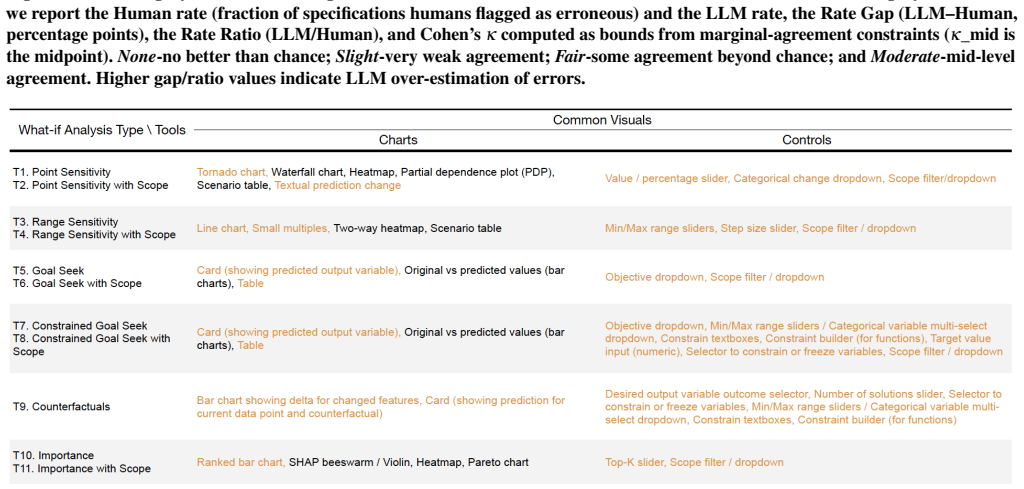
What-if analysis (WIA) is an iterative, multi-step process where users explore and compare hypothetical scenarios by adjusting parameters, applying constraints, and scoping data through interactive interfaces. Current tools fall short of supporting effective interactive WIA: spreadsheet and BI tools require time-consuming and laborious setup, while LLM-based chatbot interfaces are semantically fragile, frequently misinterpret intent, and produce inconsistent results as conversations progress. To address these limitations, we present a two-stage workflow that translates natural language (NL) WIA questions into interactive visual interfaces via an intermediate representation, powered by the Praxa Specification Language (PSL): first, LLMs generate PSL specifications from NL questions capturing analytical intent and logic, enabling validation and repair of erroneous specifications; and second, the specifications are compiled into interactive visual interfaces with parameter controls and linked visualizations. We benchmark this workflow with 405 WIA questions spanning 11 WIA types, 5 datasets, and 3 state-of-the-art LLMs. The results show that across models, half of specifications (52.42%) are generated correctly without intervention. We perform an analysis of the failure cases and derive an error taxonomy spanning non-functional errors (specifications fail to compile) and functional errors (specifications compile but misrepresent intent). Based on the taxonomy, we apply targeted repairs on the failure cases using few-shot prompts and improve the success rate to 80.42%. Finally, we show how undetected functional errors propagate through compilation into plausible but misleading interfaces, demonstrating that the intermediate specification is critical for reliably bridging NL and interactive WIA interface in LLM-powered WIA systems.
Editorial analysis
A structured set of objections, weighed in public.
Referee Report
Summary. The paper proposes a two-stage workflow that uses LLMs to generate specifications in the newly introduced Praxa Specification Language (PSL) from natural language what-if analysis (WIA) questions; these specifications are then validated/repaired and compiled into interactive visual interfaces with parameter controls and linked visualizations. It evaluates the approach on a benchmark of 405 WIA questions spanning 11 WIA types, 5 datasets, and 3 LLMs, reporting a baseline success rate of 52.42% that rises to 80.42% after targeted few-shot repairs derived from an error taxonomy of non-functional and functional errors, and argues that the intermediate PSL representation is essential to prevent propagation of intent-misrepresentation errors into misleading interfaces.
Significance. If the central claims hold, the work offers a concrete, empirically supported method for making LLM-driven WIA more reliable than direct chatbot interfaces while avoiding the setup overhead of traditional BI tools. The large-scale benchmark, explicit error taxonomy, and demonstration of how undetected functional errors produce plausible but incorrect compiled interfaces are notable strengths that directly support the value of the intermediate declarative layer.
major comments (1)
- [results and error-analysis sections] The evaluation of the repair stage (results and error-analysis sections): the few-shot repair prompts are derived from the error taxonomy obtained on the entire 405-question benchmark. No held-out test set, cross-validation, or separate generalization experiment is reported for the repair prompts themselves. This leaves open whether the jump from 52.42% to 80.42% reflects general repair strategies or patterns specific to the benchmark's 11 WIA types and 5 datasets, directly affecting the claim that the workflow reliably captures user intent on new questions.
minor comments (2)
- [Abstract] The abstract states that 'half of specifications (52.42%) are generated correctly'; the parenthetical figure is slightly above 50% and should be phrased consistently with the exact reported value.
- PSL is presented as an invented entity; a self-contained syntax definition, grammar, or example set should appear early (ideally before the benchmark) to allow readers to assess the compilation step without external lookup.
Simulated Author's Rebuttal
We thank the referee for the thoughtful and detailed review. The concern about the repair stage evaluation is well-taken, and we address it directly below.
read point-by-point responses
-
Referee: [results and error-analysis sections] The evaluation of the repair stage (results and error-analysis sections): the few-shot repair prompts are derived from the error taxonomy obtained on the entire 405-question benchmark. No held-out test set, cross-validation, or separate generalization experiment is reported for the repair prompts themselves. This leaves open whether the jump from 52.42% to 80.42% reflects general repair strategies or patterns specific to the benchmark's 11 WIA types and 5 datasets, directly affecting the claim that the workflow reliably captures user intent on new questions.
Authors: We agree that the current evaluation leaves the generalizability of the specific few-shot repair prompts untested in a strict sense. The error taxonomy was intentionally derived from the full 405-question benchmark to ensure broad coverage of non-functional and functional errors across all 11 WIA types, 5 datasets, and 3 LLMs. The repair prompts were then constructed from representative examples in that taxonomy and applied to the observed failures. While this yields a clear demonstration that targeted repairs can substantially improve success rates (52.42% to 80.42%), it does not constitute an independent test of whether the same prompts would succeed on entirely new questions outside the benchmark distribution. To strengthen the manuscript, we will revise the results and error-analysis sections to explicitly acknowledge this limitation and add a held-out evaluation: we will randomly partition the benchmark into an 80/20 development/test split, re-derive the taxonomy and few-shot prompts solely from the development portion, apply the resulting prompts to failures in the held-out test portion, and report the repair success rate on unseen questions. This addition will directly address the concern about whether the observed improvement reflects general repair strategies. revision: yes
Circularity Check
Repair prompts and taxonomy derived from and applied to the same 405-question benchmark
specific steps
-
fitted input called prediction
[Abstract]
"We perform an analysis of the failure cases and derive an error taxonomy spanning non-functional errors (specifications fail to compile) and functional errors (specifications compile but misrepresent intent). Based on the taxonomy, we apply targeted repairs on the failure cases using few-shot prompts and improve the success rate to 80.42%."
The error taxonomy is extracted from failures on the 405-question benchmark. Few-shot repair prompts are built from that taxonomy. Applying the resulting repairs to the identical failure cases and reporting the 80.42% success rate means the final metric is obtained by construction from the data used to define the repair strategy, rather than measuring performance on held-out questions.
full rationale
The paper measures initial LLM generation success (52.42%) directly on the 405-question benchmark. It then derives an error taxonomy from the observed failures on that same benchmark and constructs few-shot repair prompts from the taxonomy. These repairs are applied back to the failure cases, yielding the improved 80.42% figure. This makes the headline performance metric a fitted result on the evaluation data rather than an independent test of generalization. The demonstration that undetected functional errors produce misleading interfaces remains an independent observation, and no self-citations or definitional loops appear in the core workflow.
Axiom & Free-Parameter Ledger
axioms (1)
- domain assumption Current large language models are capable of generating syntactically and semantically correct PSL specifications from natural language descriptions of what-if analyses when given appropriate prompts.
invented entities (1)
-
Praxa Specification Language (PSL)
no independent evidence
Reference graph
Works this paper leans on
-
[1]
Anonymous. 2025. Supplementary Materials: OSF. https://osf.io/hsu6t/overview? view_only=ec9b0bd336c845e1a45408ae25349d4d
2025
-
[2]
Anthropic. 2025. Claude (Opus 4.1) [Large language model]. https://claude.ai/
2025
-
[3]
Aditya Bhattacharya, Jeroen Ooge, Gregor Stiglic, and Katrien Verbert. 2023. Di- rective explanations for monitoring the risk of diabetes onset: introducing directive data-centric explanations and combinations to support what-if explorations. In Proceedings of the 28th international conference on intelligent user interfaces. 204–219
2023
-
[4]
Microsoft Corporation. 2025. Microsoft Excel. https://office.microsoft.com/excel
2025
-
[5]
Microsoft Corporation. 2025. Microsoft Power BI. https://powerbi.microsoft.com
2025
-
[6]
Kedar Dhamdhere, Kevin S McCurley, Ralfi Nahmias, Mukund Sundararajan, and Qiqi Yan. 2017. Analyza: Exploring data with conversation. InProceedings of the 22nd International Conference on Intelligent User Interfaces. 493–504
2017
-
[7]
Ethan Fast, Binbin Chen, Julia Mendelsohn, Jonathan Bassen, and Michael S Bernstein. 2018. Iris: A conversational agent for complex tasks. InProceedings of the 2018 CHI conference on human factors in computing systems. 1–12
2018
-
[8]
Han Fu, Chang Liu, Bin Wu, Feifei Li, Jian Tan, and Jianling Sun. 2023. Catsql: Towards real world natural language to sql applications.Proceedings of the VLDB Endowment16, 6 (2023), 1534–1547
2023
-
[9]
Tong Gao, Mira Dontcheva, Eytan Adar, Zhicheng Liu, and Karrie G Karahalios
-
[10]
InProceedings of the 28th annual acm symposium on user interface software & technology
Datatone: Managing ambiguity in natural language interfaces for data visualization. InProceedings of the 28th annual acm symposium on user interface software & technology. 489–500
-
[11]
Sneha Gathani, Madelon Hulsebos, James Gale, Peter J Haas, and Ça˘gatay Demi- ralp. 2021. Augmenting decision making via interactive what-if analysis.CIDR (2021)
2021
-
[12]
PRAXA: A Grammar for What-If Analysis
Sneha Gathani, Kevin Li, Raghav Thind, Sirui Zeng, Matthew Xu, Peter J. Haas, Cagatay Demiralp, and Zhicheng Liu. 2025. PRAXA: A Grammar for What-If Analysis. arXiv:2510.09791 [cs.HC] https://arxiv.org/abs/2510.09791
work page internal anchor Pith review Pith/arXiv arXiv 2025
-
[13]
Sneha Gathani, Zhicheng Liu, Peter J Haas, and Ça˘gatay Demiralp. 2025. What-if Analysis for Business Professionals: Current Practices and Future Opportunities. InProceedings of the 2025 CHI Conference on Human Factors in Computing Systems. 1–17
2025
-
[14]
Gokagglers. 2024. Email Campaign Management Dataset for Predicting Whether Email is Opened or Not. https://www.kaggle.com/datasets/loveall/email- campaign-management-for-sme?select=Train_psolI3n.csv
2024
-
[15]
Pat Hanrahan. 2006. Vizql: a language for query, analysis and visualization. In Proceedings of the 2006 ACM SIGMOD international conference on Management of data. 721–721
2006
-
[16]
Subhashis Hazarika, Haruki Hirasawa, Sookyung Kim, Kalai Ramea, Salva R Cachay, Peetak Mitra, Dipti Hingmire, Hansi Singh, and Phil J Rasch. 2023. HAiV A: Hybrid AI-assisted Visual Analysis Framework to Study the Effects of Cloud Properties on Climate Patterns. In2023 IEEE Visualization and Visual Analytics (VIS). IEEE, 226–230
2023
-
[17]
Jeffrey Heer, Matthew Conlen, Vishal Devireddy, Tu Nguyen, and Joshua Horowitz. 2023. Living papers: A language toolkit for augmented scholarly communication. InProceedings of the 36th Annual ACM Symposium on User Interface Software and Technology. 1–13
2023
-
[18]
Fred Hohman, Andrew Head, Rich Caruana, Robert DeLine, and Steven M Drucker. 2019. Gamut: A design probe to understand how data scientists un- derstand machine learning models. InProceedings of the 2019 CHI conference on human factors in computing systems. 1–13
2019
-
[19]
Kaggle. 2024. Marketing Analytics Dataset for Predicting Accepted Campaigns. https://www.kaggle.com/code/karltonkxb/marketing-analysis- classification-and-clustering/input
2024
-
[20]
Kaggle. 2024. Spotify Revenue, Expenses and Its Premium. https://www.kaggle. com/code/rohithreddy0920/spotify-revenue-expenses-and-its-premium/input
2024
-
[21]
Hyeok Kim, Ryan Rossi, Fan Du, Eunyee Koh, Shunan Guo, Jessica Hullman, and Jane Hoffswell. 2022. Cicero: A declarative grammar for responsive visualization. InProceedings of the 2022 CHI Conference on Human Factors in Computing Systems. 1–15
2022
-
[22]
Kenrick Kin, Björn Hartmann, Tony DeRose, and Maneesh Agrawala. 2012. Proton: multitouch gestures as regular expressions. InProceedings of the SIGCHI Conference on Human Factors in Computing Systems. 2885–2894
2012
-
[23]
Hyung-Kwon Ko, Hyeon Jeon, Gwanmo Park, Dae Hyun Kim, Nam Wook Kim, Juho Kim, and Jinwook Seo. 2024. Natural language dataset generation framework for visualizations powered by large language models. InProceedings of the 2024 CHI Conference on Human Factors in Computing Systems. 1–22
2024
-
[24]
Sonia Laguna, Julian N Heidenreich, Jiugeng Sun, Nilüfer Cetin, Ibrahim Al- Hazwani, Udo Schlegel, Furui Cheng, and Mennatallah El-Assady. 2023. Ex- pLIMEable: A Visual Analytics Approach for Exploring LIME. In2023 Workshop on Visual Analytics in Healthcare (VAHC). IEEE, 27–33
2023
-
[25]
Jungeun Lee, Sungnam Kim, Minki Cheon, Hyojin Ju, JaeEun Lee, and Inseok Hwang. 2022. SleepGuru: Personalized Sleep Planning System for Real-life Ac- tionability and Negotiability. InProceedings of the 35th Annual ACM Symposium on User Interface Software and Technology. 1–16
2022
-
[26]
Wei Luo, Michael Steptoe, Zheng Chang, Robert Link, Leon Clarke, and Ross Maciejewski. 2017. Impact of spatial scales on the intercomparison of climate scenarios.IEEE Computer Graphics and Applications37, 5 (2017), 40–49
2017
-
[27]
Yuyu Luo, Nan Tang, Guoliang Li, Chengliang Chai, Wenbo Li, and Xuedi Qin
-
[28]
InProceedings of the 2021 International Conference on Management of Data
Synthesizing natural language to visualization (NL2VIS) benchmarks from NL2SQL benchmarks. InProceedings of the 2021 International Conference on Management of Data. 1235–1247
2021
-
[29]
Yuyu Luo, Nan Tang, Guoliang Li, Jiawei Tang, Chengliang Chai, and Xuedi Qin
-
[30]
Natural language to visualization by neural machine translation.IEEE Transactions on Visualization and Computer Graphics28, 1 (2021), 217–226
2021
-
[31]
Sagar Maru. 2024. Bank Customer Dataset for Predicting Customer Churn. https://www.kaggle.com/datasets/marusagar/bank-customer-attrition-insights
2024
-
[32]
Microsoft. 2025. Chartifact. (2025). https://microsoft.github.io/chartifact/
2025
-
[33]
Dominik Moritz, Chenglong Wang, Greg L Nelson, Halden Lin, Adam M Smith, Bill Howe, and Jeffrey Heer. 2018. Formalizing visualization design knowledge as constraints: Actionable and extensible models in draco.IEEE transactions on visualization and computer graphics25, 1 (2018), 438–448
2018
-
[34]
Arpit Narechania, Arjun Srinivasan, and John Stasko. 2020. NL4DV: A toolkit for generating analytic specifications for data visualization from natural language queries.IEEE Transactions on Visualization and Computer Graphics27, 2 (2020), 369–379
2020
-
[35]
OpenAI. 2024. Data Analyst GPT. https://chatgpt.com/g/g-HMNcP6w7d-data- analyst?model=gpt-4o. Custom GPT available via ChatGPT
2024
-
[36]
Xiaoying Pu and Matthew Kay. 2023. How Data Analysts Use a Visualization Grammar in Practice. InProceedings of the 2023 CHI Conference on Human Factors in Computing Systems(Hamburg, Germany)(CHI ’23). Association for Computing Machinery, New York, NY , USA, Article 840, 22 pages. doi:10.1145/ 3544548.3580837
-
[37]
Salesforce
Inc. Salesforce. [n. d.]. Salesforce Einstein Analytics. https://www.salesforce. com/products/einstein/overview
-
[38]
Arvind Satyanarayan and Jeffrey Heer. 2014. Lyra: An interactive visualization design environment. InComputer graphics forum, V ol. 33. Wiley Online Library, 351–360. UIST ’26, November 02–05, 2026, Detroit, MI Gathani et al
2014
-
[39]
Arvind Satyanarayan, Dominik Moritz, Kanit Wongsuphasawat, and Jeffrey Heer
-
[40]
Vega-lite: A grammar of interactive graphics.IEEE transactions on visualization and computer graphics23, 1 (2016), 341–350
2016
-
[41]
Arvind Satyanarayan, Kanit Wongsuphasawat, and Jeffrey Heer. 2014. Declarative interaction design for data visualization. InProceedings of the 27th annual ACM symposium on User interface software and technology. 669–678
2014
-
[42]
Hans-Jörg Schulz, Thomas Nocke, Magnus Heitzler, and Heidrun Schumann
-
[43]
A design space of visualization tasks.IEEE Transactions on Visualization and Computer Graphics19, 12 (2013), 2366–2375
2013
-
[44]
Vidya Setlur, Sarah E Battersby, Melanie Tory, Rich Gossweiler, and Angel X Chang. 2016. Eviza: A natural language interface for visual analysis. InProceed- ings of the 29th annual symposium on user interface software and technology. 365–377
2016
-
[45]
Yuanfeng Song, Raymond Chi-Wing Wong, Xuefang Zhao, and Di Jiang. 2022. V oiceQuerySystem: A voice-driven database querying system using natural lan- guage questions. InProceedings of the 2022 International Conference on Man- agement of Data. 2385–2388
2022
-
[46]
Yuanfeng Song, Xuefang Zhao, Raymond Chi-Wing Wong, and Di Jiang. 2022. Rgvisnet: A hybrid retrieval-generation neural framework towards automatic data visualization generation. InProceedings of the 28th ACM SIGKDD Conference on Knowledge Discovery and Data Mining. 1646–1655
2022
-
[47]
Arjun Srinivasan, Bongshin Lee, Nathalie Henry Riche, Steven M Drucker, and Ken Hinckley. 2020. InChorus: Designing consistent multimodal interactions for data visualization on tablet devices. InProceedings of the 2020 CHI conference on human factors in computing systems. 1–13
2020
-
[48]
Arjun Srinivasan and John T. Stasko. 2017. Natural Language Interfaces for Data Analysis with Visualization: Considering What Has and Could Be Asked. In EuroVis 2017 - Short Papers, Barbora Kozlikova, Tobias Schreck, and Thomas Wis- chgoll (Eds.). The Eurographics Association. doi:10.2312/eurovisshort.20171133
-
[49]
a Salesforce Company Tableau Software. 2025. Tableau. https://www.tableau. com
2025
-
[50]
Zain Tariq, Miro Mannino, Mai Le Xuan Anh, Whitney Bagge, Azza Abouzied, and Dennis Shasha. 2021. Planning epidemic interventions with EpiPolicy. In The 34th Annual ACM Symposium on User Interface Software and Technology. 894–909
2021
-
[51]
Yuan Tian, Weiwei Cui, Dazhen Deng, Xinjing Yi, Yurun Yang, Haidong Zhang, and Yingcai Wu. 2024. Chartgpt: Leveraging llms to generate charts from abstract natural language.IEEE Transactions on Visualization and Computer Graphics31, 3 (2024), 1731–1745
2024
-
[52]
Yuan Tian, Jonathan K Kummerfeld, Toby Jia-Jun Li, and Tianyi Zhang. 2024. Sqlucid: Grounding natural language database queries with interactive explana- tions. InProceedings of the 37th Annual ACM Symposium on User Interface Software and Technology. 1–20
2024
-
[53]
Yuan Tian, Daniel Lee, Fei Wu, Tung Mai, Kun Qian, Siddhartha Sahai, Tianyi Zhang, and Yunyao Li. 2025. Text-to-SQL Domain Adaptation via Human- LLM Collaborative Data Annotation. InProceedings of the 30th International Conference on Intelligent User Interfaces. 1398–1425
2025
-
[54]
Priyan Vaithilingam, Elena L Glassman, Jeevana Priya Inala, and Chenglong Wang
-
[55]
In Proceedings of the 2024 CHI Conference on Human Factors in Computing Systems
Dynavis: Dynamically synthesized ui widgets for visualization editing. In Proceedings of the 2024 CHI Conference on Human Factors in Computing Systems. 1–17
2024
-
[56]
James Wexler, Mahima Pushkarna, Tolga Bolukbasi, Martin Wattenberg, Fernanda Viégas, and Jimbo Wilson. 2019. The what-if tool: Interactive probing of machine learning models.IEEE transactions on visualization and computer graphics26, 1 (2019), 56–65
2019
-
[57]
Hadley Wickham. 2011. ggplot2.Wiley interdisciplinary reviews: computational statistics3, 2 (2011), 180–185
2011
-
[58]
Kanit Wongsuphasawat, Zening Qu, Dominik Moritz, Riley Chang, Felix Ouk, Anushka Anand, Jock Mackinlay, Bill Howe, and Jeffrey Heer. 2017. V oyager 2: Augmenting visual analysis with partial view specifications. InProceedings of the 2017 chi conference on human factors in computing systems. 2648–2659
2017
-
[59]
Yingcai Wu, Shixia Liu, Kai Yan, Mengchen Liu, and Fangzhao Wu. 2014. Opin- ionflow: Visual analysis of opinion diffusion on social media.IEEE transactions on visualization and computer graphics20, 12 (2014), 1763–1772
2014
-
[60]
Yogesh Agrawal. 2024. Media Spends Dataset for Predicting Sales. https: //www.kaggle.com/datasets/yugagrawal95/sample-media-spends-data
2024
-
[61]
Bowen Yu and Cláudio T Silva. 2019. FlowSense: A natural language interface for visual data exploration within a dataflow system.IEEE transactions on visualization and computer graphics26, 1 (2019), 1–11
2019
-
[62]
Create an interactive interface to learn what happens to the churn likelihood if the estimated salary is doubled for this bank dataset
Yuheng Zhao, Yixing Zhang, Yu Zhang, Xinyi Zhao, Junjie Wang, Zekai Shao, Cagatay Turkay, and Siming Chen. 2024. Leva: Using large language models to enhance visual analytics.IEEE transactions on visualization and computer graphics31, 3 (2024), 1830–1847. Figure 11: Six WIA scenarios spanning different analysis types used in our formative exploration of e...
2024
discussion (0)
Sign in with ORCID, Apple, or X to comment. Anyone can read and Pith papers without signing in.