Recognition: no theorem link
Analysis of non pharmaceutical interventions with SIR epidemic models: decreasing the infection peak vs. minimizing the epidemic size
Pith reviewed 2026-05-10 17:44 UTC · model grok-4.3
The pith
Minimizing the infection peak requires implementing NPIs earlier than minimizing total epidemic size in SIR models.
A machine-rendered reading of the paper's core claim, the machinery that carries it, and where it could break.
Core claim
Analytical and numerical analysis of SIR models with step-change NPIs demonstrates that the initiation time minimizing the infection peak is strictly earlier than the time minimizing final epidemic size, with transmission-rate reductions outperforming contact reductions for size control at equal reproductive-number impact.
What carries the argument
SIR compartmental models in which NPIs appear as instantaneous, permanent reductions either in the transmission rate beta or in the contact network, plus closed-form approximations locating the infection peak and computing final size.
If this is right
- Strategies aimed at flattening the curve must schedule NPIs ahead of those aimed only at limiting total cases.
- When the goal is total size reduction, measures lowering individual transmission rates outperform equivalent contact reductions.
- Six qualitatively different epidemic trajectories are possible depending on whether an NPI starts before, at, or after the natural peak.
- The ordering of optimal timing remains consistent when moving from homogeneous mean-field to heterogeneous network models.
Where Pith is reading between the lines
- If real NPIs ramp up gradually rather than instantly, the required lead time for peak control could be even longer than the models indicate.
- Combining both transmission and contact reductions in sequence might allow later overall implementation while still meeting both targets.
- The six-scenario classification could be used to classify historical outbreaks retrospectively and test whether observed timing matches the predicted thresholds.
Load-bearing premise
NPIs act as sudden, uniform, and permanent step changes in transmission or contact rates that can be equated across types by their effect on the reproductive number.
What would settle it
A real epidemic dataset in which the observed start times of comparable NPIs are recorded alongside both peak height and final attack rate; if later interventions reduce peaks as effectively as earlier ones while still cutting size, the timing claim fails.
Figures


read the original abstract
This study investigates the influence of different types of non-pharmaceutical interventions (NPIs) on epidemic progression using SIR compartmental models. We analyze the optimization of two distinct targets: the final epidemic size and the infection peak, particularly how they respond to variations in the initiation time of the NPIs. We derive analytical approximations for the critical points of the infection curve of the standard mean-field SIR model with NPIs, and for the epidemic size, enabling a systematic comparison. The analytical results reveal the existence of six different allowed scenarios for the evolution of the epidemic with a single NPI. Furthermore, by employing degree-based mean-field network models, we distinguish between NPIs that decrease the transmission rate (individual and environmental measures) and those that reduce social contacts (lock down measures). We find that, when assuming equal effects on the reproductive number, the former are more efficient in reducing the final epidemic size. Meanwhile, the effectivities of both types of NPIs differ in reducing primary and secondary peaks. The results for all models consistently confirm that minimizing the infection peak requires earlier implementation of the NPI than minimizing the epidemic size, offering new insights for strategic public health timing.
Editorial analysis
A structured set of objections, weighed in public.
Referee Report
Summary. The manuscript presents an analysis of non-pharmaceutical interventions (NPIs) in SIR epidemic models, focusing on the timing of interventions to optimize either the infection peak or the final epidemic size. Using analytical approximations derived from the SIR differential equations with step-function NPI terms, the authors identify six distinct scenarios for epidemic evolution. They extend the analysis to degree-based mean-field network models, distinguishing between NPIs that reduce transmission rates and those that reduce social contacts. The consistent finding across models is that minimizing the infection peak necessitates earlier NPI implementation compared to minimizing the epidemic size. Additionally, at equal effects on the reproductive number, transmission-rate reductions are more efficient for reducing final epidemic size.
Significance. The results, if validated, provide important insights into the strategic timing of public health interventions during epidemics. The analytical approach allows for a systematic understanding without heavy reliance on numerical simulations, and the differentiation between NPI types in network models adds nuance to how different measures (e.g., masks vs. lockdowns) might be deployed. The reproducibility through explicit approximations and cross-model consistency is a strength.
minor comments (2)
- [Abstract] The abstract mentions 'six different allowed scenarios' but does not briefly describe them; adding a short characterization would improve accessibility.
- [Network model results] The comparison of primary and secondary peaks in the network models could be supported by more detailed quantitative tables or additional plots to illustrate the differences in effectivity between NPI types.
Simulated Author's Rebuttal
We thank the referee for the positive and accurate summary of our manuscript, including the identification of six epidemic scenarios, the extension to network models, and the consistent finding that earlier NPI timing is needed to minimize the infection peak than to minimize final size. We also appreciate the note that transmission-rate reductions outperform contact reductions for epidemic size at equal reproductive-number impact. The recommendation for minor revision is noted.
Circularity Check
No significant circularity in analytical derivations from SIR equations
full rationale
The paper derives its central timing results (earlier NPI for peak minimization than for size minimization) directly from analytical approximations to the SIR differential equations with added instantaneous permanent step-function NPI terms, plus degree-based mean-field network extensions that separate transmission-rate versus contact-rate reductions at fixed R0. These steps enumerate six scenarios from the model trajectories and final-size equations without fitting parameters to data, without self-defining the outputs in terms of the inputs, and without load-bearing self-citations or imported uniqueness theorems. The conclusions are self-contained against the explicit model assumptions and do not reduce to renaming known results or smuggling ansatzes via citation.
Axiom & Free-Parameter Ledger
free parameters (2)
- NPI initiation time
- NPI strength (reduction in beta or contacts)
axioms (2)
- domain assumption Homogeneous mixing and mass-action incidence in the standard SIR model
- domain assumption Degree-based mean-field closure for heterogeneous networks
Reference graph
Works this paper leans on
-
[1]
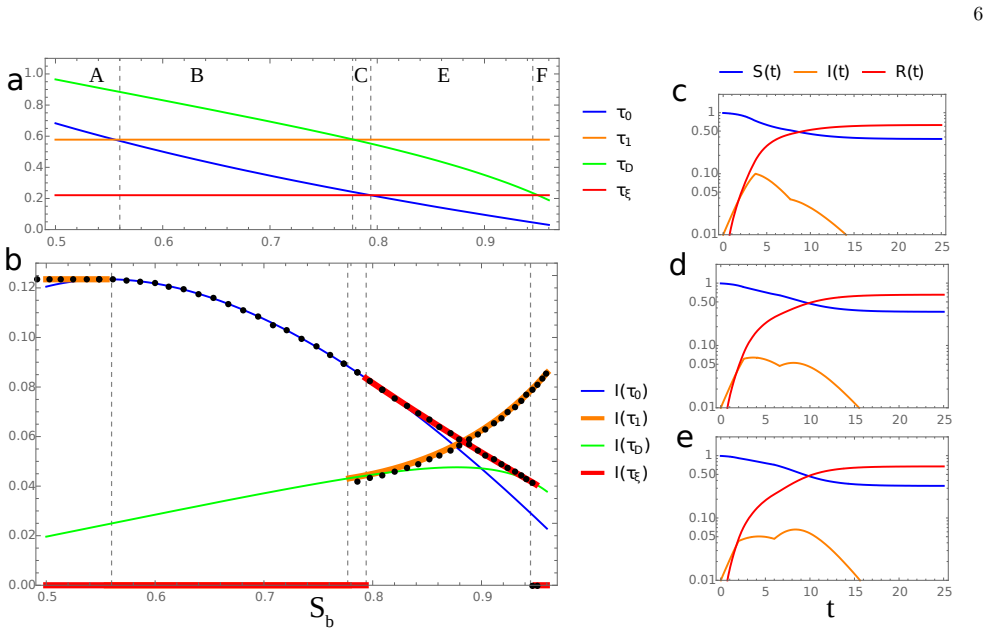
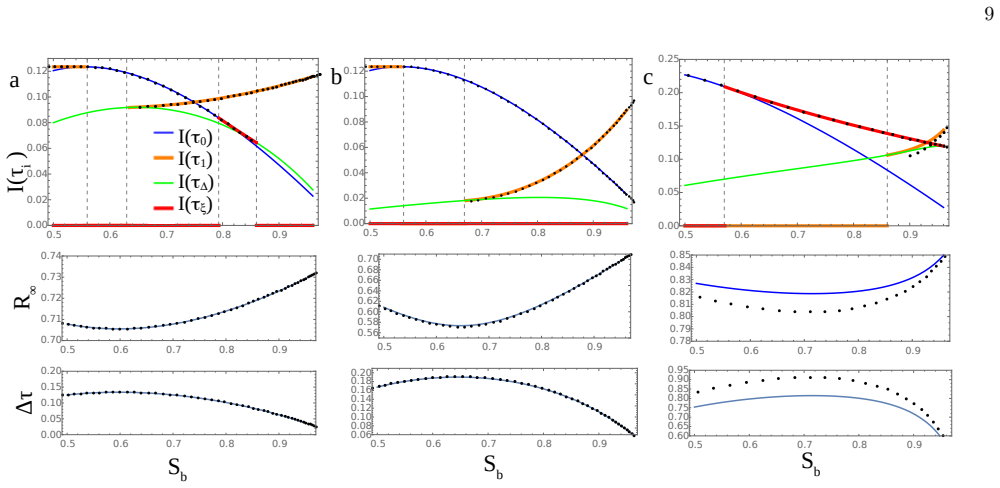
It is apparent that the solid line for the approximation in Eq
(see comment in [19]). It is apparent that the solid line for the approximation in Eq. (9) provides much better results than the Taylor approximation. Moreover, note that the solution from the Taylor expansion ceases to be valid forS b ≳0.89. This is because it becomes complex (i.e.with a non-vanishing imaginary part), as it results from a second order eq...
-
[2]
The network model allowed us to distinguish between two main types of NPIs
and [18]. The network model allowed us to distinguish between two main types of NPIs. On one hand, those that involve only individual and/or environmental measures that decrease the transmission rate (Case 1), and on the other hand, those that change the contact structure of the population, reducing the number of social contacts (Case 2). Our analysis sho...
-
[3]
O., McKendrick, A
Kermack, W. O., McKendrick, A. G. A contribution to the mathematical theory of epidemics.Proc. R. Soc. A,115, 700, 1927
1927
-
[4]
Hethcote, H. W. A thousand and one epidemic models.Frontiers in Mathematical Biology, Springer Berlin Heidelberg, 1994
1994
-
[5]
Sartwell, The distribution of incubation periods of infectious disease, Am
P. Sartwell, The distribution of incubation periods of infectious disease, Am. J. Epidemiol. 141 (1949) 386–394, http://dx.doi.org/10.1093/oxfordjournals.aje.a119397
-
[6]
H. Hethcote, H. Stech, P. Van Den Driessche, Periodicity and stability in epidemic models: A survey, differential equations and applications in ecology, in: Epidemics and Population Problems, Elsevier, 1981, http://dx.doi.org/10.1016/b978-0-12- 148360-9.50011-1
-
[7]
Keeling, P
M. Keeling, P. Rohani, Modeling Infectious Diseases in Humans and Animals, Princeton University Press, 2008
2008
-
[8]
doi.org/10.1016/s0025- 5564(96)00129-0
AnderssonH.Epidemicsinapopulationwithsocialstructures, MathBiosci, 1997Mar;140(2):79-84. doi.org/10.1016/s0025- 5564(96)00129-0
-
[9]
R. Pastor-Satorras, C. Castellano, P. Van Mieghem and A. Vespignani, Epidemic processes in complex networks, Rev.Mod.Phys87925 (2015), doi/10.1103/RevModPhys.87.925
-
[10]
L. Bolzoni 1 and R. Della Marca, On the Optimal Vaccination Control of SIR Model with Erlang-Distributed Infectious Period, Journal of Optimization Theory and Applications (2025) 205:39, https://doi.org/10.1007/s10957-025-02645-0
-
[11]
Rozan, M.N
E.A. Rozan, M.N. Kuperman and S. Bouzat, The importance of the incubation time distribution in compartmental epidemiological models, Physica A 650 (2024) 129998
2024
-
[12]
Perra, Non-pharmaceutical interventions during the COVID-19 pandemic: A review
N. Perra, Non-pharmaceutical interventions during the COVID-19 pandemic: A review. Phys Rep. 2021, doi: 10.1016/j.physrep.2021.02.001
-
[13]
X. Yan, Y. Zou, and J. Li, Optimal quarantine and isolation strategies in epidemics control, World Journal of Modelling and Simulation3, 202 (2007)
2007
-
[14]
E. Atias and M. Assaf, Optimal reduction of an epidemic outbreak size via temporary quarantine Phys. Rev. E111034305 (2025). DOI: 10.1103/PhysRevE.111.034305
-
[15]
doi.org/10.1016/j.physa.2023.129330
Rozán, E.A., Bouzat, S., and Kuperman, M.N, Testing lockdown measures in epidemic outbreaks through mean-field models considering the social structure, Physica A: Statistical Mechanics and its Applications, 632, 129330 (2023). doi.org/10.1016/j.physa.2023.129330
-
[16]
Meidan, N
D. Meidan, N. Schulmann, R. Cohen, S. Haber, E. Yaniv, R. Sarid, and B. Barzel, Alternating quarantine for sus- tainable epidemic mitigation, Nature communications12, 220 (2021)
2021
-
[17]
E., Frank, G
Cornes, F. E., Frank, G. A., Dorso, C. O. COVID-19 spreading under containment actions.PhysicaA:StatisticalMechanics and its Applications,588, 126566, 2022. 16
2022
-
[18]
Hindes, S
J. Hindes, S. Bianco, and I. B. Schwartz, Optimal periodic closure for minimizing risk in emerging disease out- breaks, PLoS One16, e0244706 (2021)
2021
-
[19]
Y. Moreno, R. Pastor-Satorras, A. Vespignani, Epidemic outbreaks in complex heterogeneous networks, The European Physical Journal B - Condensed Matter and Complex Systems (2002).doi:10.1140/epjb/e20020122
-
[20]
Neipel, J
J. Neipel, J. Bauermann, S. Bo, T. Harmon, and F. Jülicher, Power-law population heterogeneity governs epidemic waves, PloS one15, e0239678 (2020)
2020
-
[21]
2.b correspond exactly to the approximation used in [12]
Although we followed the procedure indicated by the authors, we cannot ensure that our results in dashed lines in Fig. 2.b correspond exactly to the approximation used in [12]. In such work, the authors did not show explicitly the formula obtained, but only indicate they used it to find Eq.(12)
-
[22]
M. Barthélemy, A. Barrat, R. Pastor-Satorras, A. Vespignani, Velocity and Hierarchical Spread of Epidemic Outbreaks in Scale-Free Networks, Phys. Rev. Lett. 92, 178701 (2004). doi:10.1103/PhysRevLett.92.178701
-
[23]
Custom program in Python for solving Eqs.(13)
DATA AVAILABILITY (editorial action required). Custom program in Python for solving Eqs.(13)
-
[24]
doi.org/10.48550/arXiv.2510.12614
Rozán, E.A., Simoy, M.I., Bouzat, S., and Kuperman, M.N, Modeling Epidemics on Multiplex Networks: Epidemic Threshold and Basic Reproduction Number , arXiv:2510.12614 (2025). doi.org/10.48550/arXiv.2510.12614
-
[25]
Svoboda, J., Tkadlec, J., Pavlogiannis, A. et al. Infection dynamics of COVID-19 virus under lockdown and reopening, Sci Rep 12, 1526 (2022). doi.org/10.1038/s41598-022-05333-5
discussion (0)
Sign in with ORCID, Apple, or X to comment. Anyone can read and Pith papers without signing in.