Recognition: unknown
The Geoeconomics of Venture Capital An Economic Complexity Approach to Emerging Technological Sovereignty
Pith reviewed 2026-05-10 16:30 UTC · model grok-4.3
The pith
Venture capital portfolios reveal that the United States and Israel lead in emerging technological sovereignty when measured by economic complexity methods.
A machine-rendered reading of the paper's core claim, the machinery that carries it, and where it could break.
Core claim
Using a probabilistic multi-label LLM classifier to assign venture-backed startups to 18 emerging technology domains, the authors construct an RVA matrix for the 17 countries with highest aggregate VC funding. Eigenvector-based methods then produce a Geoeconomic Complexity Index (GCI) that places the United States and Israel at the top due to their high-diversity, low-ubiquity positions, with China, France, Japan, and Germany following; an Emerging Technology Geoeconomic Complexity Index (ETGCI) shows Cloud Computing, Cybersecurity Tools, and Medtech as the domains most concentrated among high-GCI countries. Both rankings remain stable from 2021 to 2024. Relatedness simulations identify the,
What carries the argument
The Revealed Venture Advantage (RVA) matrix of national venture specializations in 18 technology domains, from which eigenvector centrality yields the Geoeconomic Complexity Index (GCI) for countries and the Emerging Technology Geoeconomic Complexity Index (ETGCI) for domains.
If this is right
- The United States and Israel retain leading geoeconomic positions because their VC portfolios exhibit the combination of diversity and rarity that complexity measures reward.
- Domains such as Cloud Computing, Cybersecurity Tools, and Medtech carry the highest ETGCI values because specialization in them is concentrated among the highest-GCI countries.
- Relatedness-based simulations can identify, for any given country, the single new technology direction expected to produce the largest gain in relative GCI.
- Both country and domain rankings show stability across the 2021-2024 window, suggesting the underlying structure of VC specialization changes slowly.
Where Pith is reading between the lines
- The same RVA-plus-complexity pipeline could be applied to other capital flows such as government grants or corporate R&D spending to test whether VC data alone captures the full picture of technological sovereignty.
- Middle-ranked countries could treat the SSSET simulation as a shortlist for targeted policy experiments rather than broad industrial strategies.
- If the classifier remains accurate on new data, yearly updates of the indices would provide an early-warning system for shifts in geoeconomic positioning before they appear in patent or trade statistics.
Load-bearing premise
The large-language-model classifier maps startups to the 18 technology domains with enough accuracy that misclassifications or biases do not materially alter the RVA matrix or the resulting country and domain rankings.
What would settle it
A manual re-labeling of a representative sample of startups that produces a materially different RVA matrix and changes the identity of the top three countries in the GCI ranking.
Figures

read the original abstract
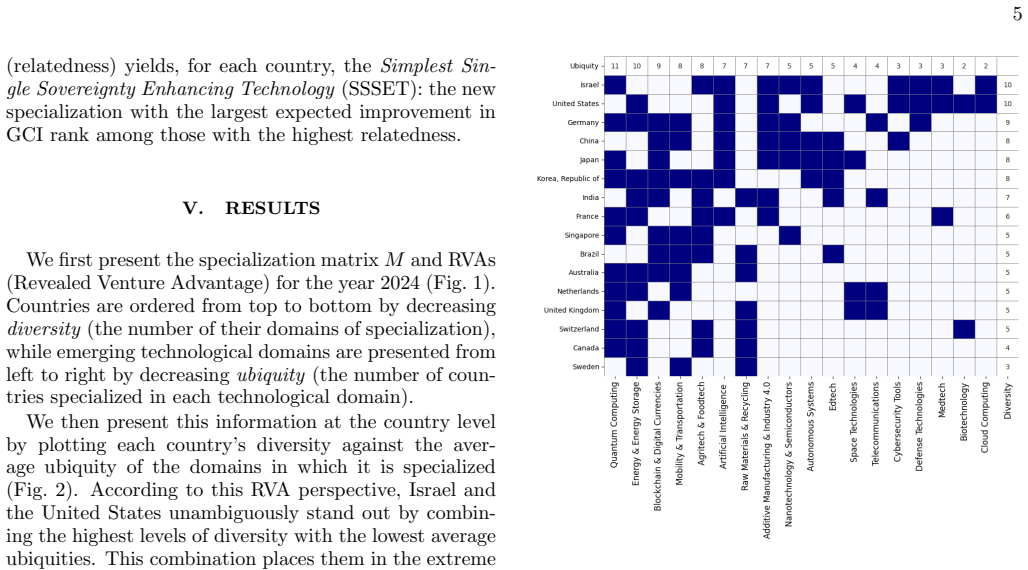
We explore a quantitative approach to emerging technological sovereignty and geoeconomic power by assessing the relative positioning of countries with economic complexity methods applied to the structure of national venture-capital (VC) portfolios and their associated Revealed Venture Advantage (RVA) metrics. Using Crunchbase firm- and deal-level data, we map venture-backed startups to 18 emerging technology domains via a probabilistic multi-label large-language-model classifier, and construct an RVA-based country-technology specialization matrix for the 17 countries with the highest aggregate VC funding. From this matrix, we derive two eigenvector-based measures: a Geoeconomic Complexity Index (GCI) that ranks countries by the composition of their venture specializations, and an Emerging Technology Geoeconomic Complexity Index (ETGCI) that ranks domains by the extent to which specialization is concentrated among high-GCI countries. Empirically, Cloud Computing, Cybersecurity Tools, and Medtech exhibit the highest ETGCI values, reflecting concentration of specialization in a small set of leading countries. The United States and Israel consistently occupy a marked "high-diversity/low-ubiquity" position and lead the GCI ranking, followed by China, France, Japan, and Germany; both country and domain rankings are stable from 2021-2024. Finally, relatedness-based simulations identify, when it exists, for each country the Simplest Single Sovereignty Enhancing Technology (SSSET), i.e., the most feasible single new technological direction associated with the largest expected improvement in relative geoeconomic positioning.
Editorial analysis
A structured set of objections, weighed in public.
Referee Report
Summary. The paper applies economic complexity methods to venture capital portfolios to quantify emerging technological sovereignty. Using Crunchbase deal data for the 17 highest-VC countries, it employs a probabilistic multi-label LLM classifier to assign startups to 18 emerging technology domains, constructs a Revealed Venture Advantage (RVA) country-technology matrix, and derives two eigenvector-based indices: the Geoeconomic Complexity Index (GCI) ranking countries by specialization diversity and the Emerging Technology Geoeconomic Complexity Index (ETGCI) ranking domains by concentration among high-GCI countries. Empirical results identify the US and Israel as GCI leaders with high-diversity/low-ubiquity profiles, Cloud Computing, Cybersecurity Tools, and Medtech as highest-ETGCI domains, ranking stability over 2021-2024, and relatedness-based simulations for each country's Simplest Single Sovereignty Enhancing Technology (SSSET).
Significance. If the core data construction holds, the work provides a novel, quantitative extension of economic complexity techniques to VC specialization patterns, offering measurable indicators of geoeconomic positioning in emerging technologies. The specific rankings, temporal stability, and SSSET simulations supply falsifiable, policy-relevant outputs that could guide assessments of technological sovereignty; the framework's strength lies in its data-driven, matrix-based approach rather than ad-hoc metrics.
major comments (3)
- [Methods (LLM classifier and RVA matrix construction)] Methods section describing the probabilistic multi-label LLM classifier: no validation metrics (precision, recall, F1, or human-coded ground truth), robustness checks against alternative models, or error analysis are reported. This step directly populates the RVA matrix whose row/column sums and eigenvectors produce GCI and ETGCI; systematic misclassification correlated with country or domain would bias the reported US/Israel lead, ETGCI concentration in Cloud/Cyber/Medtech, and all downstream claims.
- [Results (GCI and ETGCI rankings)] Results section on GCI/ETGCI computation and stability: the exact eigenvector formulation, normalization, convergence criteria, and sensitivity to the choice of 17 countries/18 domains are not fully specified. The claim of stability from 2021-2024 therefore cannot be evaluated for robustness to matrix perturbations or alternative centrality measures.
- [Simulation of SSSET] Simulation section defining SSSET: the operationalization of 'simplest' (e.g., relatedness threshold) and 'largest expected improvement in relative geoeconomic positioning' lacks a formal equation or sensitivity analysis. Without this, the policy-oriented output cannot be reproduced or stress-tested against changes in the underlying RVA matrix.
minor comments (2)
- [Introduction] The abstract and introduction should explicitly cite the foundational economic complexity literature (e.g., Hidalgo et al. on eigenvector centrality and revealed comparative advantage) to clarify how GCI/ETGCI adapt rather than reinvent those methods.
- [Methods] Notation for RVA and the country-technology matrix should be standardized with a clear equation early in the methods; current presentation risks ambiguity when readers reconstruct the indices.
Simulated Author's Rebuttal
We thank the referee for their constructive and detailed comments, which highlight important areas for improving the transparency and robustness of our analysis. We address each major comment below and commit to revisions that directly respond to the concerns raised.
read point-by-point responses
-
Referee: Methods section describing the probabilistic multi-label LLM classifier: no validation metrics (precision, recall, F1, or human-coded ground truth), robustness checks against alternative models, or error analysis are reported. This step directly populates the RVA matrix whose row/column sums and eigenvectors produce GCI and ETGCI; systematic misclassification correlated with country or domain would bias the reported US/Israel lead, ETGCI concentration in Cloud/Cyber/Medtech, and all downstream claims.
Authors: We agree that the absence of reported validation metrics represents a gap in the current manuscript. In the revised version, we will add a new subsection in the Methods that reports precision, recall, and F1 scores on a human-coded ground-truth sample of startup descriptions, along with robustness checks using alternative classification approaches (e.g., different LLMs or supervised baselines) and a brief error analysis stratified by country and domain. These additions will allow readers to evaluate potential biases in the RVA matrix construction. revision: yes
-
Referee: Results section on GCI/ETGCI computation and stability: the exact eigenvector formulation, normalization, convergence criteria, and sensitivity to the choice of 17 countries/18 domains are not fully specified. The claim of stability from 2021-2024 therefore cannot be evaluated for robustness to matrix perturbations or alternative centrality measures.
Authors: We accept that the current text does not provide a fully explicit mathematical specification. We will expand the Methods and Results sections to include the precise eigenvector equations for both GCI and ETGCI, the normalization procedure, convergence criteria, and the exact matrix construction steps. We will also add sensitivity tables showing how rankings change under alternative country/domain selections and centrality measures, thereby supporting the reported temporal stability. revision: yes
-
Referee: Simulation section defining SSSET: the operationalization of 'simplest' (e.g., relatedness threshold) and 'largest expected improvement in relative geoeconomic positioning' lacks a formal equation or sensitivity analysis. Without this, the policy-oriented output cannot be reproduced or stress-tested against changes in the underlying RVA matrix.
Authors: We acknowledge that the SSSET procedure is currently described at a high level without a formal equation. In revision, we will insert the exact mathematical definition, including the relatedness threshold rule and the formula used to compute expected improvement in relative positioning. We will further report sensitivity checks that vary the RVA matrix entries and key parameters to demonstrate robustness of the simulated recommendations. revision: yes
Circularity Check
No significant circularity; GCI/ETGCI are standard eigenvector derivations from external RVA matrix
full rationale
The derivation begins with Crunchbase deal data, applies an external probabilistic LLM classifier to assign startups to 18 domains, forms the RVA country-technology matrix, and then computes eigenvector-based GCI (ranking countries by specialization composition) and ETGCI (ranking domains by concentration among high-GCI countries). No quoted equations or text show self-definition (e.g., GCI defined in terms of ETGCI and vice versa), fitted parameters renamed as predictions, or load-bearing self-citations that reduce the central result to unverified prior claims by the same authors. The eigenvector step follows established economic complexity methods without reducing to the input data by construction. The LLM mapping is a methodological input assumption whose accuracy is separate from circularity. Relatedness simulations for SSSET are downstream and not self-referential. The chain is self-contained against external benchmarks.
Axiom & Free-Parameter Ledger
free parameters (2)
- Number of technology domains =
18
- Number of countries analyzed =
17
axioms (2)
- domain assumption Revealed Venture Advantage (RVA) metrics correctly reflect underlying technological capabilities and specialization
- domain assumption Eigenvector centrality on the RVA matrix yields a meaningful Geoeconomic Complexity Index
invented entities (3)
-
Geoeconomic Complexity Index (GCI)
no independent evidence
-
Emerging Technology Geoeconomic Complexity Index (ETGCI)
no independent evidence
-
Simplest Single Sovereignty Enhancing Technology (SSSET)
no independent evidence
Reference graph
Works this paper leans on
-
[1]
high-diversity / low-ubiquity
and to RTA (Revealed Technological Advantage) for patents [29]: M t ij = 1, St ijP i St ij ≥ P j St ijP i,j St ij , 0,otherwise. (3) I.e., countryiis specialized in technological domainj in yeartif and only ifM t ij = 1. RVAs and the asso- ciated country–technology matrixM t therefore capture the favored technological directions of venture-backed ...
2024
-
[2]
Albeaik, S., Kaltenberg, M., Alsaleh, M., & Hidalgo, C. A. (2017). Improving the economic complexity index. arXiv.org
2017
-
[3]
Balland, P., Broekel, T., Diodato, D., Giuliani, E., Hausmann, R., O’Clery, N., & Rigby, D. (2021). The new paradigm of economic complexity. Research Policy, 51(3), 104450
2021
-
[4]
C., Chisadza, C., & Clance, M
Breitenbach, M. C., Chisadza, C., & Clance, M. (2022). The Economic Complexity Index (ECI) and output volatility: High vs. low income countries. The Journal of International Trade & Economic Development, 31(4), 566-580
2022
-
[5]
sovereignty
Couture, S., & Toupin, S. (2019). What does the notion of “sovereignty” mean when referring to the digital? New Media & Society, 21(10), 2305–2322
2019
-
[6]
M., den Besten, M., & Menon, C
Dalle, J. M., den Besten, M., & Menon, C. (2017). Using Crunchbase for economic and managerial research. OECD Science, Technology and Industry Working Papers
2017
-
[7]
Di Girolamo, V., Mitra, A., Ravet, J., Peiffer-Smadja, O., Balland, P.-A. (2023). The global position of the EU in complex technologies, Research and innovation paper series, No. 2023/03, ISBN 978-92-68-03850-5, Publications Office of the European Union, Luxembourg
2023
-
[8]
Edler, J., Blind, K., Kroll, H., & Schubert, T. (2023). Technology sovereignty as an emerging frame for innovation policy. Defining rationales, ends and means. Research Policy, 52(6), 104765
2023
-
[9]
& Egmont: Royal Institute for International Relations
Gehrke, T. & Egmont: Royal Institute for International Relations. (2022). EU open strategic autonomy and the trappings of geoeconomics. In European Foreign Affairs Review (Vols. 27–Special Issue, pp. 61–78). Kluwer Law International BV, The Netherlands
2022
-
[10]
Gu, H. (2023). Data, big tech, and the new concept of sovereignty. Journal of Chinese Political Science
2023
-
[11]
A., Bustos, S., Coscia, M., Simoes, A., & Yildirim, M
Hausmann, R., Hidalgo, C. A., Bustos, S., Coscia, M., Simoes, A., & Yildirim, M. A. (2014). The Atlas of Economic Complexity. In The MIT Press eBooks
2014
-
[12]
J., Razavi, R., Hodgman, M., Weaver, J., Lehdonvirta, V., and Page, M
Hawkins, Z. J., Razavi, R., Hodgman, M., Weaver, J., Lehdonvirta, V., and Page, M. (2025). From AI Sovereignty to AI Agency – Measuring Capability, Agency & Power: A Practical Tool for Policymakers, Tech Policy Design Institute
2025
-
[13]
A., Klinger, B., Barab´ asi, A., & Hausmann, R
Hidalgo, C. A., Klinger, B., Barab´ asi, A., & Hausmann, R. (2007). The product space conditions the development of nations. Science, 317(5837), 482–487
2007
-
[14]
A., & Hausmann, R
Hidalgo, C. A., & Hausmann, R. (2009). The building blocks of economic complexity. Proceedings of the National Academy of Sciences, 106(26), 10570–10575
2009
-
[15]
Hidalgo, C. A. (2021). Economic complexity theory and applications. Nature Reviews Physics, 3(2), 92–113
2021
-
[16]
Hidalgo, C. A. (2023). The policy implications of economic complexity. Research Policy, 52(9), 104863
2023
-
[17]
Inoua, S. (2023). A simple measure of economic complexity. Research Policy, 52(7), 104793
2023
- [18]
-
[19]
Lehdonvirta, V., Wu, B., and Hawkins, Z. (2025). Weaponized interdependence in a bipolar world: How economic forces and security interests shape the global reach of U.S. and Chinese cloud data centres. Review of International Political Economy, 32:5, 1442-1467
2025
-
[20]
March, C., & Schieferdecker, I. (2023). Technological Sovereignty as Ability, Not Autarky. International Studies Review, 25(2)
2023
-
[21]
D., & Teytelboym, A
Mealy, P., Farmer, J. D., & Teytelboym, A. (2017). Interpreting economic complexity. arXiv (Cornell University)
2017
-
[22]
& Agarwal, R
Moen, M. & Agarwal, R. (2017). Incubation of an industry: Heterogeneous knowledge bases and modes of value capture. Strategic Management Journal 38(3):566–587
2017
-
[23]
Mohr, C., & Trebesch, C. (2025). Geoeconomics. Annual Review of Economics, 17
2025
-
[24]
L., Balland, P
Pinheiro, F. L., Balland, P. A., Boschma, R., & Hartmann, D. (2025). The dark side of the geography of innovation: relatedness, complexity and regional inequality in Europe. Regional Studies, 59(1), 2106362
2025
-
[25]
Publications Office of the European Union. (2023). The European Innovation Council tech report 2023. Publications Office of the EU
2023
-
[26]
Publications Office of the European Union. (2025). The European Innovation Council tech report 2024. Publications Office of the EU
2025
-
[27]
Puglierin, A., & Zerka, P. (2022). European Sovereignty Index. Facts that matter. European Council of Foreign Relations
2022
-
[28]
(2025, Sep 4)
Rorysaitch. (2025, Sep 4). Helping government to understand the technologies of the future. UK Government Office for Science
2025
-
[29]
(2020, July 3)
Sciarra, C., Chiarotti, G., Ridolfi, L., & Laio, F. (2020, July 3). Reconciling contrasting views on economic complexity. Nature News
2020
-
[30]
Soete, L. (1987). The impact of technological innovation on international trade patterns: The evidence reconsidered. Research Policy, 16(2–4), 101–130
1987
-
[31]
Stojkoski, V., & Hidalgo, C. A. (2025). Optimizing economic complexity. arXiv.org
2025
-
[32]
Sovereignty through effective startup and scaleup policy. (2024). In Visions for the EU Mandate 2024 - 2029
2024
-
[33]
The Draghi report on EU competitiveness. (n.d.). European Commission
-
[34]
Valverde-Carbonell, J. (2025). Rethinking the literature on economic complexity indexes. Economic Analysis and Policy, 87, 123–145
2025
discussion (0)
Sign in with ORCID, Apple, or X to comment. Anyone can read and Pith papers without signing in.