Recognition: no theorem link
JFR-rg: A New Macroeconomic Framework for High-Debt, Low-Growth Economies under Financial Repression
Pith reviewed 2026-05-13 23:57 UTC · model grok-4.3
The pith
The JFR-rg model shows that a financial repression bias can stabilize debt ratios in high-debt, low-growth economies like Japan.
A machine-rendered reading of the paper's core claim, the machinery that carries it, and where it could break.
Core claim
The JFR-rg model formalizes debt dynamics under financial repression by incorporating the bias epsilon_t equal to inflation minus nominal rates and non-linear exchange effects. It characterizes stability via the Debt Sustainability Corridor in (epsilon_t, g^n*_t) space, establishes the Normalization Ratchet as a theorem on persistent debt increases from temporary errors, and endogenizes preconditions through the Captive Financial System Parameter phi_t. Simulations demonstrate that aggressive rate hikes lead to worse debt outcomes in a Normalization Trap.
What carries the argument
The Captive Financial System Parameter (phi_t), which endogenizes the institutional precondition for stability in the JFR-rg framework.
Load-bearing premise
The captive financial system condition remains in place, enabling the government to suppress rates through domestic institutions.
What would settle it
Empirical observation of rising debt-to-GDP ratios in Japan following a period where nominal rates exceed inflation would contradict the model's stability predictions.
Figures


read the original abstract
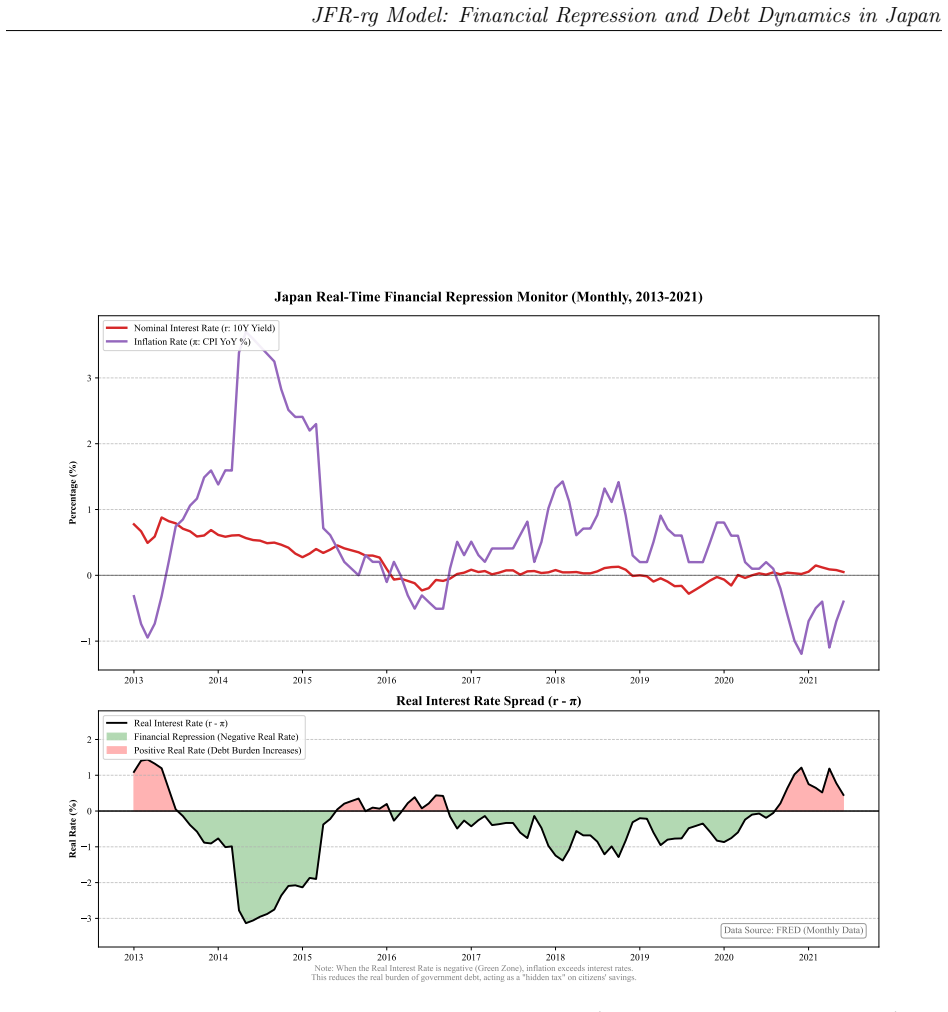
Standard macroeconomic frameworks have correctly identified Japan's government debt - now exceeding 240% of GDP - as carrying substantial fiscal risk. Yet FRED data from 2013 to 2026 present an empirical record inviting a complementary perspective: debt ratios have stabilized, nominal GDP has exceeded 670 trillion yen (SAAR), and unemployment has remained near 2.6-2.7%. This paper formalizes these channels through the Japanese Financial Repression r-g (JFR-rg) model. Building on Blanchard (2019), the framework incorporates a financial repression bias (epsilon_t = pi_t - r^n_t, directly observable from FRED) and a non-linear exchange-rate channel. Three theoretical contributions extend the literature: (i) the Debt Sustainability Corridor, a characterization of stability in (epsilon_t, g^n*_t) space; (ii) the Normalization Ratchet, a path-dependence theorem showing that temporary policy errors generate persistently higher debt trajectories; and (iii) the Captive Financial System Parameter (phi_t), which endogenizes the institutional precondition for JFR-rg stability. Appendices H-L provide supporting empirical evidence (VAR, ARDL, Local Projections) showing the framework's claims are empirically disciplined and falsifiable. The core debt-dynamics propositions are anchored in the consolidated government budget identity (Layer L1), while selected propositions additionally rely on minimal structural assumptions; identification concerns apply only to the empirical Layer L2. Counterfactual simulations illustrate a Normalization Trap: aggressive rate hikes can produce counterproductive debt dynamics. For high-debt, low-growth economies sharing Japan's institutional characteristics, strategically deploying the resulting Repression Dividend into productivity-enhancing investment may represent a regime-contingent equilibrium possibility, conditional on the captive system condition being maintained.
Editorial analysis
A structured set of objections, weighed in public.
Referee Report
Summary. The manuscript proposes the JFR-rg framework for high-debt, low-growth economies under financial repression, using Japan as the motivating case. Building on Blanchard (2019), it incorporates an observable financial repression bias ε_t = π_t - r^n_t and a non-linear exchange-rate channel. Core debt dynamics are anchored in the consolidated government budget identity (Layer L1). Three extensions are claimed: the Debt Sustainability Corridor in (ε_t, g^n*_t) space, the Normalization Ratchet path-dependence theorem, and the Captive Financial System Parameter φ_t that endogenizes institutional preconditions. Empirical support via VAR, ARDL, and Local Projections appears in appendices H-L (Layer L2), with counterfactual simulations illustrating a Normalization Trap.
Significance. If the central claims hold, the paper supplies a regime-contingent lens on debt stabilization that complements standard r-g analysis and generates falsifiable predictions for similar economies. The explicit use of FRED-observable ε_t and the policy counterfactuals on repression dividends are strengths that could inform applied work on high-debt settings conditional on captive financial systems.
major comments (2)
- [Normalization Ratchet theorem] Normalization Ratchet theorem (abstract and Layer L1 derivation): the claimed hysteresis—that temporary policy errors produce persistently higher debt trajectories—appears to rest on φ_t remaining fixed. Because contribution (iii) presents φ_t as endogenous, an offsetting adjustment in φ_t following a rate hike could restore the original trajectory and eliminate the ratchet. The derivation must show whether the result survives endogenous φ_t or requires φ_t to be treated as exogenous.
- [Appendices H-L] Appendices H-L, Layer L2: identification in the VAR, ARDL, and Local Projections is flagged as carrying concerns. Without explicit discussion of how the non-linear exchange-rate channel and φ_t are identified separately from the budget-identity residuals, the empirical discipline claimed for the theoretical extensions is difficult to assess.
minor comments (2)
- [Abstract] The abstract refers to 'minimal structural assumptions' for selected propositions; a short table or paragraph listing exactly which propositions rely on these assumptions versus the pure budget identity would improve transparency.
- [Notation] Notation for ε_t and g^n*_t should be introduced with an explicit equation reference in the main text before the corridor is characterized.
Simulated Author's Rebuttal
We thank the referee for the constructive and insightful comments on the manuscript. We address each major comment below, clarifying the assumptions underlying the theoretical results and committing to revisions that strengthen the empirical identification discussion.
read point-by-point responses
-
Referee: [Normalization Ratchet theorem] Normalization Ratchet theorem (abstract and Layer L1 derivation): the claimed hysteresis—that temporary policy errors produce persistently higher debt trajectories—appears to rest on φ_t remaining fixed. Because contribution (iii) presents φ_t as endogenous, an offsetting adjustment in φ_t following a rate hike could restore the original trajectory and eliminate the ratchet. The derivation must show whether the result survives endogenous φ_t or requires φ_t to be treated as exogenous.
Authors: The Normalization Ratchet theorem is derived in Layer L1 under the maintained assumption that φ_t is predetermined over the relevant policy horizon, consistent with the institutional inertia of captive financial systems. While contribution (iii) endogenizes φ_t to capture longer-run institutional change, the theorem focuses on short-run dynamics where φ_t does not adjust instantaneously. We will revise the manuscript to make this timing distinction explicit and add a short extension demonstrating that the ratchet result continues to hold when φ_t adjusts with a lag. This preserves the core contribution while directly addressing the referee's concern. revision: partial
-
Referee: [Appendices H-L] Appendices H-L, Layer L2: identification in the VAR, ARDL, and Local Projections is flagged as carrying concerns. Without explicit discussion of how the non-linear exchange-rate channel and φ_t are identified separately from the budget-identity residuals, the empirical discipline claimed for the theoretical extensions is difficult to assess.
Authors: We agree that the identification strategy requires clearer exposition. In the revised manuscript we will expand the discussion in Appendices H-L to detail how the non-linear exchange-rate channel is identified via external instruments and how φ_t is proxied using institutional variables that are orthogonal to the consolidated budget residuals. This will make explicit the separation between the empirical layers and the theoretical claims. revision: yes
Circularity Check
No significant circularity; core claims anchored in standard budget identity
full rationale
The paper explicitly grounds its central debt-dynamics propositions in the consolidated government budget identity (Layer L1), a standard accounting relation that does not depend on the model's novel constructs such as phi_t or the Normalization Ratchet. These extensions are presented as theoretical additions relying on minimal structural assumptions rather than fitted parameters renamed as predictions or self-referential definitions. No equations or theorems are shown reducing by construction to the paper's own inputs, and the empirical appendices are described as providing falsifiable evidence. Self-citations, if any, are not load-bearing for the primary claims, leaving the derivation self-contained against external benchmarks.
Axiom & Free-Parameter Ledger
free parameters (1)
- phi_t
axioms (1)
- standard math Consolidated government budget identity (Layer L1)
invented entities (3)
-
Debt Sustainability Corridor
no independent evidence
-
Normalization Ratchet
no independent evidence
-
Captive Financial System Parameter (phi_t)
no independent evidence
Forward citations
Cited by 1 Pith paper
-
JFR-rg Part II: Dynamic Extensions, Time Constraints, and Investment Design in High-Debt, Low-Growth Economies
The JFR-rg regime logic is extended in closed form through six mechanisms and a minimal equilibrium closure that endogenizes sovereign risk premiums via domestic demand complementarity in high-debt economies.
Reference graph
Works this paper leans on
-
[1]
Andrews, D. W. K. (1993). Tests for Parameter Instability and Structural Change with Unknown Change Point.Econometrica, 61(4), 821–856
work page 1993
-
[2]
Bai, J., & Perron, P. (1998). Estimating and Testing Linear Models with Multiple Structural Changes.Econometrica, 66(1), 47–78
work page 1998
-
[3]
Bernanke, B. S., & Reinhart, V. R. (2004). Conducting Monetary Policy at Very Low Short-Term Interest Rates.American Economic Review, 94(2), 85–90
work page 2004
-
[4]
Blanchard, O. (2019). Public Debt and Low Interest Rates.American Economic Review, 109(4), 1197–1229
work page 2019
-
[5]
Bank of Japan. (2024a, March 19). Changes in the Monetary Policy Framework. Bank of Japan. Retrieved from https://www.boj.or.jp/en/mopo/mpmdeci/mpr_2024/k240319a.pdf
-
[6]
Bank of Japan. (2024b, December 19). Statement on Monetary Policy. Bank of Japan. Retrieved fromhttps://www.boj.or.jp/en/mopo/mpmdeci/mpr_2024/k241219a.pdf
-
[7]
Calvo, G. A. (1998). Capital Flows and Capital-Market Crises: The Simple Economics of Sudden Stops.Journal of Applied Economics, 1(1), 35–54
work page 1998
-
[8]
(2025).Annual Report on the Japanese Economy and Public Finance 2025
Cabinet Office, Government of Japan. (2025).Annual Report on the Japanese Economy and Public Finance 2025. Tokyo: Cabinet Office. Retrieved from https://www5.cao.go.jp/keizai3/whitepaper-e.html
work page 2025
-
[9]
Eggertsson, G. B., & Krugman, P. (2012). Debt, deleveraging, and the liquidity trap: A Fisher-Minsky-Koo approach.Quarterly Journal of Economics, 127(3), 1469–1513
work page 2012
-
[10]
Federal Reserve Bank of St. Louis. (2026). Federal Reserve Economic Data (FRED). Series: JPNNGDP, JPNRGDPEXP, DEXJPUS, JPNCPIALLMINMEI, IRLTLT01JPM156N, IRSTCI01JPM156N, GGGDTAJPA188N, LRHUTTTTJPM156S. Retrieved March 2026 fromhttps://fred.stlouisfed.org
work page 2026
-
[11]
Haba, S., Izawa, K., Kishaba, Y., Takahashi, Y., & Yoneyama, S. (2025). Measuring Policy Effects since the Introduction of Quantitative and Qualitative Monetary Easing (QQE): An Analysis Using the Macroeconomic Model Q-JEM.Bank of Japan Working Paper Series, No. 25-E-2. Bank of Japan. Retrieved from https://www.boj.or.jp/en/research/wps_rev/wps_2025/wp25e02.htm
work page 2025
-
[12]
Hansen, B. E. (1999). Threshold effects in non-dynamic panels: Estimation, testing, and inference.Journal of Econometrics, 93(2), 345–368
work page 1999
-
[13]
Holston, K., Laubach, T., & Williams, J. C. (2017). Measuring the natural rate of interest: International trends and determinants.Journal of International Economics, 108(S1), S59–S75. 64 JFR-rg Model: Financial Repression and Debt Dynamics in Japan
work page 2017
-
[14]
Hoshi, T., & Ito, T. (2014). Defying gravity: Can Japanese sovereign debt continue to increase without a crisis?Economic Policy, 29(77), 5–44
work page 2014
-
[15]
International Monetary Fund. (2024a). Japan: 2024 Article IV Consultation-Press Release; Staff Report; and Statement by the Executive Director for Japan.IMF Country Report No. 24/118. Washington, D.C.: International Monetary Fund. Retrieved fromhttps: //www.imf.org/en/Publications/CR/Issues/2024/05/13/Japan-2024-Article-I V-Consultation-Press-Release-Staf...
work page 2024
-
[16]
International Monetary Fund. (2024b). Japan: Selected Issues.IMF Country Report No. 24/119. Washington, D.C.: International Monetary Fund. Retrieved from https://www.imf.org/en/Publications/CR/Issues/2024/05/13/Japan-Selecte d-Issues-548849
work page 2024
-
[17]
Jordà, Ò. (2005). Estimation and Inference of Impulse Responses by Local Projections. American Economic Review, 95(1), 161–182
work page 2005
-
[18]
Joyce, M., Lasaosa, A., Stevens, I., & Tong, M. (2011). The financial market impact of quantitative easing in the United Kingdom.International Journal of Central Banking, 7(3), 113–161
work page 2011
-
[19]
Koo, R. C. (2003).Balance Sheet Recession: Japan’s Struggle with Uncharted Economics and Its Global Implications. John Wiley & Sons
work page 2003
-
[20]
Koo, R. C. (2011). The world in balance sheet recession: causes, cure, and politics. real-world economics review, issue no. 58, 19–37. Retrieved from https://www.paecon.net/PAEReview/issue58/Koo58.pdf
work page 2011
-
[21]
Leeper, E. M. (1991). Equilibria under ‘active’ and ‘passive’ monetary and fiscal policies.Journal of Monetary Economics, 27(1), 129–147
work page 1991
-
[22]
McKinnon, R. I. (1973).Money and Capital in Economic Development. Brookings Institution
work page 1973
-
[23]
Mehrotra, N. R., & Sergeyev, D. (2021). Debt sustainability in a low interest rate world.Journal of Monetary Economics, 124(Supplement), S1–S18
work page 2021
-
[24]
Mikayama, M., Imahori, T., Ohno, T., Yoneta, Y., & Ueda, J. (2023). Top income shares in Japan from the survey and tax data in 2014 and 2019: Following the Distributional National Accounts Guidelines.Policy Research Institute (Ministry of Finance, Japan) Discussion Paper Series, No. 23A-04. Retrieved from https://www.mof.go.jp/pri/research/discussion_pape...
work page 2023
-
[25]
Mundell, R. A. (1963). Capital mobility and stabilization policy under fixed and flexible exchange rates.Canadian Journal of Economics and Political Science, 29(4), 475–485. 65 JFR-rg Model: Financial Repression and Debt Dynamics in Japan
work page 1963
-
[26]
Obstfeld, M., & Rogoff, K. (1995). Exchange rate dynamics redux.Journal of Political Economy, 103(3), 624–660
work page 1995
-
[27]
Pesaran, M. H., Shin, Y., & Smith, R. J. (2001). Bounds testing approaches to the analysis of level relationships.Journal of Applied Econometrics, 16(3), 289–326
work page 2001
-
[28]
Reinhart, C. M., & Sbrancia, M. B. (2015). The liquidation of government debt. Economic Policy, 30(82), 291–333
work page 2015
-
[29]
Sargent, T. J., & Wallace, N. (1981). Some unpleasant monetarist arithmetic.Federal Reserve Bank of Minneapolis Quarterly Review, 5(3), 1–17
work page 1981
-
[30]
Shaw, E. S. (1973).Financial Deepening in Economic Development. Oxford University Press
work page 1973
-
[31]
Sims, C. A. (1994). A simple model for study of the determination of the price level and the interaction of monetary and fiscal policy.Economic Theory, 4(3), 381–399
work page 1994
-
[32]
(2015).Between Debt and the Devil: Money, Credit, and Fixing Global Finance
Turner, A. (2015).Between Debt and the Devil: Money, Credit, and Fixing Global Finance. Princeton University Press
work page 2015
-
[33]
Woodford, M. (1994). Monetary policy and price level determinacy in a cash-in-advance economy.Economic Theory, 4(3), 345–380
work page 1994
-
[34]
Woodford, M. (1995). Price-level determinacy without control of a monetary aggregate.Carnegie-Rochester Conference Series on Public Policy, 43(1), 1–46. 66 JFR-rg Model: Financial Repression and Debt Dynamics in Japan A. Derivation of the JFR-rg Debt Dynamics and Stability Condition Step 1.The nominal government budget constraint: Bt = (1 +r n t )B t−1 +D...
work page 1995
-
[35]
This episode provides perhaps the clearest empirical illustration of the JFR-rg stabilizing channels in the sample, though alternative explanations—including global demand recovery and base effects—also contributed to the debt ratio decline. D. SAAR vs. Cabinet Office Aggregate: Reconciliation The SAAR series (FRED:JPNNGDP) and the Cabinet Office calendar...
work page 2025
-
[36]
The Normalization Trap (Proposition 4) is robust to the full range of literature-basedα estimates (Panel A) and isstructurally independentof(¯e, β)because the penalty term vanishes under yen appreciation (Panel D)
-
[37]
The near-miss character of Japan’s March 2026 operating point is robust: the 0.033 pp shortfall from strict stability is confirmed under both Panel B (εt perspective) and Panel C (growth perspective)
work page 2026
-
[38]
The Repression Imperative (Proposition 2) is quantified: demographic decline that re- ducesg n∗ t by 0.5 pp requires a compensating increase inε t of the same magnitude to maintain the debt trajectory. This provides a concrete empirical anchor for future re- search on the sustainability of Japan’s financial repression equilibrium
-
[39]
Debt dynamics under large yen depreciation remain stable for all(¯e, β)combinations within economically plausible ranges (Panel D), with the critical thresholdβ∗(¯e)derived analytically in equation (13). Robustness to pass-through specification.The sensitivity of theπ t trajectory in Ta- ble 12 to the choice of pass-through coefficientγis assessed through...
work page 2030
-
[40]
The subsequent tapering program has reducedφ t to≈0.88 as of March 2026 (BoJ Flow of Funds, December 2024). I.2 Identification Challenge The principal challenge in estimating¯φis the absence, within the 2013–2026 sample, of an episode in whichφt declined into a range plausibly associated with captive-system weakening and a sovereign risk premium emerged. ...
work page 2026
discussion (0)
Sign in with ORCID, Apple, or X to comment. Anyone can read and Pith papers without signing in.