Recognition: no theorem link
Enhancing Ly{α} Emitter Identification in HETDEX with a Convolutional Neural Network
Pith reviewed 2026-05-10 15:57 UTC · model grok-4.3
The pith
A convolutional neural network trained on two-dimensional spectral images identifies low signal-to-noise Lyα emitters in HETDEX data with 93 percent recovery of confirmed sources.
A machine-rendered reading of the paper's core claim, the machinery that carries it, and where it could break.
Core claim
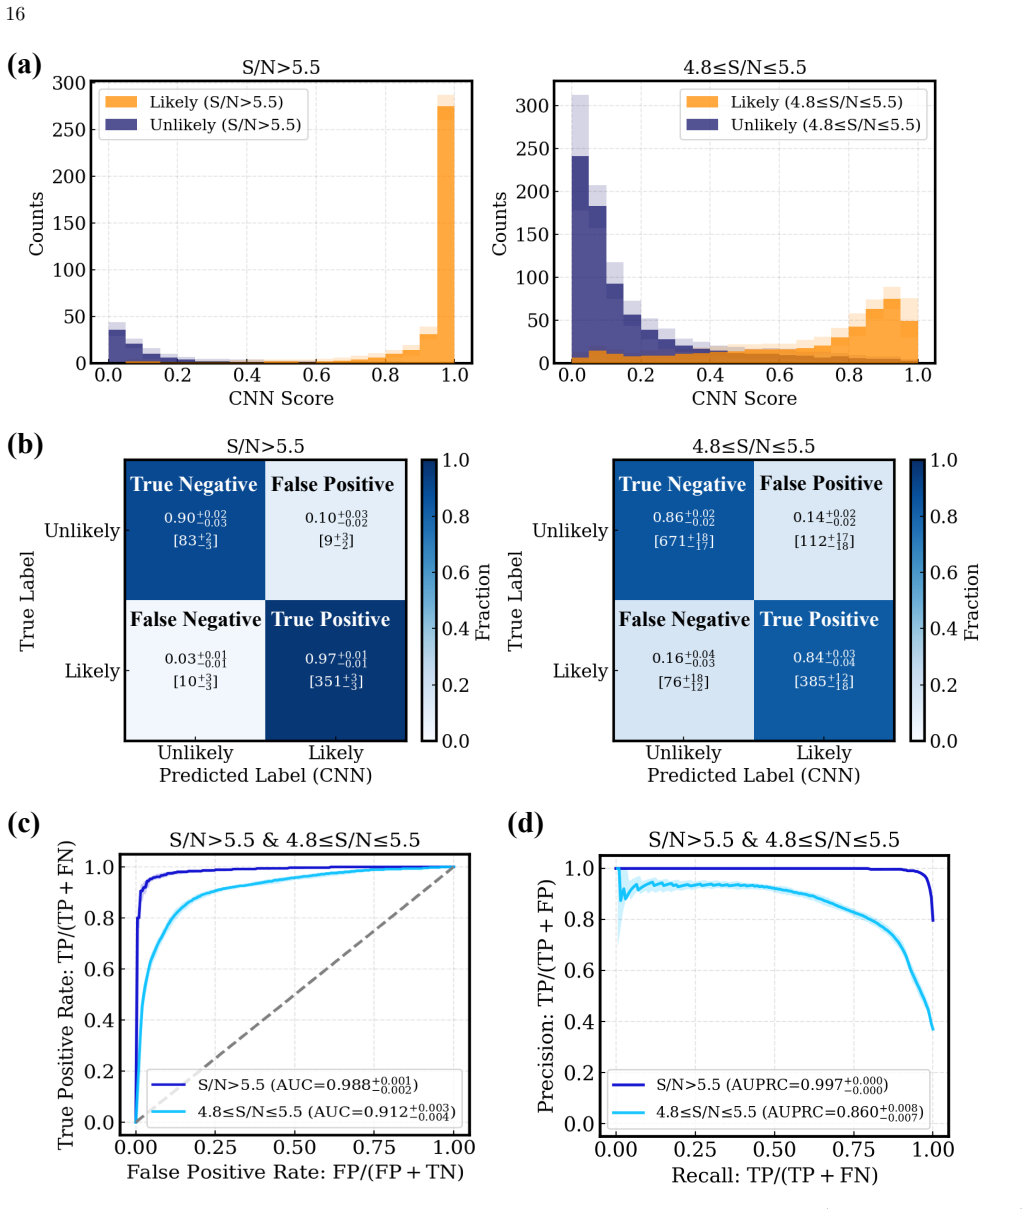
The authors show that a convolutional neural network applied to two-dimensional spectroscopic images of single emission lines can separate true Lyα emitters from artifacts and sky residuals. In the high-S/N regime above 5.5 the network attains 94.1 percent balanced accuracy, 97.5 percent precision, and 97.5 percent recall. In the low-S/N regime from 4.8 to 5.5 these figures are 85.1 percent, 78.2 percent, and 84.4 percent. Tested against HETDEX LAEs confirmed by DESI spectroscopy, the model recovers 99 percent of high-S/N sources and 93 percent of low-S/N sources. When run on the entire HETDEX catalog it suppresses spurious spikes in the redshift distribution across z approximately 1.9 to 2.
What carries the argument
Convolutional neural network that classifies two-dimensional spectral images of individual emission lines by attending to smooth central emission in true positives and irregular or noisy patterns in contaminants.
If this is right
- The network recovers 99 percent of high-S/N and 93 percent of low-S/N LAEs independently confirmed by DESI spectroscopy.
- It achieves 94.1 percent balanced accuracy at S/N greater than 5.5 and 85.1 percent at S/N between 4.8 and 5.5.
- Application to the full catalog removes spurious redshift spikes between z approximately 1.9 and 2.5.
- The cleaned sample mitigates false positives in galaxy clustering statistics used for cosmological analyses.
Where Pith is reading between the lines
- The same image-based classification approach could be retrained on data from other untargeted spectroscopic surveys to extend reliable emission-line detection to fainter limits.
- Visual attribution maps that highlight smooth extended emission suggest the network is learning physical source morphology rather than purely statistical noise patterns.
- Lowering the S/N threshold while controlling contaminants may enlarge the usable LAE sample enough to tighten constraints on large-scale structure at z approximately 2.
Load-bearing premise
The training set assembled from the HETDEX COSMOS field plus ancillary and citizen-science labels captures the full range of artifacts, sky residuals, and instrumental effects present across the entire survey footprint.
What would settle it
Applying the trained network to an independent HETDEX field outside the COSMOS training area and finding either persistent spurious spikes in the redshift distribution between z 1.9 and 2.5 or recovery below 90 percent of DESI-confirmed low-S/N LAEs.
Figures


read the original abstract
We present a deep learning framework to enhance the identification of Ly$\alpha$ emitters (LAEs) in the Hobby-Eberly Telescope Dark Energy Experiment (HETDEX), an untargeted spectroscopic survey of LAEs at $1.9 < z < 3.5$ without imaging pre-selection. We primarily address the low signal-to-noise ratio (S/N) regime ($4.8 \leq \mathrm{S/N} \leq 5.5$), where LAE candidates suffer from substantial noise contamination. To distinguish LAE candidates from artifacts and sky residuals, we employ a convolutional neural network (CNN) trained on two-dimensional spectral images of single emission lines. The training sample is constructed from the HETDEX COSMOS catalog, with external validation from ancillary observations and our participatory science project, \textit{Dark Energy Explorers}. For small-format, low-resolution spectroscopic data, the model achieves a balanced accuracy, precision, and recall of $94.1\%$, $97.5\%$, and $97.5\%$, respectively, in the high-S/N regime ($\mathrm{S/N}>5.5$), and $85.1\%$, $78.2\%$, and $84.4\%$ in the low-S/N regime. Using HETDEX LAEs independently identified by DESI spectroscopy, the model recovers $99\%$ and $93\%$ of the high- and low-S/N LAEs, respectively. Visual attribution indicates that the CNN attends to smooth, spatially extended central emission in true positives and to irregular or noisy features in true negatives. Applied to the full HETDEX catalog, the CNN enables an S/N threshold down to 4.8 by suppressing spurious spikes across $z\sim 1.9$--$2.5$ in the redshift distribution. Our approach facilitates HETDEX cosmological analyses by mitigating false positives in galaxy clustering and highlights the value of domain-specific deep learning for refining low-S/N spectroscopic identification in untargeted surveys.
Editorial analysis
A structured set of objections, weighed in public.
Referee Report
Summary. The paper presents a convolutional neural network (CNN) trained on 2D spectral images of single emission lines from the HETDEX COSMOS catalog (augmented with ancillary observations and citizen-science labels from Dark Energy Explorers) to classify Lyα emitters (LAEs) versus artifacts in the low-S/N regime (4.8 ≤ S/N ≤ 5.5). It reports balanced accuracy/precision/recall of 94.1%/97.5%/97.5% (high-S/N >5.5) and 85.1%/78.2%/84.4% (low-S/N), recovers 99% and 93% of high- and low-S/N LAEs independently confirmed by DESI spectroscopy, and applies the model to the full HETDEX catalog to lower the S/N threshold to 4.8 while suppressing spurious spikes in the redshift distribution between z~1.9–2.5.
Significance. If the reported generalization holds, the result would be significant for untargeted spectroscopic surveys: it provides a practical, interpretable (via visual attribution) method to increase LAE sample completeness without inflating false positives that bias galaxy clustering measurements. The use of external DESI validation and participatory-science labels is a clear strength, and the concrete recovery fractions on held-out data support the central empirical claim.
major comments (3)
- [Training sample construction and full-catalog application] The training sample is drawn exclusively from the HETDEX COSMOS catalog. No cross-field validation or ablation on other HETDEX pointings is presented to test whether sky residuals, instrumental spikes, or noise properties differ outside COSMOS. This assumption is load-bearing for the claim that the CNN can be applied to the full 540 deg² catalog and safely lower the S/N threshold to 4.8 while suppressing redshift spikes (abstract and § on full-catalog application).
- [DESI validation results] The DESI validation set yields the headline recovery rates (99%/93%). The manuscript must explicitly state the sky overlap and observing-condition similarity between the DESI fields used for validation and the COSMOS training field; if they largely coincide, the test does not probe out-of-distribution behavior across the full footprint.
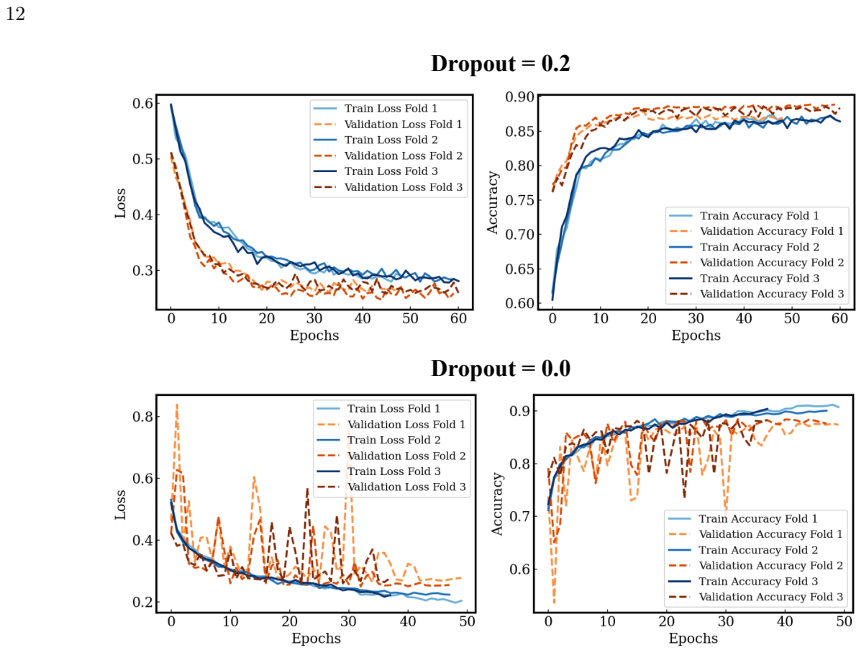
- [Methods and model description] The abstract and results quote specific accuracy/precision/recall numbers, yet the manuscript provides insufficient detail on CNN architecture (layers, kernel sizes, input preprocessing), training protocol (loss, optimizer, hyperparameters, data augmentation), and the precise train/validation/test split. These choices are free parameters that directly affect the quoted metrics and must be documented for reproducibility.
minor comments (2)
- [S/N regime definition] The S/N regime boundaries (4.8 and 5.5) are stated without derivation or sensitivity test; a brief justification or robustness check would clarify whether they are data-driven or chosen ad hoc.
- [Interpretability analysis] Visual attribution maps are described qualitatively; a quantitative comparison (e.g., overlap with emission-line centroids) would strengthen the interpretability section.
Simulated Author's Rebuttal
We thank the referee for their constructive and detailed review of our manuscript. We address each major comment point by point below, providing clarifications where possible and committing to revisions that strengthen the paper without misrepresenting our results.
read point-by-point responses
-
Referee: [Training sample construction and full-catalog application] The training sample is drawn exclusively from the HETDEX COSMOS catalog. No cross-field validation or ablation on other HETDEX pointings is presented to test whether sky residuals, instrumental spikes, or noise properties differ outside COSMOS. This assumption is load-bearing for the claim that the CNN can be applied to the full 540 deg² catalog and safely lower the S/N threshold to 4.8 while suppressing redshift spikes (abstract and § on full-catalog application).
Authors: We selected the COSMOS field for training because it provides the richest ancillary data and citizen-science labels from Dark Energy Explorers, enabling reliable ground-truth classification. All HETDEX pointings employ the same VIRUS instrument and similar observing protocols, so instrumental artifacts and noise characteristics are expected to be consistent across the survey. Nevertheless, we acknowledge the value of explicit cross-field testing. In the revised manuscript we will add a dedicated paragraph in the Methods and Discussion sections justifying the representativeness of COSMOS data, quantifying the uniformity of HETDEX observing conditions, and explicitly noting the limitation that full cross-field ablation was not performed. We will also state that future work will incorporate additional fields once labeled data become available. revision: partial
-
Referee: [DESI validation results] The DESI validation set yields the headline recovery rates (99%/93%). The manuscript must explicitly state the sky overlap and observing-condition similarity between the DESI fields used for validation and the COSMOS training field; if they largely coincide, the test does not probe out-of-distribution behavior across the full footprint.
Authors: We will revise the relevant section to provide a clear statement of the sky overlap and observing conditions. The DESI-confirmed LAEs used for validation come from HETDEX fields that include both the COSMOS region and additional pointings outside COSMOS, thereby offering a partial out-of-distribution test. We will quantify the fractional overlap, note the similarity in exposure times and seeing, and discuss how the 93 % low-S/N recovery rate supports generalization beyond the training field. revision: yes
-
Referee: [Methods and model description] The abstract and results quote specific accuracy/precision/recall numbers, yet the manuscript provides insufficient detail on CNN architecture (layers, kernel sizes, input preprocessing), training protocol (loss, optimizer, hyperparameters, data augmentation), and the precise train/validation/test split. These choices are free parameters that directly affect the quoted metrics and must be documented for reproducibility.
Authors: We agree that the current Methods section lacks sufficient detail for full reproducibility. In the revised manuscript we will expand the architecture description to list the number of convolutional layers, kernel sizes, stride, padding, activation functions, and pooling operations; specify all preprocessing steps (normalization, resizing, and noise handling); detail the training protocol including the loss function, optimizer, learning-rate schedule, batch size, number of epochs, and early-stopping criteria; describe the data-augmentation pipeline; and report the exact train/validation/test split fractions together with the rationale for the split. A summary table of all hyperparameters will be added. revision: yes
Circularity Check
No significant circularity; empirical ML performance on independent validation data
full rationale
The paper reports an empirical CNN classifier trained on HETDEX COSMOS spectra and validated against DESI spectroscopy plus citizen-science labels. Performance numbers (99%/93% recovery, balanced accuracy 94.1%/85.1%) are measured on held-out or externally labeled sets rather than derived from any equation that reduces to the training inputs by construction. No self-definitional loops, fitted parameters renamed as predictions, or load-bearing self-citations appear in the reported results. The central claim is a data-driven classification improvement, not a theoretical derivation.
Axiom & Free-Parameter Ledger
free parameters (2)
- CNN architecture and training hyperparameters
- S/N regime boundaries (4.8 and 5.5)
axioms (1)
- domain assumption 2D spectral images of single emission lines contain distinguishable morphological features for real LAEs versus artifacts
Forward citations
Cited by 1 Pith paper
-
Unveiling Hidden Lyman Alpha Emitters in the DESI DR1 Data
A CNN detects 19,685 LAEs at z=2-3.5 in DESI DR1 spectra with 95% purity and completeness.
Reference graph
Works this paper leans on
-
[1]
, " * write output.state after.block = add.period write newline
ENTRY address archivePrefix author booktitle chapter doi edition editor eprint howpublished institution journal key month number organization pages publisher school series title misctitle type volume year version url label extra.label sort.label short.list INTEGERS output.state before.all mid.sentence after.sentence after.block FUNCTION init.state.consts ...
-
[2]
write newline
" write newline "" before.all 'output.state := FUNCTION format.url url empty "" new.block "" url * "" * if FUNCTION format.eprint eprint empty "" archivePrefix empty "" archivePrefix "arXiv" = new.block " " eprint * " " * new.block " " eprint * " " * if if if FUNCTION format.doi doi empty "" " " doi * " " * if FUNCTION format.pid doi empty eprint empty ur...
-
[3]
Adam: A Method for Stochastic Optimization
thebibliography [1] 20pt to REFERENCES 6pt =0pt -12pt 10pt plus 3pt =0pt =0pt =1pt plus 1pt =0pt =0pt -12pt =13pt plus 1pt =20pt =13pt plus 1pt \@M =10000 =-1.0em =0pt =0pt 0pt =0pt =1.0em @enumiv\@empty 10000 10000 `\.\@m \@noitemerr \@latex@warning Empty `thebibliography' environment \@ifnextchar \@reference \@latexerr Missing key on reference command E...
work page internal anchor Pith review Pith/arXiv arXiv doi:10.5281/zenodo.831784 2021
discussion (0)
Sign in with ORCID, Apple, or X to comment. Anyone can read and Pith papers without signing in.