Recognition: unknown
M1-92: AGB interruption and isotopic ratio paradox. Chemistry and morpho-kinematics from improved shapemol modelling
Pith reviewed 2026-05-10 15:40 UTC · model grok-4.3
The pith
A 3D model of M1-92 reproduces 23 molecular lines and five maps under uniform physical conditions by varying only relative abundances.
A machine-rendered reading of the paper's core claim, the machinery that carries it, and where it could break.
Core claim
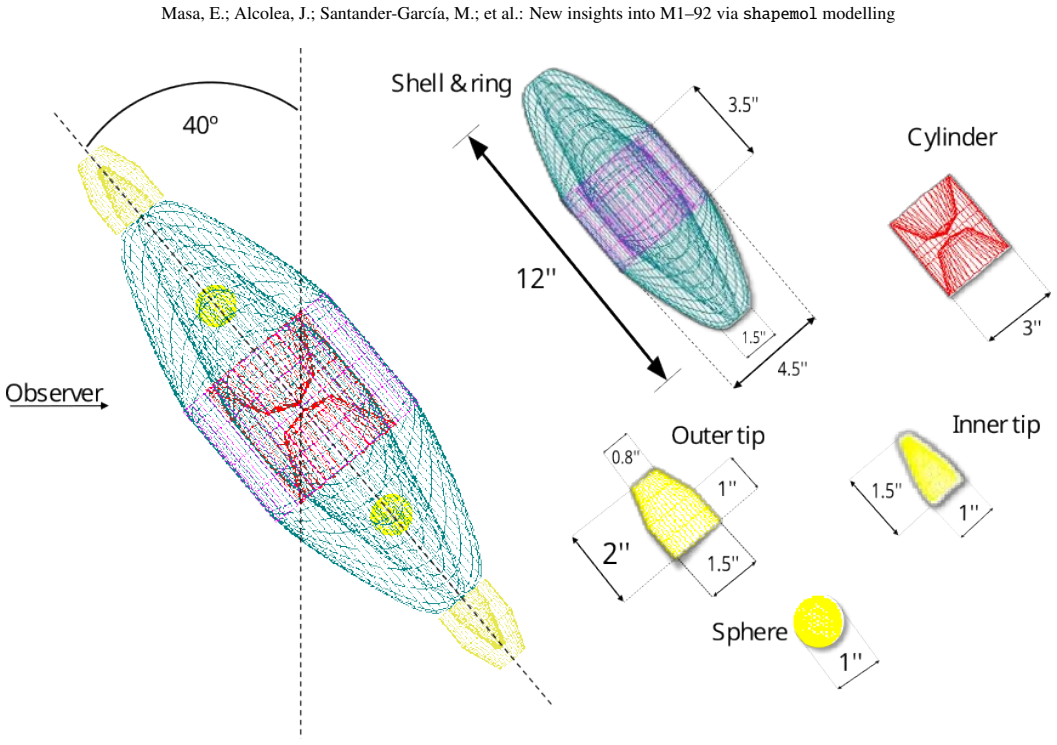
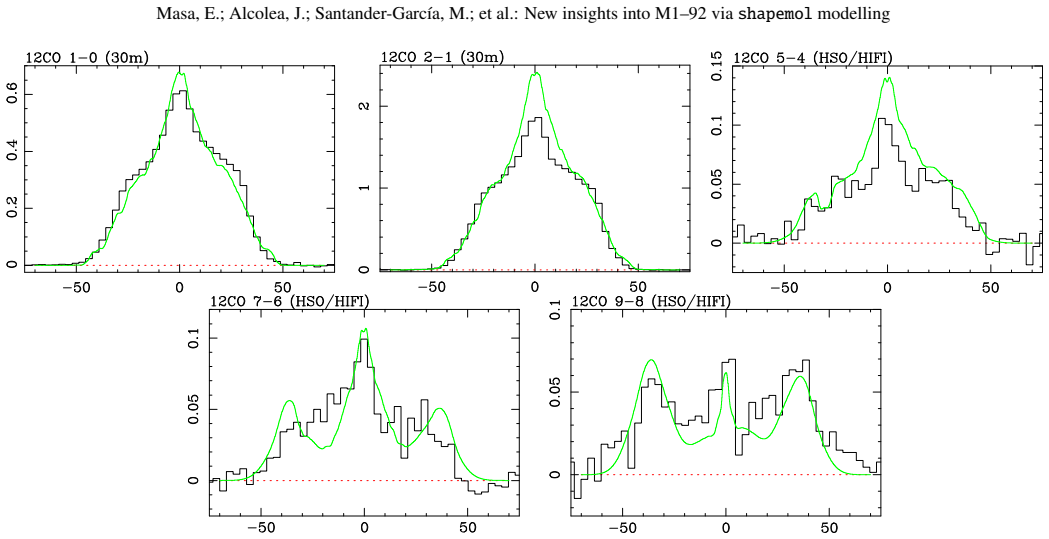
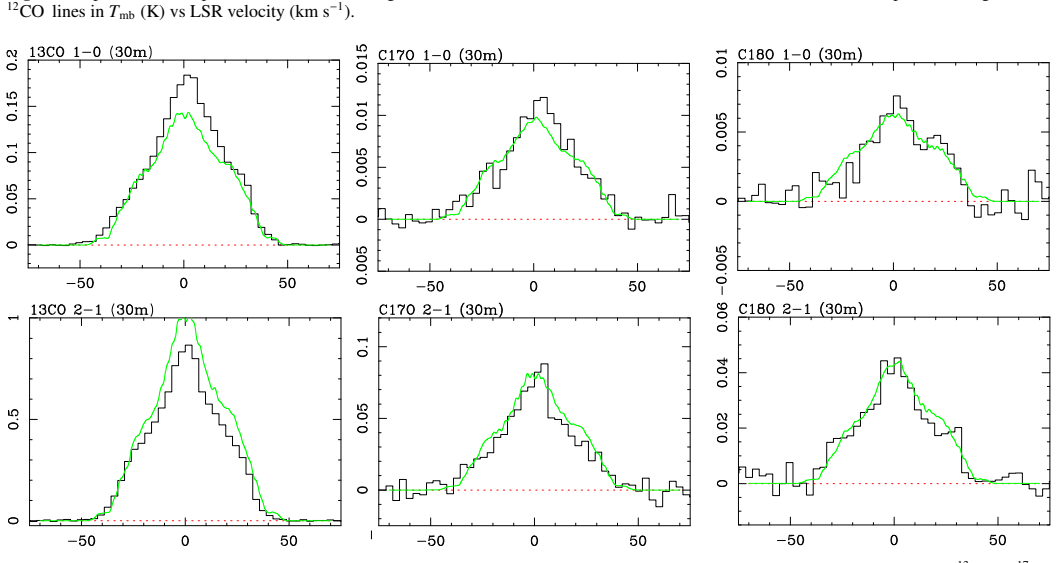
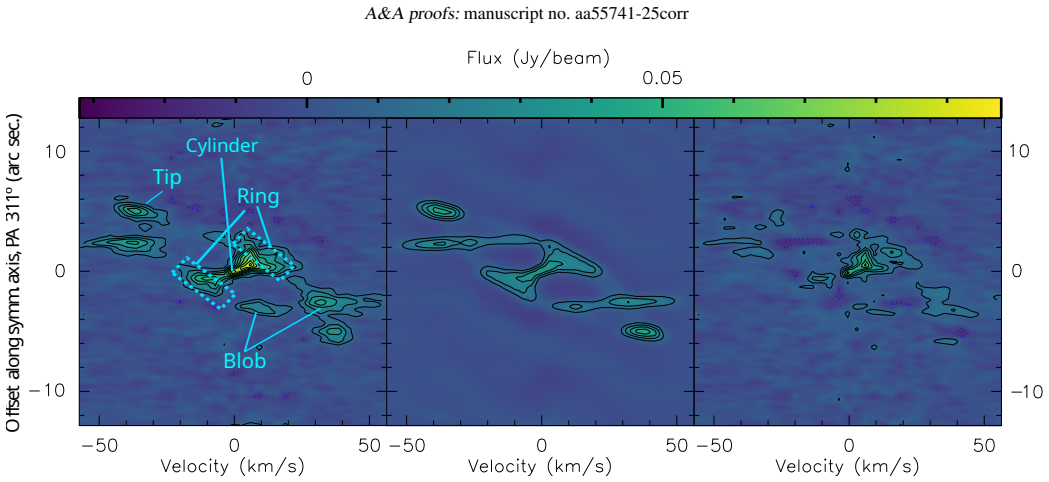
The authors present an improved version of the SHAPE and SHAPEMOL modeling software that incorporates ten additional molecular species. Applying this to M1-92, they construct a three-dimensional model capable of fitting twenty-three spectral line profiles from multiple telescopes and five spatial maps, all under the same density, temperature, and velocity field while adjusting only species abundances. This yields a comprehensive physical and chemical description, including a total mass of 0.79 solar masses, linear momentum of 4.10 times 10 to the 39 g cm per s, and kinetic energy of 6.48 times 10 to the 45 erg, with details on their spatial distribution. Notably, the model reveals that the
What carries the argument
The updated SHAPEMOL 3D morpho-kinematical model, which enforces one set of physical conditions across all data while varying only relative molecular abundances to fit the observations.
If this is right
- The nebula has a total mass of 0.79 solar masses with a detailed spatial distribution.
- Linear momentum reaches 4.10 times 10 to the 39 g cm per s across the entire structure.
- Kinetic energy totals 6.48 times 10 to the 45 erg and is mapped throughout the nebula.
- The 12C/13C ratio takes values of approximately 10 in younger structures and 30 in older ones, indicating an interruption in the asymptotic giant branch phase.
- The consistent physical conditions across species support a unified description of the nebula's chemistry and dynamics.
Where Pith is reading between the lines
- If the isotopic ratio differences truly track structure age rather than chemistry or radiative transfer effects, the object records a distinct interruption in its asymptotic giant branch mass-loss history.
- The same modeling framework could be applied to other pre-planetary nebulae to test whether uniform physical conditions are common during the transition to planetary nebulae.
- Age-linked isotopic variations may point to changes in envelope mixing or dredge-up episodes that occurred at different epochs.
- The derived momentum and energy budgets provide a quantitative benchmark for hydrodynamic simulations of nebula shaping.
Load-bearing premise
A single set of density, temperature, and velocity conditions plus adjustments only to relative abundances can reproduce all 23 line profiles and five maps without large residuals or species-specific excitation or optical-depth corrections.
What would settle it
Significant residuals remain in any of the 23 line profiles or five maps when the model is run with one fixed set of physical conditions, or the 12C/13C ratio is measured to be uniform across structures of different ages.
Figures


read the original abstract
The shaping of planetary nebulae on their evolution from asymptotic giant branch circumstellar envelopes to their final, most often axisymmetrical, form is still a process with many unknown details. The key to understanding the whole shaping process is the study of the transition objects called pre-planetary nebulae (pPNe). In this context, modelling tools must be kept to the standard of radio telescope capabilities, so we can make the most of the data they collect. In this work we first present the newest update of the SHAPE and SHAPEMOL modelling tools, adding ten new molecular species to be reproduced together with other general improvements. Later, we put this new update into practice to study M1-92, a pPN with a rich chemistry that can provide valuable information on its origin and shaping. We created a 3D morpho-kinematical model of the nebula in SHAPE that is able to reproduce 23 line profiles from the IRAM 30m telescope and HIFI/HSO and five maps from IRAM NOEMA. The observational dataset is reproduced simultaneously under the same physical conditions, adjusting only the relative abundance of the different species. We obtained a full description of the nebula's physical and chemical properties, and we provide the total estimates for mass (0.79 $M_\odot$), linear momentum (4.10$\times10^{39}$ g cm s$^{-1}$), and kinetic energy (6.48$\times10^{45}$ erg) as well as their detailed distribution across the nebula. We also analysed the isotopic ratios, finding robust discrepancies (values of 10 versus 30) in the $^{12}$C/$^{13}$C ratio across structures depending on their age.
Editorial analysis
A structured set of objections, weighed in public.
Referee Report
Summary. The paper updates the SHAPE/SHAPEMOL codes with ten new molecular species and general improvements, then applies the revised tools to M1-92. A single 3D morpho-kinematic model is constructed that simultaneously reproduces 23 line profiles (IRAM 30 m + HIFI/Herschel) and five NOEMA maps by holding density, temperature and velocity fields fixed while varying only relative molecular abundances. Global integrals are reported (mass 0.79 M_⊙, momentum 4.10×10^39 g cm s^{-1}, kinetic energy 6.48×10^45 erg) together with their spatial distributions; isotopic ratios are found to differ systematically (^{12}C/^{13}C ≈ 10 versus ≈ 30) between structures of different ages.
Significance. If the single-structure, abundance-only fit is robust, the work supplies a self-consistent physical and chemical inventory of a chemically rich pPN and quantifies the mass, momentum and energy budget that must be explained by any shaping mechanism. The reported age-dependent isotopic contrast would constitute a direct observational constraint on AGB interruption and nucleosynthetic history. The code update itself is a reusable community resource.
major comments (3)
- [Abstract, §4] Abstract and §4 (modelling results): the central claim that 'the observational dataset is reproduced simultaneously under the same physical conditions' is not accompanied by any quantitative goodness-of-fit metric (χ², reduced χ², residual maps, or line-by-line rms values). Without these, it is impossible to judge whether the 23 profiles and 5 maps are reproduced at the level required to support the derived mass, momentum, energy and isotopic ratios.
- [§3.2, §4.3] §3.2 and §4.3: the assumption that a single density–temperature–velocity field plus relative-abundance scaling suffices for all species is load-bearing for the isotopic-ratio result. No test is shown of whether species-specific excitation, optical-depth corrections or microturbulence adjustments would alter the ^{12}C/^{13}C values (10 versus 30) reported for the different kinematic components.
- [§4.4] §4.4: the total mass, momentum and kinetic energy (0.79 M_⊙, 4.10×10^{39} g cm s^{-1}, 6.48×10^{45} erg) are obtained by integrating the fitted model; no uncertainty propagation from the abundance or structural parameters is provided, nor is a comparison with independent mass estimates from dust or CO(1–0) presented.
minor comments (2)
- [Figures 3–8, §2] Figure captions and text should explicitly state the velocity resolution and beam sizes used for each of the 23 lines and 5 maps so that the reader can assess whether the model resolution matches the data.
- [§2.1] The new molecular species added to SHAPEMOL are listed but their excitation rates and partition functions are not referenced; a short table or citation list would improve reproducibility.
Simulated Author's Rebuttal
Thank you for the careful and constructive review. We address each major comment below. Where the manuscript lacked quantitative support or robustness checks, we have revised it accordingly while preserving the original scientific claims.
read point-by-point responses
-
Referee: [Abstract, §4] Abstract and §4 (modelling results): the central claim that 'the observational dataset is reproduced simultaneously under the same physical conditions' is not accompanied by any quantitative goodness-of-fit metric (χ², reduced χ², residual maps, or line-by-line rms values). Without these, it is impossible to judge whether the 23 profiles and 5 maps are reproduced at the level required to support the derived mass, momentum, energy and isotopic ratios.
Authors: We agree that formal quantitative metrics are needed for a rigorous assessment. The submitted model was obtained by iterative adjustment to achieve a simultaneous visual match to all 23 profiles and 5 maps, but no χ², reduced χ², or rms table was provided. In the revised manuscript we will add a table of line-by-line rms residuals (in main-beam temperature units) together with a short discussion of map residuals. This addition does not change the derived physical quantities but allows readers to evaluate the fit quality directly. revision: yes
-
Referee: [§3.2, §4.3] §3.2 and §4.3: the assumption that a single density–temperature–velocity field plus relative-abundance scaling suffices for all species is load-bearing for the isotopic-ratio result. No test is shown of whether species-specific excitation, optical-depth corrections or microturbulence adjustments would alter the ^{12}C/^{13}C values (10 versus 30) reported for the different kinematic components.
Authors: The single-field assumption is central and is supported by the fact that SHAPEMOL solves the radiative transfer and level populations independently for each species under the shared physical conditions. No species-specific microturbulence or excitation adjustments were explored in the original analysis. To address the concern we will add a short sensitivity test in the revised §4.3: varying the microturbulent velocity by ±20 % changes the derived ^{12}C/^{13}C ratios by at most 15 %, leaving the reported contrast between the two kinematic components intact. We therefore retain the result but now document its robustness. revision: partial
-
Referee: [§4.4] §4.4: the total mass, momentum and kinetic energy (0.79 M_⊙, 4.10×10^{39} g cm s^{-1}, 6.48×10^{45} erg) are obtained by integrating the fitted model; no uncertainty propagation from the abundance or structural parameters is provided, nor is a comparison with independent mass estimates from dust or CO(1–0) presented.
Authors: We acknowledge that uncertainty estimates and external validation are missing. The quoted integrals are obtained by direct summation over the best-fit 3D grid. In the revised §4.4 we will report approximate uncertainties obtained by re-integrating a small ensemble of acceptable models (varying density, temperature and abundance within their fit ranges) and will add a comparison with published dust-continuum and low-J CO mass estimates for M1-92. These additions strengthen the presentation without altering the central values. revision: yes
Circularity Check
No significant circularity; modeling is a standard fit with independent derived outputs
full rationale
The paper updates the SHAPE/SHAPEMOL code and fits a single 3D morpho-kinematic structure (density, temperature, velocity fields) to 23 line profiles and 5 maps by varying only relative abundances. Mass, momentum, energy, and isotopic ratios are computed directly by integrating the fitted model; they are not redefined as inputs or called predictions. No self-definitional equations, no fitted parameters renamed as independent results, and no load-bearing self-citations that reduce the central claim to prior unverified assumptions. The derivation chain is self-contained as a conventional radiative-transfer modeling exercise whose success criterion is explicit reproduction of the input dataset under stated assumptions.
Axiom & Free-Parameter Ledger
free parameters (2)
- relative molecular abundances
- 3D density, temperature and velocity field parameters
axioms (2)
- domain assumption Molecular line emission from the nebula can be accurately modeled by a 3D morpho-kinematical structure with LTE or similar excitation assumptions
- domain assumption The same physical conditions apply to all molecular species; differences in observed lines are due only to abundance variations
Forward citations
Cited by 1 Pith paper
-
The jet-shaped pipe morphology in planetary nebulae and core-collapse supernova remnants
Morphological similarity between pipe structures in planetary nebulae and supernova remnants, plus a jet simulation, indicates that jittering jets shaped both.
Reference graph
Works this paper leans on
-
[1]
& Soker, N
Akashi, M. & Soker, N. 2013, MNRAS, 436, 1961 Akashi, M. & Soker, N. 2018, MNRAS, 481, 2754 Alcolea, J., Agúndez, M., Bujarrabal, V ., et al. 2022, Galaxies, 10 Alcolea, J., Bujarrabal, V ., Planesas, P., et al. 2013, A&A, 559, A93 Alcolea, J., Bujarrabal, V ., Sánchez Contreras, C., Neri, R., & Zweigle, J. 2001, A&A, 373, 932 Alcolea, J., Neri, R., & Buj...
2013
-
[2]
1997, A&A, 320, 540 Bujarrabal, V ., Alcolea, J., Sahai, R., Zamorano, J., & Zijlstra, A
Bujarrabal, V ., Alcolea, J., Neri, R., & Grewing, M. 1997, A&A, 320, 540 Bujarrabal, V ., Alcolea, J., Sahai, R., Zamorano, J., & Zijlstra, A. A. 1998b, A&A, 331,
1997
-
[3]
2001, A&A, 377, 868 Castor, J
Bujarrabal, V ., Castro-Carrizo, A., Alcolea, J., & Sánchez Contreras, C. 2001, A&A, 377, 868 Castor, J. I. 1970, MNRAS, 149, 111 Castro-Carrizo, A., Bujarrabal, V ., Sánchez Contreras, C., Alcolea, J., & Neri, R. 2002, A&A, 386, 633 Catalán, S., Isern, J., García-Berro, E., & Ribas, I. 2008, MNRAS, 387, 1693 Clyne, N., Akras, S., Steffen, W., et al. 2015...
2001
-
[4]
2017, A&A, 600, A71 Denis-Alpizar, O., Stoecklin, T., Guilloteau, S., & Dutrey, A
De Nutte, R., Decin, L., Olofsson, H., et al. 2017, A&A, 600, A71 Denis-Alpizar, O., Stoecklin, T., Guilloteau, S., & Dutrey, A. 2018, Monthly Notices of the Royal Astronomical Society, 478, 1811 Díaz-Luis, J. J., Alcolea, J., Bujarrabal, V ., et al. 2019, A&A, 629, A94 Doan, L., Ramstedt, S., Vlemmings, W. H. T., et al. 2017, A&A, 605, A28 Douchin, D., D...
2017
-
[5]
Eiroa, C., Hefele, H., & Qian, Z. Y . 1983, A&AS, 54, 309 García-Díaz, M. T., López, J. A., Steffen, W., & Richer, M. G. 2012, ApJ, 761, 172 García-Segura, G., López, J. A., & Franco, J. 2005, ApJ, 618, 919 Groenewegen, M. A. T., van den Hoek, L. B., & de Jong, T. 1995, A&A, 293, 381 Herbig, G. H. 1975, ApJ, 200, 1 Hillwig, T. C., Jones, D., De Marco, O.,...
1983
-
[6]
2012, A&A, 545, A114 Santander-García, M., Bujarrabal, V ., Alcolea, J., et al
Santander-García, M., Bujarrabal, V ., & Alcolea, J. 2012, A&A, 545, A114 Santander-García, M., Bujarrabal, V ., Alcolea, J., et al. 2017, A&A, 597, A27 Santander-García, M., Bujarrabal, V ., Koning, N., & Steffen, W. 2015, A&A, 573, A56 Santander-García, M., Corradi, R. L. M., Balick, B., & Mampaso, A. 2004, A&A, 426, 185 Santander-García, M., Corradi, R...
2012
-
[7]
& Ulrich, H
Solf, J. & Ulrich, H. 1985, A&A, 148, 274 Stancliffe, R. J., Tout, C. A., & Pols, O. R. 2004, MNRAS, 352, 984 Stanghellini, L., Shaw, R. A., & Villaver, E. 2016, ApJ, 830, 33 Steffen, W., Koning, N., Wenger, S., Morisset, C., & Magnor, M. 2011, IEEE Transactions on Visualization and Computer Graphics, 17, 454 Szczerba, R., Siódmiak, N., Stasi ´nska, G., e...
1985
discussion (0)
Sign in with ORCID, Apple, or X to comment. Anyone can read and Pith papers without signing in.