Recognition: unknown
What good is modeling? Introducing biology students to theory
Pith reviewed 2026-05-10 13:06 UTC · model grok-4.3
The pith
A course design teaches biology graduate students to read theory papers with limited math training.
A machine-rendered reading of the paper's core claim, the machinery that carries it, and where it could break.
Core claim
The course shows that biology students can learn to appreciate and apply theoretical models by focusing on conceptual elements such as model assumptions, evidence standards, and the dialogue between theory and data, without needing advanced mathematical preparation.
What carries the argument
A curriculum built on backwards design, active learning, and just-in-time teaching that guides students through the structure and interpretation of theory papers.
If this is right
- Students develop the ability to evaluate the assumptions and evidence in theoretical claims.
- Empirical biologists become better prepared to collaborate with modelers on shared research questions.
- The integration of theory and data improves, supporting more rigorous scientific progress overall.
Where Pith is reading between the lines
- The same pedagogical structure could be adapted for undergraduate biology courses or for students in other fields that rely on modeling.
- Widespread use might shift research norms so that more biologists incorporate modeling directly into their experimental designs.
- The course could serve as a template for addressing similar theory-empirical gaps in chemistry or physics education.
Load-bearing premise
That exposing students to this course content and teaching approach will produce measurable gains in their understanding of theory and critical thinking skills.
What would settle it
A comparison of student performance on tasks that require interpreting model assumptions and evidence before and after the course, versus a control group of similar students, that shows no difference in outcomes.
Figures
read the original abstract
Theory and empirical science should be in constant dialogue, but often find it hard to understand one another. Here we describe a graduate-level university course we developed to improve matters. The course was designed to help empirically-focused biology graduate students read and understand theory papers, despite little prior mathematical training. It uses several evidence-based principles of modern teaching: backwards design, active learning, and just-in-time teaching. We believe that this or similar curricular content, emphasizing the nature of evidence and the role of theory in science, will improve critical thinking and scientific progress.
Editorial analysis
A structured set of objections, weighed in public.
Referee Report
Summary. The manuscript describes the development of a graduate-level course for empirically trained biology students to improve their ability to read and engage with theoretical papers. It details the course rationale, structure, and use of evidence-based pedagogical methods (backwards design, active learning, and just-in-time teaching) and asserts that such training, by emphasizing the nature of evidence and the role of theory, will enhance students' critical thinking and contribute to scientific progress.
Significance. If the course design demonstrably improves students' engagement with theory, the work could provide a useful model for integrating modeling into biology graduate education and addressing the theory-empiricism divide. The explicit grounding in established teaching principles is a positive feature, but the lack of any outcome evaluation means the claimed benefits remain hypothetical rather than evidenced.
major comments (1)
- Abstract and concluding sections: The central assertion that the course 'will improve critical thinking and scientific progress' is stated without any pre/post assessments, student outcome data, control comparisons, or other evaluation results. This leaves the efficacy claim as an untested belief rather than a substantiated result, which is load-bearing for the paper's contribution to education research.
Simulated Author's Rebuttal
We thank the referee for the detailed and constructive review of our manuscript on the development of a graduate course to help biology students engage with theoretical modeling. We agree that the paper describes a course design grounded in established pedagogical methods but does not include empirical outcome data, and we will revise the abstract and conclusions accordingly to ensure the claims accurately reflect the scope of the work.
read point-by-point responses
-
Referee: Abstract and concluding sections: The central assertion that the course 'will improve critical thinking and scientific progress' is stated without any pre/post assessments, student outcome data, control comparisons, or other evaluation results. This leaves the efficacy claim as an untested belief rather than a substantiated result, which is load-bearing for the paper's contribution to education research.
Authors: We agree that the manuscript does not include pre/post assessments, student outcome data, or control comparisons to empirically demonstrate improvements in critical thinking or scientific progress. The primary contribution of the paper is the description of the course rationale, structure, and its explicit use of evidence-based teaching principles (backwards design, active learning, and just-in-time teaching). The statement in the abstract and conclusions is framed as a belief informed by the established literature on these methods and the nature of theory-empiricism dialogue in biology, rather than a claim of demonstrated results. To address this point, we will revise the abstract and concluding sections to clarify that the course is designed to foster these skills based on pedagogical best practices, and that we hypothesize benefits to critical thinking and scientific progress, while explicitly noting the absence of direct evaluation data in the current work. We will also add a brief discussion of potential avenues for future assessment. revision: yes
Circularity Check
No circularity: purely descriptive pedagogical proposal with no derivations or self-referential reductions
full rationale
The manuscript describes the design of a graduate course using backwards design, active learning, and just-in-time teaching to help biology students read theory papers. It contains no equations, models, predictions, fitted parameters, or derivation chains. The statement that the course 'will improve critical thinking and scientific progress' is presented as a belief rather than a derived result. No self-citations function as load-bearing justifications for uniqueness or ansatzes, and no steps reduce by construction to the paper's own inputs. This is a standard non-circular descriptive account of curriculum development.
Axiom & Free-Parameter Ledger
Reference graph
Works this paper leans on
-
[1]
a little mathematics of the multiplication-table type
Map the math in the paper to the math that you have learned in Intro Biology etc. Use p' and q' for the notation used in undergrad, and p, q, and r for Hardy’s notation. As a reminder re undergrad coverage, allele frequencies are p' and q'=1-p', and genotype frequencies are p'2, 2p'q', and q'2. a. Write down p’=…, p’2=..., p=…, etc. where you fill out the...
-
[2]
What is the main contribution of Hardy’s paper?
-
[3]
Hardy- Weinberg equilibrium
Is this different from what you have previously learned about the contribution of “Hardy- Weinberg equilibrium” or “law”? Note to instructors, not part of reading guide: This paper is short and the math not particularly involved, but the actual contribution, historically, is quite different from what students will expect, so it is worth reflecting here on...
-
[4]
What are proof of concept models? Mention their purpose and how they operate, as far as you can extract from the paper
-
[5]
In models, we do not have such ‘data’
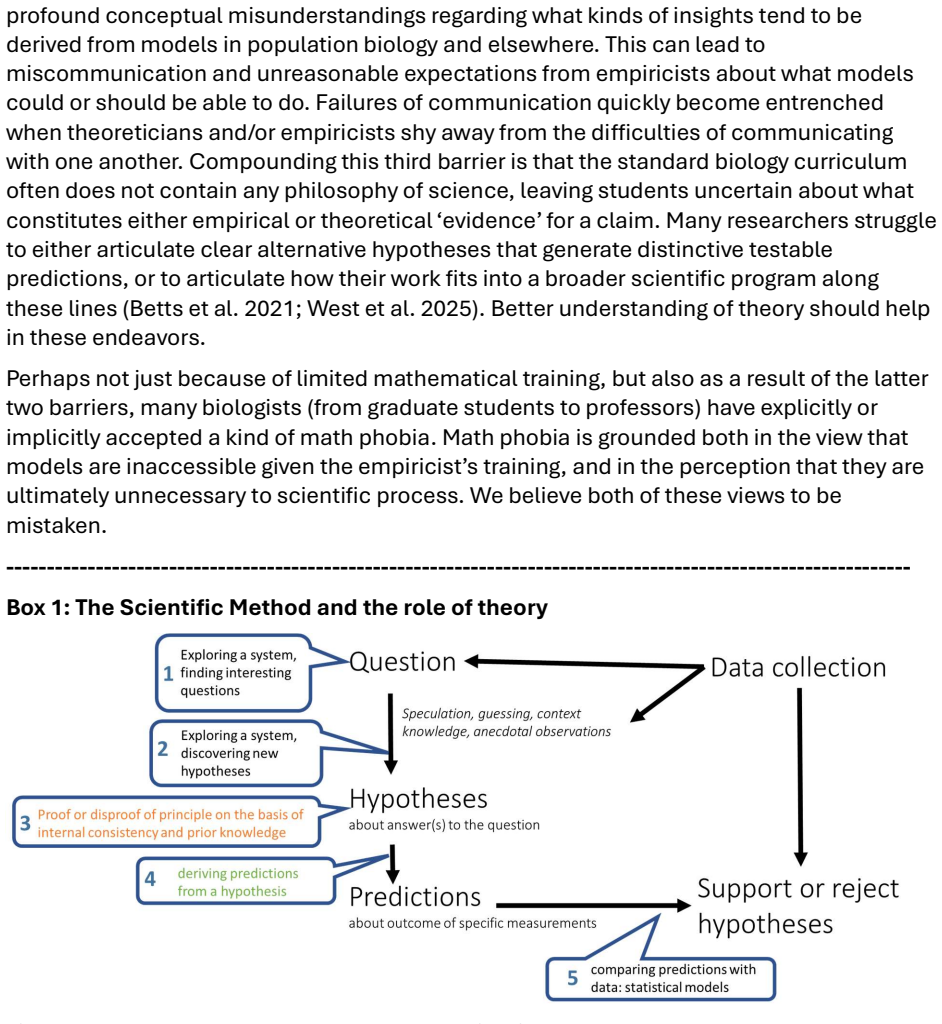
In the Scientific Method, empirical data (measurements of some kind) are critical to check which of our predictions are correct, because they allow information we do not yet have to enter the argument. In models, we do not have such ‘data’. But we know our thought processes are biased. Thus, what ‘outside arbiter’ of our thoughts is used in models (of the...
-
[6]
What are the three types of assumptions discussed? Which one is the type most likely to be disputed, and why?
Box 1 – Assumptions. What are the three types of assumptions discussed? Which one is the type most likely to be disputed, and why?
-
[7]
Reading guide 3: Schmid-Hempel et al
In what sense are (empirical) tests of model predictions NOT ‘tests of the model’? Check particularly Box 2 and the right column on pages 2 and 3. Reading guide 3: Schmid-Hempel et al
-
[9]
What, according to this paper, may be the explanation?
-
[10]
Can you identify what each of the terms in that equation is, and why it is there? Mark in figure 1 where each of these chunks of energy are expended
Look at equation (3) after reading over the entire paper. Can you identify what each of the terms in that equation is, and why it is there? Mark in figure 1 where each of these chunks of energy are expended
-
[11]
This is a formula to compute Cp, which is one part of the energy expenditure in (3)
Then go back to equation (1a). This is a formula to compute Cp, which is one part of the energy expenditure in (3). Again, identify each of the terms in that equation (1a), and make sure you understand why it is there
-
[12]
Reading guide 4: Masel If you have never heard of a prion, the first paragraph is probably too brief for you, and looking at Wikipedia could be helpful for general background
If you got this far, try to understand how figure 2 is generated from these equations. Reading guide 4: Masel If you have never heard of a prion, the first paragraph is probably too brief for you, and looking at Wikipedia could be helpful for general background. Talking about prions back then was a less extreme version of talking about SARS-CoV-2 in 2020 ...
2020
-
[13]
Focus on Figure 2 to understand the main processes captured by the model
-
[14]
i" and make it “j
When the text refers to Equation 8 in Appendix A, skip down to focus on that. What do the quantities x and yi represent? dx/dt means the rate at which x changes. Link the terms in Equation 8 to the processes of change drawn in Figure 2. It will be helpful to physically print out the paper, or to have two electronic copies open at once, so you can look at ...
-
[15]
The system can be closed by summation…
Document 5b explains how to get from Equation 8 to Equation 1, but you do NOT need to read this document. The existence of this document is a reflection of the pitfalls of using math language of the kind we have already talked about, which in this case reads “The system can be closed by summation…” Just believe that it can be done, and focus on what was a...
-
[16]
Going back to the main text, read as far as the paragraph with Equation 3, and then sketch out how you think x, y, and z behave as a function of time
-
[17]
Remind yourself of the title of the paper while doing so
Read the rest with a focus on putting together an input -> black box -> output diagram. Remind yourself of the title of the paper while doing so. Reading guide 5: Maynard Smith and Price
-
[18]
What is the puzzling phenomenon the paper strives to find an explanation for?
-
[19]
into our slide with the six options on what purpose a model may serve
As for every paper, you should now immediately try to figure out how the insights gained in the paper fit into the Scientific Method, i.e. into our slide with the six options on what purpose a model may serve. Here, focus first on the simulation model (results in Table 1) and then on the analytical model (results in equation (1) and the paragraph after th...
-
[20]
What are inputs and outputs of the simulation model?
-
[21]
From what you can glean from the paper, how is a simulation model as used here different from the previous models we have discussed?
-
[22]
As HW3, you will program a simulation model in Mathematica that (re)creates (part of) Table 1. Not worrying about the details of Mathematica syntax, do you think you understand what steps this program has to have to get to these results? You may want to start a list of questions to ask in class about this – we will use several class periods to get you to ...
-
[23]
What is the main insight gained in this paper?
-
[24]
into our slide with the six options on what purpose a model may serve
As for every paper, you should now immediately try to figure out how the insights gained in the paper fit into the Scientific Method, i.e. into our slide with the six options on what purpose a model may serve. Which number is it, and why?
-
[25]
What are the differences in how random, cascade, and niche networks are generated?
-
[26]
What happens after networks are generated?
-
[27]
What is the model process – is it numeric or analytical, is it stochastic (uses randomness), is it a simulation?
-
[28]
Why? And where do the empirical data come from?
In Table 2, empirical data are compared to the model results. Why? And where do the empirical data come from?
-
[29]
The niche model’s most significant errors may indicate problems with the data
The paper actually says “The niche model’s most significant errors may indicate problems with the data.” This seems to be the opposite of what we would usually conclude (i.e. usually inconsistencies with reality would indicate problems with the model). Explain and comment on this sentence. Reading guide 7: Fussman & Blasius Part I Big picture (abstract an...
-
[30]
What is the ‘paradox of enrichment’? You might want to also check just the first paragraph of the corresponding Wikipedia entry (https://en.wikipedia.org/wiki/Paradox_of_enrichment)
-
[31]
What, from the abstract and the last paragraph of the Introduction, does this paper aim to do and achieve?
-
[32]
What is the difference between a phenomenological model (or description) and a mechanistic one? Model details (page 1, mostly Introduction, and first couple of sentences of Methods)
-
[33]
What, specifically, is dx/dt and dy/dt, in biological terms?
-
[34]
Draw a sketch of what logistic growth looks like (x from the paper is on the y-axis) and mark K and r into your sketch. If you have not heard of this, Khan Academy has a better article than Wikipedia on this (https://www.khanacademy.org/science/ap-biology/ecology-ap/population- ecology-ap/a/exponential-logistic-growth)
-
[35]
‘g(x)’, ‘f(x)*y’, etc.)
Explain what biological process each of the terms in those equations corresponds to (i.e. ‘g(x)’, ‘f(x)*y’, etc.)
-
[36]
(a) What is an ‘uptake function’? Draw a sketch of a couple of possible uptake functions that fulfill the criteria in the first sentence of the Methods, and mark/label in your sketch what these criteria are. (b) What is ‘curvature’, and specifically ‘negative curvature’? Make sure your sketch of possible uptake functions includes one that does not have ‘n...
-
[37]
Why is f(x) multiplied by y? Why is m multiplied by y? Model details (Methods, Table I, Fig. 1)
-
[38]
How do they differ, and how are they similar? (explain in 1-3 sentences, no equations) Part II (AFTER discussion in class) Model details (moving to results and rest of the paper)
There are three functions considered here for f(x). How do they differ, and how are they similar? (explain in 1-3 sentences, no equations) Part II (AFTER discussion in class) Model details (moving to results and rest of the paper)
-
[39]
What is an isocline, and what is plotted in figure 1b,c?
-
[40]
What is an unstable equilibrium?
-
[41]
How is their model different from the classic Lotka-Volterra model of predator-prey dynamics? Conclusions
-
[42]
What is their criticism of the Lotka-Volterra model?
-
[43]
Big picture (abstract) Make sure you check the ‘Two summary slides’ on D2L which summarize our recommended method for reading (and interpreting) modeling/theory papers
What result is their conclusion about ‘high sensitivity to model structure’ based on? How is it different from saying ‘the model results depend on parameter values’? What does this conclusion imply? Reading guide 8: Stainforth et al. Big picture (abstract) Make sure you check the ‘Two summary slides’ on D2L which summarize our recommended method for readi...
-
[44]
in 5 K and 2 K and 11 K as mentioned in the abstract)?
What is ‘K’ (e.g. in 5 K and 2 K and 11 K as mentioned in the abstract)?
-
[45]
What does the term ‘climate sensitivity’ mean? What unit is it measured in, and is this a prediction of what the world’s climate will be like in the future?
-
[46]
What is the overall insight/conclusion contributed by the paper?
-
[47]
Model big picture (For this, it may help to relatively quickly read the whole paper first, then focus on the first page (p403), Fig
What is the purpose of the model in terms of our Scientific Method scheme? Note that this paper is an outlier among the papers we have read so far; and a couple of different purposes could be identified. Model big picture (For this, it may help to relatively quickly read the whole paper first, then focus on the first page (p403), Fig. 3 to get an idea of ...
-
[48]
What are the inputs and outputs of this model in general terms?
-
[49]
What does ‘ensemble’ mean? What are the two layers of ensemble they are talking about (forming a ‘grand ensemble’)?
-
[50]
chaotic climate variability
Stainforth et al. consider two sources of uncertainty: “chaotic climate variability” and “model response uncertainty”. What are differences between these types of uncertainty?
-
[51]
Model details
Can you think of other sources of uncertainty? This should lead you into thinking about assumptions and simplifications that are made in the modeling process here. Model details
-
[52]
Why is this so much more computationally expensive?
How does the modeling process actually work? There are only 2578 simulations, which does not seem like that high a number (some of you did almost that many for the Maynard Smith & Price homework. Why is this so much more computationally expensive?
-
[53]
The place to begin understanding the paper is with the experiment
What type of model is it (look at classification scheme)? Reading guide 9: Luria-Delbrück The Luria-Delbruck paper contains experiments as well as models. The place to begin understanding the paper is with the experiment
-
[54]
the phenomenon studied by the paper b
In your own words, identify a. the phenomenon studied by the paper b. two main alternative hypotheses together with the specific question about the phenomenon that those hypotheses address
-
[55]
The last statement…
Focus from the last half of the 3rd page starting “The last statement…” until the end of the section on page 4. You can skim over the paragraph “Second,…”, that point is less important. This describes both an experimental approach that wouldn’t distinguish between the hypotheses, and begins to develop an idea for an approach that would
-
[56]
The aim of the theory is the analysis of the probability distributions…
The theory starts with “The aim of the theory is the analysis of the probability distributions…”. Restate in your own words what exactly this probability distribution is. Any probability distribution gives the probability of seeing each possible outcome with one repeat of data collection. What act of data collection is referred to here, and what are the p...
-
[57]
You can skim over the details of this theory, and find important information around the middle of p497, the top of p499, and around Eq
What probability distribution is expected for each of the two hypotheses? For one hypothesis, the answer is given immediately in the Theory section, while the rest of the section is dedicated to working out the answer for the other hypothesis. You can skim over the details of this theory, and find important information around the middle of p497, the top o...
-
[58]
What does that physically involve? Don’t get too caught up in the Methods details of p501-502
The experiment measures the probability distribution. What does that physically involve? Don’t get too caught up in the Methods details of p501-502. Also note that ¾ of p503 including Table 1 is part of a section testing the reliability of the Method: you can therefore skip this altogether if you are interested in the big picture. Lower down on p503 start...
-
[59]
How do Tables 2 and 3 distinguish between the hypotheses?
-
[60]
Skipping ahead to p507, note that a connection is made to mutation rate estimation. Don’t worry about the theoretical details; what does this paper imply that you must do if you want to measure a mutation rate in a microbe? If you were to simply take the number of resistant colonies and divide it by the total number of bacteria, would this be an underesti...
-
[61]
How might results be different if you did the experiment on a strain that did? Reading guide 10: Hubbell Big picture (pages 1-2)
Bonus question to bring into the modern era: the strain of bacteria used in this experiment does not have a CRISPR-style adaptive immune system. How might results be different if you did the experiment on a strain that did? Reading guide 10: Hubbell Big picture (pages 1-2)
-
[62]
What are the processes traditionally modeled by community ecologists?
-
[63]
What are the processes traditionally modeled by biogeographers?
-
[64]
What are the outputs of interest from the models of these processes?
-
[65]
neutral” theory of ecology
Why do you think this theory has come to be known as the “neutral” theory of ecology”
-
[66]
What two things does Hubbell claim to be unifying? Model details (page 3)
-
[67]
Hubbell’s model has two levels to it, what are they? Represent them in a diagram
-
[68]
1 in this diagram
Draw the variables and parameters from Fig. 1 in this diagram
-
[69]
Identify the possible states of the system represented in Fig. 1. How many of them are there, and what do they each represent biologically?
-
[70]
Draw a graph of the Markov process (states and transitions between them, like we did for the two state system of an occupied vs empty nest site) described in Fig. 1. Label each state and each transition rate
-
[71]
In Figure 1, who has to die to go from 𝑁 individuals of type i to 𝑁− 1? What else needs to happen?
-
[72]
Terms get multiplied when one thing AND another thing has to happen, and a decision tree maps out the combinations of things that need to happen to get a particular outcome
Use a decision tree to show how those things give you the equation 𝑃(𝑁− 1|𝑁)= ே ቀ𝑚(1 −𝑃)+ (1 −𝑚)ିே ିଵቁ. Terms get multiplied when one thing AND another thing has to happen, and a decision tree maps out the combinations of things that need to happen to get a particular outcome. Terms get added when one path OR another is able to get the outcome of...
-
[73]
The number of species in Hubbell’s local community is a balance between which two processes?
-
[74]
Which two processes is it in Hubbell’s metacommunity?
-
[75]
What are the inputs and outputs of the local community model?
-
[76]
What are the inputs of the metacommunity model?
-
[77]
They can be divided into 3 groups
The outputs of the metacommunity model are in Figures 4-12 (some of these figures are from the model, others from data). They can be divided into 3 groups. What are they, and which figures give you which one? Note to instructors, not part of reading guide: We typically divide up reading the Hubbell paper (and thus working through these reading guide quest...
-
[78]
the fact that the fitness function itself is modified by the evolutionary process
A key sentence in the first paragraph for understanding the purpose of the model/paper is “We suggest that speciation can be understood on the basis of natural selection if one takes into account the fact that the fitness function itself is modified by the evolutionary process.” This is a bit of a mouthful: instead of ignoring it, break it up into pieces ...
-
[79]
Equation 1 is written to make this a vector of numbers, each describing individuals of a different age/stage/location etc
So far we have considered differential equations where you only need one number in order to describe how many individuals there are. Equation 1 is written to make this a vector of numbers, each describing individuals of a different age/stage/location etc. This is done to make the math more general (something mathematicians love doing), but you can underst...
-
[80]
The condition of the environment at the equilibrium is denoted by Ex, which is a solution of ϱ(x,E) = 0
In the second column, a key sentence is “The condition of the environment at the equilibrium is denoted by Ex, which is a solution of ϱ(x,E) = 0”. Explain in your own words what is being done here
-
[81]
What biological process(es) is/are being described by Equation 2, as implemented in the pairwise invasibility plots on the second page and in the paper more generally?
discussion (0)
Sign in with ORCID, Apple, or X to comment. Anyone can read and Pith papers without signing in.