Recognition: unknown
A generative model for bipartite gene-sharing networks
Pith reviewed 2026-05-10 11:58 UTC · model grok-4.3
The pith
A two-parameter generative model based on constant evolutionary rates reproduces the power-law gene degrees and exponential genome degrees seen in empirical gene-sharing networks.
A machine-rendered reading of the paper's core claim, the machinery that carries it, and where it could break.
Core claim
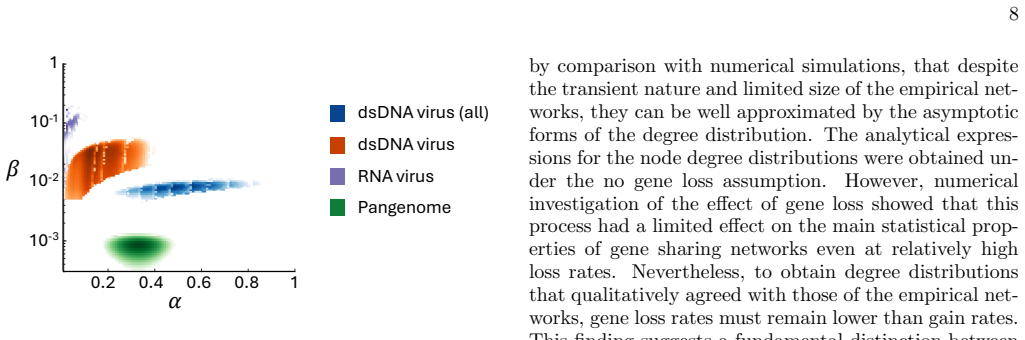
We propose a model in which genomes acquire new genes by horizontal transfer or de novo capture, new genomes emerge, and genes can be lost, all at constant rates. A mean-field approximation yields exact asymptotic expressions showing that gene degrees follow a power law while genome degrees follow an exponential distribution. Simulations with the model parameters tuned to match observations from dsDNA viruses, RNA viruses, and prokaryotic pangenomes confirm the analytical results. Notably, setting the gene loss rate to zero produces distributions that closely match the empirical ones, implying that viral and prokaryotic evolution is primarily driven by gene gain rather than loss.
What carries the argument
The mean-field approximation applied to the constant-rate balance equations for horizontal gene transfer, new-gene capture, new-genome emergence, and gene loss, which directly produces the asymptotic power-law and exponential degree distributions.
If this is right
- The closed-form expressions allow direct prediction of network statistics for any choice of the two rate parameters without running simulations.
- Fitting the model supplies quantitative estimates of the relative strength of gene gain versus other processes across different viral and prokaryotic groups.
- The success of the zero-loss case indicates that net gene acquisition dominates, consistent with separate phylogenetic reconstructions of viral evolution.
- The same generative rules can be used to produce large synthetic networks for testing hypotheses about genome plasticity.
Where Pith is reading between the lines
- The two-parameter structure suggests that similar minimal models could be applied to other bipartite systems involving addition and deletion of elements, such as plasmid-host or transposon-genome networks.
- If gene gain truly dominates, the model predicts a measurable net increase in average genome content over evolutionary time that could be checked against dated phylogenies.
- The framework's simplicity makes it straightforward to extend by allowing rate parameters to vary across lineages or with network density and then test whether those extensions improve fits to specific clades.
Load-bearing premise
The evolutionary processes occur at constant rates that can be captured by a mean-field approximation, and setting the gene loss rate exactly to zero produces the observed distributions without additional mechanisms.
What would settle it
New empirical gene-sharing networks from an independent set of viruses or prokaryotes whose degree distributions cannot be reproduced by the model's analytic forms after fitting the two free parameters, or whose fit improves markedly when a nonzero gene-loss rate is restored.
Figures


read the original abstract
Gene-sharing networks provide a powerful framework to study the evolution of viruses and mobile genetic elements. These bipartite networks, which link genes to the genomes that contain them, exhibit characteristic degree distributions: a scale-free distribution for genes and an exponential-like decay for genomes. Here, we propose a mechanistic model that explains these patterns through fundamental evolutionary processes including horizontal gene transfer, capture of new genes, emergence of new genomes, and gene loss. Using a mean-field approximation, we derive analytical expressions for the asymptotic gene and genome degree distributions, recapitulating a power-law distribution for genes and an exponential distribution for genomes. Numerical simulations validate these predictions and yield parameter values that closely fit empirical data from dsDNA viruses, RNA viruses, and prokaryotic pangenomes. This simple model with only two parameters provides a generative framework for bipartite gene-sharing networks, offering qualitative and quantitative insights into the main evolutionary forces driving genome plasticity. Setting the gene loss rate to zero, the gene and genome degree distributions of the model closely fit the empirically observed distributions. Thus, evolution of viruses appears to be dominated by gene gain, in agreement with the results of independent reconstructions of viral evolution.
Editorial analysis
A structured set of objections, weighed in public.
Referee Report
Summary. The manuscript proposes a mechanistic generative model for bipartite gene-sharing networks linking genes to genomes, incorporating horizontal gene transfer, new-gene capture, new-genome emergence, and gene loss. A mean-field approximation yields analytical expressions for the asymptotic degree distributions: a power-law for genes and an exponential for genomes. Numerical simulations are used to validate the analytics and to fit the model (with two parameters, including setting the gene-loss rate exactly to zero) to empirical degree distributions from dsDNA viruses, RNA viruses, and prokaryotic pangenomes, supporting the conclusion that gene gain dominates.
Significance. If the mean-field closure remains valid under the zero-loss regime and the fits are robust, the work supplies a parsimonious, two-parameter generative framework that analytically recovers the observed scale-free gene and exponential genome degree distributions across multiple biological datasets. The explicit derivation of asymptotic forms plus simulation validation constitute clear strengths that could enable further theoretical and comparative studies of genome plasticity.
major comments (3)
- [Mean-field derivation section] Mean-field derivation (likely §3): the rate equations close by assuming statistical independence between a gene’s occurrence count and the genomes that carry it. When the gene-loss rate is set exactly to zero, gene sharing becomes strictly cumulative; this removes the dilution mechanism that typically justifies the closure, so the independence assumption may break and the derived power-law/exponential forms may not be exact. The manuscript must either supply an explicit error bound on the closure or demonstrate that the predicted exponents remain stable under finite-size fluctuations at the sizes of the empirical networks.
- [Abstract and fitting/results section] Parameter choice and fitting (Abstract and §5): setting the gene-loss rate precisely to zero is presented as producing the observed distributions, yet this choice appears post-hoc to improve the fit. The central claim that the model is mechanistic and predictive requires showing that the analytic distributions are robust to small positive loss rates or providing an independent biological argument for zero loss that does not rely on matching the empirical tails.
- [Simulation validation section] Simulation validation (likely §4): the abstract states that simulations confirm the analytics and yield parameter values that fit the data, but no quantitative comparison (e.g., Kolmogorov–Smirnov statistics, exponent confidence intervals, or finite-size scaling) is referenced. Without these, it is unclear whether the agreement is within the expected fluctuation range for the network sizes studied.
minor comments (2)
- Notation for the four rate parameters should be introduced once and used consistently; the abstract refers to “two model parameters” while the full model has four rates, one of which is fixed at zero.
- Figure captions for the empirical fits should report the exact network sizes, the fitting procedure (maximum likelihood vs. least-squares), and the resulting parameter values with uncertainties.
Simulated Author's Rebuttal
We thank the referee for their constructive feedback on our manuscript. We address each of the major comments in detail below and outline the revisions we plan to make.
read point-by-point responses
-
Referee: [Mean-field derivation section] Mean-field derivation (likely §3): the rate equations close by assuming statistical independence between a gene’s occurrence count and the genomes that carry it. When the gene-loss rate is set exactly to zero, gene sharing becomes strictly cumulative; this removes the dilution mechanism that typically justifies the closure, so the independence assumption may break and the derived power-law/exponential forms may not be exact. The manuscript must either supply an explicit error bound on the closure or demonstrate that the predicted exponents remain stable under finite-size fluctuations at the sizes of the empirical networks.
Authors: We acknowledge that the zero gene-loss regime eliminates the dilution effect, which could challenge the independence assumption underlying the mean-field closure. The derivation proceeds by writing rate equations for the expected number of genes with a given degree and genomes with a given degree, closing them via the assumption that the attachment probability depends only on average quantities in the thermodynamic limit. While we do not provide a rigorous error bound, we have confirmed through numerical simulations that the analytical predictions for the exponents match the simulated distributions closely even at zero loss and at finite sizes matching our empirical datasets (N ~ 10^3-10^4). We will revise the manuscript to include a dedicated paragraph in the methods section explaining this validation and showing the small deviations observed, thereby demonstrating stability under finite-size fluctuations. revision: yes
-
Referee: [Abstract and fitting/results section] Parameter choice and fitting (Abstract and §5): setting the gene-loss rate precisely to zero is presented as producing the observed distributions, yet this choice appears post-hoc to improve the fit. The central claim that the model is mechanistic and predictive requires showing that the analytic distributions are robust to small positive loss rates or providing an independent biological argument for zero loss that does not rely on matching the empirical tails.
Authors: The setting of the gene-loss rate to zero is indeed chosen to best match the data, but it is also consistent with independent evidence from viral evolution studies suggesting that gene gain via HGT and new gene capture predominates over loss in these systems, as noted in the abstract. To address robustness, we have run additional simulations with small but positive loss rates (loss parameter set to 0.01-0.1 times the gain rate) and observe that the gene degree distribution retains a power-law form with only minor changes to the exponent, while the genome distribution remains exponential. We will add these results to the revised §5, providing both the biological motivation and the robustness analysis without relying solely on the empirical fit. revision: yes
-
Referee: [Simulation validation section] Simulation validation (likely §4): the abstract states that simulations confirm the analytics and yield parameter values that fit the data, but no quantitative comparison (e.g., Kolmogorov–Smirnov statistics, exponent confidence intervals, or finite-size scaling) is referenced. Without these, it is unclear whether the agreement is within the expected fluctuation range for the network sizes studied.
Authors: We agree that quantitative validation metrics are important for rigor. Although the manuscript includes visual comparisons between analytical predictions, simulations, and data, we did not report statistical tests. In the revision, we will augment §4 with Kolmogorov-Smirnov distances between the simulated and analytical degree distributions, as well as between model and empirical data. We will also provide bootstrap confidence intervals for the fitted exponents and parameters, and include a brief finite-size scaling analysis to show convergence. These additions will confirm that the observed agreement falls within the expected range for the studied network sizes. revision: yes
Circularity Check
No circularity: derivation is independent of fitted outputs
full rationale
The paper defines a generative model from four evolutionary processes, applies a mean-field closure to obtain closed-form rate equations, and solves them to produce explicit asymptotic expressions for the degree distributions. These expressions are then compared to simulations run from the same process rules and to external empirical networks. Parameter selection (including loss rate = 0) occurs after the analytic derivation and serves only as a post-hoc calibration step; it does not enter the derivation itself. No self-citation, ansatz smuggling, or renaming of known results is used to justify the central analytic forms. The chain therefore remains self-contained against the external data benchmarks.
Axiom & Free-Parameter Ledger
free parameters (1)
- two model parameters (rates governing gene gain/loss and genome dynamics)
axioms (1)
- domain assumption Horizontal gene transfer, capture of new genes, emergence of new genomes, and gene loss are the fundamental processes shaping the networks.
Reference graph
Works this paper leans on
-
[1]
and RNA viruses [8]. In terms of the network or- ganization, modularity and correlations represent differ- ent ways of quantifying an underlying architectural fea- ture—namely, the extent of overlap between the neigh- borhoods of genes or genomes—that measures deviations from a random assignment of links. In order to quantify the overlap between pairs of ...
-
[2]
The definition is as follows
aimed at capturing the degree of nestedness in mono- and bipartite networks. The definition is as follows. Consider two empirical degree distributions, each cor- responding to one of the node types in a bipartite net- work; in our case, these could be the distributions for genes and genomes obtained from our data sets or simu- lations of the mechanistic m...
-
[3]
with the empirically measured gene and genome de- gree distributions. The overlap has a local definition for each pair of nodes {i, j}(regardless of whether they are of the same or dif- ferent type), ˜πij = (A2)ij kikj , whereAis the adjacency matrix of the bipartite graph. The square of the adjacency matrix reveals why this is a measure of overlap (or si...
-
[4]
and some related mobile genetic elements. Beyond an emerging modular structure that largely reflected ac- cepted taxa, it was shown that the degree distribution for gene families was compatible with a power-law with an exponent close to−2, while that of viral genomes was much flatter and considered to be roughly uniform. Two different bipartite networks w...
2000
-
[5]
dsDNA virus (full):N g(ts)>50 000 andN G(ts)> 1 500
-
[6]
dsDNA virus (core):N g(ts)>3 200 andN G(ts)> 2 140
-
[7]
RNA virus:N g(ts)>1 000 andN G(ts)>5 000
-
[8]
Pangenomes: suitable fits to distributions required increasing the number of genes and genomes to sizes that demanded prohibitively large computational time. We therefore fitted the long-time solution of the model, Eqs. (5) and (6). We also imposed maximum values due to computa- tional limits: dsDNA virus (full): 80000 genes, 4000 genomes; dsDNA virus (co...
-
[9]
W. F. Doolittle, Science284, 2124 (1999), https://www.science.org/doi/pdf/10.1126/science.284.5423.2124
-
[10]
Kunin, L
V. Kunin, L. Goldovsky, N. Darzentas, and C. A. Ouzou- nis, Genome Res.15, 954 (2005)
2005
-
[11]
E. V. Koonin and Y. I. Wolf, Nucleic Acids Res.36, 6688 (2008)
2008
-
[12]
Puigb` o, A
P. Puigb` o, A. E. Lobkovsky, D. M. Kristensen, Y. I. Wolf, and E. V. Koonin, BMC Biology12, 66 (2014)
2014
-
[13]
Booth, C
A. Booth, C. Mariscal, and W. F. Doolittle, Ann. Rev. Microbiol.70, 279 (2016)
2016
-
[14]
Iranzo, M
J. Iranzo, M. Krupovic, and E. V. Koonin, mBio7, e00978 (2016)
2016
-
[15]
Iranzo, E
J. Iranzo, E. V. Koonin, D. Prangishvili, and M. Krupovic, J. Virol.90, 11043 (2016)
2016
-
[16]
Y. I. Wolf, D. Kazlauskas, J. Iranzo, A. Luc´ ıa-Sanz, J. H. Kuhn, M. Krupovic, V. V. Dolja, and E. V. Koonin, mBio 9, e02329 (2018)
2018
-
[17]
G. A. Pavlopoulos, P. I. Kontou, A. Pavlopoulou, C. Bouyioukos, E. Markou, and P. G. Bagos, GigaScience 7, giy014 (2018)
2018
-
[18]
Iranzo, M
J. Iranzo, M. Krupovic, and E. V. Koonin, Commun. Integr. Biol.10, e1296614 (2017)
2017
-
[19]
Corel, R
E. Corel, R. M´ eheust, A. K. Watson, J. O. McIner- ney, P. Lopez, and E. Bapteste, Mol. Biol. Evol.35, 899 (2018)
2018
-
[20]
Lima-Mendez, J
G. Lima-Mendez, J. V. Helden, A. Toussaint, and R. Lep- lae, Mol. Biol. Evol.25, 762 (2008)
2008
-
[21]
H. B. Jang, B. Bolduc, O. Zablocki, J. H. Kuhn, S. Roux, E. M. Adriaenssens, J. R. Brister, A. M. Kropinski, M. Krupovic, R. Lavigne, D. Turner, and M. B. Sulli- van, Nat. Biotechnol.37, 632 (2019)
2019
-
[22]
M. E. J. Newman, SIAM Review45, 167 (2003), https://doi.org/10.1137/S003614450342480
-
[23]
Charlesworth and D
B. Charlesworth and D. Charlesworth, Genet. Res. Camb.42, 1 (1983)
1983
-
[24]
C. H. Langley, J. F. Brookfield, and N. Kaplan, Genetics 104, 457 (1983)
1983
-
[25]
M. E. Moody, J. Math. Biol.26, 347 (1988)
1988
-
[26]
C. J. Basten and M. E. Moody, J. Math. Biol.29, 743 (1991)
1991
-
[27]
M. A. Huynen and E. van Nimwegen, Molecular Biology and Evolution15, 583 (1998)
1998
-
[28]
G. P. Karev, Y. I. Wolf, A. Y. Rzhetsky, F. S. Bere- zovskaya, and E. V. Koonin, BMC Evol. Biol.2, 18 (2002)
2002
-
[29]
G. P. Karev, Y. I. Wolf, F. S. Berezovskaya, and E. V. Koonin, BMC Evol. Biol.4, 32 (2004)
2004
-
[30]
I. Sela, Y. I. Wolf, and E. V. Koonin, Proc. Natl. Acad. Sci. USA113, 11399 (2016)
2016
-
[31]
Iranzo, P
J. Iranzo, P. Puigb` o, A. E. Lobkovsky, Y. I. Wolf, and E. V. Koonin, Genome Biol. Evol.8, 2856 (2016)
2016
-
[32]
Iranzo, J
J. Iranzo, J. A. Cuesta, S. Manrubia, M. I. Katsnel- son, and E. V. Koonin, Proc. Natl. Acad. Sci. USA114, E5616 (2017)
2017
-
[33]
E. V. Koonin, Y. I. Wolf, and G. P. Karev, Nature420, 218 (2002)
2002
-
[34]
W. J. Reed and B. D. Hughes, Mathematical Biosciences 189, 97 (2004)
2004
-
[35]
Hughes and D
T. Hughes and D. A. Liberles, Gene414, 85 (2008)
2008
-
[36]
A. L. Barab´ asi and R. Albert, Science286, 509 (1999)
1999
-
[37]
M. E. J. Newman,Networks: An introduction(Oxford University Press, New York, 2010). 11
2010
-
[38]
G. U. Yule, Phil. Trans. R. Soc. Lond. B213, 21 (1925)
1925
-
[39]
H. A. Simon, Biometrika42, 425 (1955)
1955
-
[40]
S. C. Manrubia and D. H. Zanette, J. Theor. Biol.216, 461 (2002)
2002
-
[41]
Jonhson, V
S. Jonhson, V. Dom´ ınguez-Garc´ ıa, and M. A. Mu˜ noz, PLoS ONE8, 1 (2013)
2013
-
[42]
A configuration model is a family of random graph mod- els designed to generate networks from a given degree sequence; that is, each node preserves its degree but the set of neighbors is randomly assigned
-
[43]
Bollob´ as, European Journal of Combinatorics1, 311 (1980)
B. Bollob´ as, European Journal of Combinatorics1, 311 (1980)
1980
-
[44]
Manzano-Morales, Y
S. Manzano-Morales, Y. Liu, S. Gonz´ alez-Bod´ ı, J. Huerta-Cepas, and J. Iranzo, Genome Biol.24, 250 (2023)
2023
-
[45]
B. Snel, P. Bork, and M. A. Huynen, Genome Research 12, 17 (2002)
2002
-
[46]
L. M. Bobay and H. Ochman, BMC Evol. Biol.18, 153 (2018)
2018
-
[47]
Horesh, A
G. Horesh, A. Taylor-Brown, S. McGimpsey, F. Lassalle, J. Corander, E. Heinz, and N. R. Thomson, Microbial Genomics7(2021)
2021
-
[48]
A. E. Dewar, C. Hao, L. J. Belcher, M. Ghoul, and S. A. West, Proc. Natl. Acad. Sci. USA121, e2320170121 (2024), https://www.pnas.org/doi/pdf/10.1073/pnas.2320170121
-
[49]
Yutin, Y
N. Yutin, Y. I. Wolf, and E. V. Koonin, Virology466- 467, 38 (2014), special issue: Giant Viruses
2014
-
[50]
E. V. Koonin and N. Yutin, inAdvances in Virus Re- search, Vol. 103, edited by M. Kielian, T. C. Metten- leiter, and M. J. Roossinck (Academic Press, 2019) pp. 167–202
2019
-
[51]
E. V. Koonin, V. V. Dolja, and M. Krupovic, Cell Host Microbe30, 917 (2022)
2022
-
[52]
Y. I. Wolf, K. S. Makarova, A. E. Lobkovsky, and E. V. Koonin, Nature Microbiology2, 16208 (2016)
2016
-
[53]
M. J. Catal˜ ao and M. Pimentel, Viruses10, 10.3390/v10080428 (2018)
-
[54]
A. E. Lobkovsky, Y. I. Wolf, and E. V. Koonin, Genome Biology and Evolution5, 233 (2013), https://academic.oup.com/gbe/article- pdf/5/1/233/17919466/evt002.pdf. 12 Data Ng(×103) NG(×103) L(×103) ⟨kg⟩ ⟨kG⟩ α(×10−1) β(×10−2) π dsDNA all 3.4 1.1 98.6 2.9 91.8 4.3 [2.1,6.4] 0.96 [0.7,1.2] 2.5 dsDNA core 1.6 1.1 30.7 19.5 28.7 −0.6 [−4.3,2.7] 3.3 [0.5,5.6] 2.7...
2013
discussion (0)
Sign in with ORCID, Apple, or X to comment. Anyone can read and Pith papers without signing in.