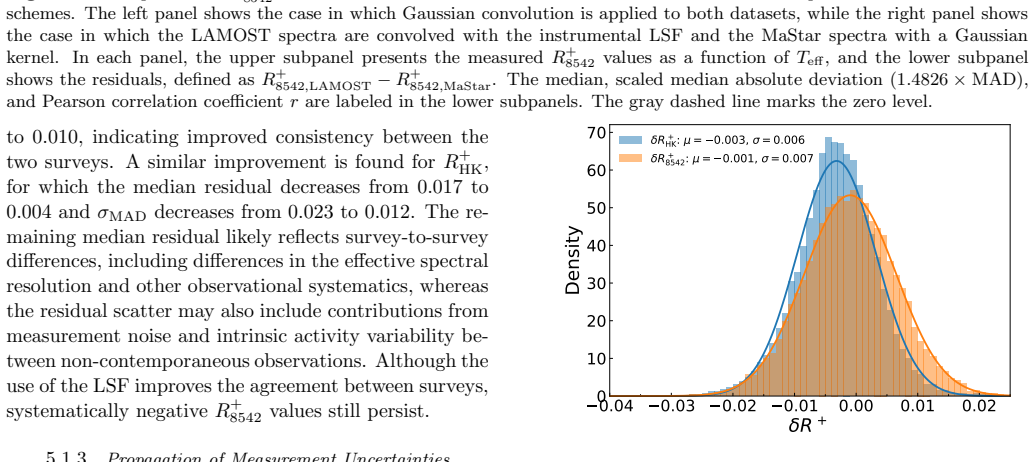
Recognition: unknown
Revisiting Ca II Activity Indices in FGK Stars: Systematic Biases in Infrared Triplet Measurements
Pith reviewed 2026-05-10 10:37 UTC · model grok-4.3
The pith
Photospheric templates underestimate the depth of Ca II infrared triplet cores, producing systematically negative residual activity indices in solar-like stars.
A machine-rendered reading of the paper's core claim, the machinery that carries it, and where it could break.
Core claim
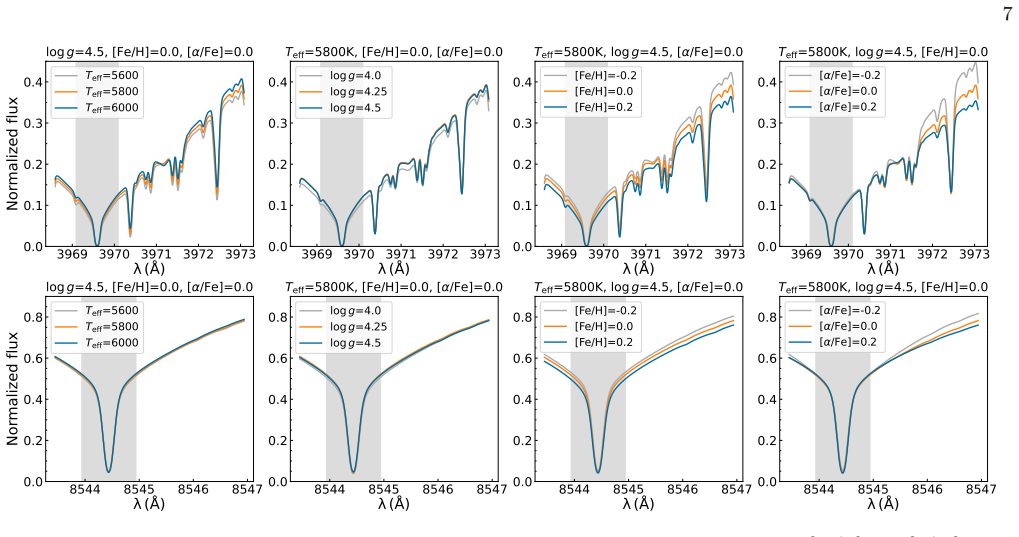
Synthetic photospheric templates underestimate the absorption depth of the Ca II IRT line cores in solar-like FGK stars, most likely because they omit chromospheric contributions and, to a lesser extent, NLTE effects. This template inadequacy produces the observed negative bias in the residual index R+_IRT, whereas the same procedure applied to the Ca II H&K lines does not show the same systematic offset.
What carries the argument
Synthetic-template subtraction used to isolate the chromospheric excess in Ca II lines and compute the residual activity index R+.
If this is right
- Atmospheric-parameter offsets and instrumental effects contribute only to random scatter, not the systematic negative bias.
- Raising the microturbulent velocity in the synthetic models deepens the IRT cores and partially corrects the offset.
- Activity indices derived from different synthesis configurations exhibit systematic zero-point shifts yet retain tight linear correlations, enabling cross-calibration across surveys.
- The bias is intrinsic to the template construction rather than to the measurement process itself.
Where Pith is reading between the lines
- Survey pipelines that rely on standard photospheric libraries may need empirical microturbulence adjustments or hybrid photosphere-plus-chromosphere templates to avoid underestimating activity in the IRT.
- The same template shortfall could subtly affect other infrared lines used for activity or abundance work in large spectroscopic catalogs.
- Testing the proposed correction on stars with independent activity indicators, such as H-alpha or X-ray flux, would quantify how much of the residual scatter is removed.
Load-bearing premise
That parameter-matched synthetic spectra fully represent the pure photospheric contribution to the line cores without any chromospheric filling or NLTE adjustments.
What would settle it
A direct comparison of observed IRT cores against synthetic spectra that explicitly include a chromospheric temperature rise or full NLTE treatment, checking whether the negative R+_IRT bias disappears across a large sample of inactive and active FGK stars.
Figures


read the original abstract
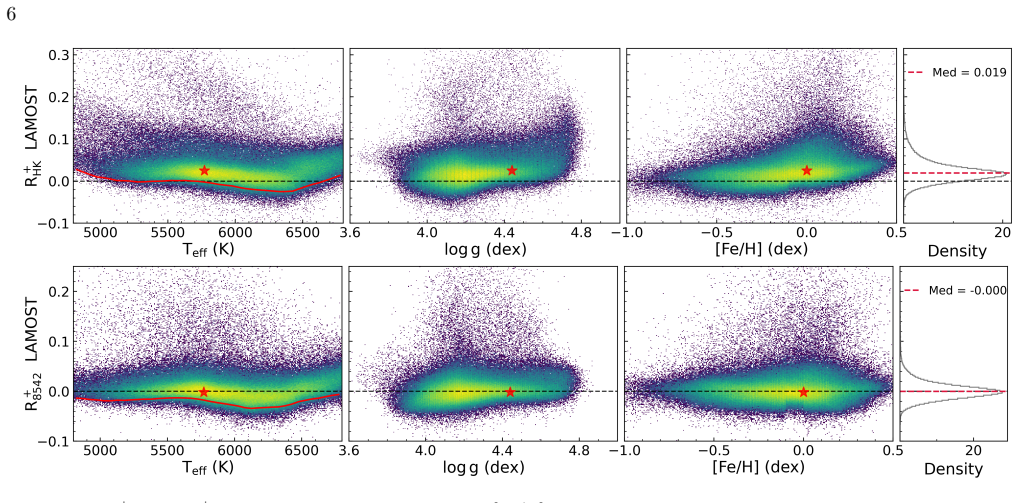
Synthetic-template subtraction is widely used to measure chromospheric activity in large spectroscopic surveys. However, many solar-like FGK stars show systematically negative Ca II infrared triplet (IRT) residual indices, implying that the observed line cores are deeper than those predicted by parameter-matched templates. We investigate this effect using solar-like stars from LAMOST DR9, MaStar, and XSL DR3, measuring activity indices (R+) for both the Ca II H&K and IRT lines in a uniform framework. We find that observational effects, including atmospheric-parameter offsets, treatment of the instrumental line-spread function, and propagated measurement uncertainties, contribute to scatter but do not explain the systematic negative bias in R+_IRT. The results instead suggest that the negative bias most likely arises because photospheric templates underestimate the depth of the IRT cores, likely owing to missing chromospheric structure and, to a lesser extent, NLTE effects. An empirical increase in the adopted microturbulent velocity deepens the synthetic IRT cores and partially mitigates the negative offset. In addition, R+ values derived from different synthesis configurations show systematic offsets but generally preserve strong linear correlations, indicating that they can be cross-calibrated. These results clarify the origin of negative Ca II IRT residual indices and help interpret template-dependent systematics in chromospheric activity measurements based on synthetic-template subtraction.
Editorial analysis
A structured set of objections, weighed in public.
Referee Report
Summary. The manuscript investigates systematic negative biases observed in Ca II infrared triplet (IRT) residual activity indices (R'_IRT) when subtracting synthetic photospheric templates from FGK star spectra. Using a uniform pipeline on solar-like stars from LAMOST DR9, MaStar, and XSL DR3, the authors measure R' indices for both Ca II H&K and IRT lines. They test and rule out contributions from atmospheric-parameter mismatches, instrumental line-spread function treatment, and propagated uncertainties. The central conclusion is that photospheric templates underestimate IRT core depths, likely due to missing chromospheric structure and NLTE effects; an empirical increase in microturbulent velocity is shown to deepen the synthetic cores and partially mitigate the negative offset. Different synthesis configurations produce offset but strongly correlated R' values, supporting cross-calibration.
Significance. If the observational result on the bias and its partial mitigation holds, the paper provides a useful clarification for chromospheric activity studies in large spectroscopic surveys, where the IRT is often preferred for its wavelength accessibility. Credit is due for the multi-survey approach, consistent measurement framework, and explicit tests of observational confounders, which support the empirical findings. The work aids interpretation of template-dependent systematics and offers a practical adjustment, though the physical attribution requires refinement.
major comments (1)
- [Abstract and Discussion] Abstract and Discussion: The claim that the negative R'_IRT bias arises because photospheric templates underestimate the depth of the IRT cores, 'likely owing to missing chromospheric structure and, to a lesser extent, NLTE effects,' conflicts with standard line-formation expectations. A chromospheric temperature rise increases the source function in the core, filling in the absorption and producing shallower observed cores than a pure-photosphere template; this predicts positive rather than negative residuals. The manuscript rules out parameter offsets, LSF, and noise but does not include forward modeling with chromospheric or NLTE-adjusted spectra to demonstrate that any such effect can produce deeper observed cores. The microturbulence adjustment is presented as an empirical mitigation rather than a test of the proposed mechanism, leaving the central attribution under-supported.
minor comments (2)
- [Methods] Methods: While the uniform pipeline is a strength, the exact definition of the R' index (including normalization and any scaling) and the specific wavelength windows for continuum and line measurements should be stated more explicitly to ensure full reproducibility across surveys.
- [Results/Figures] Figures: The correlation plots between R' values from different synthesis configurations would benefit from reporting the fitted slopes, intercepts, and scatter metrics to quantify the 'systematic offsets' described in the text.
Simulated Author's Rebuttal
We thank the referee for the constructive review and for recognizing the value of the multi-survey empirical analysis. The major comment correctly identifies that our physical attribution of the negative R'_IRT bias is tentative and would benefit from clearer caveats. We address the concern directly below and will revise the manuscript to strengthen the discussion while preserving the observational results.
read point-by-point responses
-
Referee: [Abstract and Discussion] Abstract and Discussion: The claim that the negative R'_IRT bias arises because photospheric templates underestimate the depth of the IRT cores, 'likely owing to missing chromospheric structure and, to a lesser extent, NLTE effects,' conflicts with standard line-formation expectations. A chromospheric temperature rise increases the source function in the core, filling in the absorption and producing shallower observed cores than a pure-photosphere template; this predicts positive rather than negative residuals. The manuscript rules out parameter offsets, LSF, and noise but does not include forward modeling with chromospheric or NLTE-adjusted spectra to demonstrate that any such effect can produce deeper observed cores. The microturbulence adjustment is presented as an empirical mitigation rather than a test of the proposed mechanism, leaving the central attribu
Authors: We thank the referee for this insightful observation. Our conclusion is primarily empirical: after systematically excluding atmospheric-parameter mismatches, LSF treatment, and uncertainty propagation, the data show that observed IRT cores are deeper than those in parameter-matched photospheric templates. We agree that a simple chromospheric temperature rise would increase the source function and produce shallower cores (positive residuals), which is the opposite of what is observed. However, realistic chromospheric models incorporate additional physics—such as velocity fields, microturbulence enhancements, shocks, and NLTE level populations—that can deepen the cores for the Ca II IRT in certain regimes. The empirical v_turb increase we demonstrate acts as a proxy for these effects and partially removes the offset, providing supporting evidence even without full forward modeling. We acknowledge that the manuscript does not contain explicit chromospheric or NLTE forward models, which leaves the precise mechanism under-constrained. We will revise the abstract and discussion to (i) emphasize the empirical nature of the bias detection, (ii) note that the proposed attribution is tentative and requires dedicated modeling for confirmation, and (iii) clarify that the microturbulence adjustment is a practical mitigation rather than a direct test of the mechanism. These changes will be made without altering the reported measurements or the conclusion that the bias is intrinsic to the template subtraction. revision: yes
Circularity Check
No circularity; analysis is observational and data-driven
full rationale
The paper derives its central result—the existence and likely origin of a systematic negative bias in R+_IRT—by direct subtraction of parameter-matched synthetic templates from observed spectra across LAMOST DR9, MaStar, and XSL DR3 samples. Residual indices are computed and compared without any quantity being fitted to a subset and then re-labeled as a prediction. The empirical microturbulence adjustment is explicitly described as a post-hoc mitigation rather than a derived claim. No self-citations, uniqueness theorems, or ansatzes are invoked to close the argument; the negative bias is measured from the data residuals themselves, rendering the derivation self-contained.
Axiom & Free-Parameter Ledger
free parameters (1)
- microturbulent velocity increase
axioms (2)
- domain assumption Synthetic photospheric templates accurately capture the continuum and line wings without chromospheric contributions
- domain assumption Atmospheric parameters from surveys are sufficiently accurate for template matching
Reference graph
Works this paper leans on
-
[1]
Abdurro’uf, Accetta, K., Aerts, C., et al. 2022, ApJS, 259, 35, doi: 10.3847/1538-4365/ac4414
-
[2]
Allard, F., Homeier, D., & Freytag, B. 2011, in Astronomical Society of the Pacific Conference Series, Vol. 448, 16th Cambridge Workshop on Cool Stars, Stellar Systems, and the Sun, ed. C. Johns-Krull, M. K. Browning, & A. A. West, 91, doi: 10.48550/arXiv.1011.5405
-
[3]
Rajpurohit, A. S. 2013, Memorie della Societa Astronomica Italiana Supplementi, 24, 128, doi: 10.48550/arXiv.1302.6559
-
[4]
1998, A&A, 330, 1109, doi: 10.48550/arXiv.astro-ph/9710157
Alvarez, R., & Plez, B. 1998, A&A, 330, 1109, doi: 10.48550/arXiv.astro-ph/9710157
work page internal anchor Pith review doi:10.48550/arxiv.astro-ph/9710157 1998
-
[5]
Andretta, V., Bus` a, I., Gomez, M. T., & Terranegra, L. 2005, A&A, 430, 669, doi: 10.1051/0004-6361:20041745
-
[6]
Arentsen, A., Prugniel, P., Gonneau, A., et al. 2019, A&A, 627, A138, doi: 10.1051/0004-6361/201834273
-
[7]
Asplund, M., Grevesse, N., Sauval, A. J., & Scott, P. 2009, ARA&A, 47, 481, doi: 10.1146/annurev.astro.46.060407.145222 Astropy Collaboration, Robitaille, T. P., Tollerud, E. J., et al. 2013, A&A, 558, A33, doi: 10.1051/0004-6361/201322068 Astropy Collaboration, Price-Whelan, A. M., Sip˝ ocz, B. M., et al. 2018, AJ, 156, 123, doi: 10.3847/1538-3881/aabc4f...
-
[8]
Avrett, E. H., & Loeser, R. 2008, ApJS, 175, 229, doi: 10.1086/523671
-
[9]
Baliunas, S. L., Donahue, R. A., Soon, W. H., et al. 1995, ApJ, 438, 269, doi: 10.1086/175072
-
[10]
2011, ApJ, 733, 65, doi: 10.1088/0004-637X/733/1/65 Bjørgen, J
Marois, C. 2011, ApJ, 733, 65, doi: 10.1088/0004-637X/733/1/65 Bjørgen, J. P., Sukhorukov, A. V., Leenaarts, J., et al. 2018, A&A, 611, A62, doi: 10.1051/0004-6361/201731926
-
[11]
2019, MNRAS, 486, 2075, doi: 10.1093/mnras/stz549
Blanco-Cuaresma, S. 2019, MNRAS, 486, 2075, doi: 10.1093/mnras/stz549
-
[12]
2014, A&A, 569, A111, doi: 10.1051/0004-6361/201423945
Blanco-Cuaresma, S., Soubiran, C., Heiter, U., & Jofr´ e, P. 2014a, A&A, 569, A111, doi: 10.1051/0004-6361/201423945
-
[13]
Blanco-Cuaresma, S., Soubiran, C., Jofr´ e, P., & Heiter, U. 2014b, A&A, 566, A98, doi: 10.1051/0004-6361/201323153 Bus` a, I., Aznar Cuadrado, R., Terranegra, L., Andretta, V., & Gomez, M. T. 2007, A&A, 466, 1089, doi: 10.1051/0004-6361:20065588
-
[14]
Castelli, F., & Kurucz, R. L. 2003, in IAU Symposium, Vol. 210, Modelling of Stellar Atmospheres, ed. N. Piskunov, W. W. Weiss, & D. F. Gray, A20, doi: 10.48550/arXiv.astro-ph/0405087
work page internal anchor Pith review doi:10.48550/arxiv.astro-ph/0405087 2003
-
[15]
2009, A&A, 503, 577, doi: 10.1051/0004-6361/200811595
Uitenbroek, H. 2009, A&A, 503, 577, doi: 10.1051/0004-6361/200811595
-
[16]
Ciddor, P. E. 1996, ApOpt, 35, 1566, doi: 10.1364/AO.35.001566
-
[17]
Cui, X.-Q., Zhao, Y.-H., Chu, Y.-Q., et al. 2012, Research in Astronomy and Astrophysics, 12, 1197, doi: 10.1088/1674-4527/12/9/003 de Grijs, R., & Kamath, D. 2021, Universe, 7, 440, doi: 10.3390/universe7110440
-
[18]
Duncan, D. K., Vaughan, A. H., Wilson, O. C., et al. 1991, ApJS, 76, 383, doi: 10.1086/191572
-
[19]
Fontenla, J. M., Linsky, J. L., Garrison, J., et al. 2016, ApJ, 830, 154, doi: 10.3847/0004-637X/830/2/154 Gaia Collaboration, Prusti, T., de Bruijne, J. H. J., et al. 2016, A&A, 595, A1, doi: 10.1051/0004-6361/201629272 Gaia Collaboration, Vallenari, A., Brown, A. G. A., et al. 2023, A&A, 674, A1, doi: 10.1051/0004-6361/202243940 Garc´ ıa P´ erez, A. E.,...
-
[20]
Gray, D. F. 2008, The Observation and Analysis of Stellar Photospheres
2008
-
[21]
Gray, R. O., & Corbally, C. J. 1994, AJ, 107, 742, doi: 10.1086/116893
-
[22]
Grevesse, N., Asplund, M., & Sauval, A. J. 2007, SSRv, 130, 105, doi: 10.1007/s11214-007-9173-7
-
[23]
Gustafsson, B., Edvardsson, B., Eriksson, K., et al. 2008, A&A, 486, 951, doi: 10.1051/0004-6361:200809724
-
[24]
Hall, J. C., Lockwood, G. W., & Skiff, B. A. 2007, AJ, 133, 862, doi: 10.1086/510356
-
[25]
Harris, C. R., Millman, K. J., van der Walt, S. J., et al. 2020, Nature, 585, 357, doi: 10.1038/s41586-020-2649-2
-
[26]
H., Barman, T., Baron, E., Aufdenberg, J
Hauschildt, P. H., Barman, T., Baron, E., Aufdenberg, J. P., & Schweitzer, A. 2025, A&A, 698, A47, doi: 10.1051/0004-6361/202554171
-
[27]
Hauschildt, P. H., & Baron, E. 1999, Journal of Computational and Applied Mathematics, 109, 41, doi: 10.48550/arXiv.astro-ph/9808182
-
[28]
Hayden, M. R., Bovy, J., Holtzman, J. A., et al. 2015, ApJ, 808, 132, doi: 10.1088/0004-637X/808/2/132
-
[29]
2015, PhyS, 90, 054010, doi: 10.1088/0031-8949/90/5/054010 Hillsand Day
Heiter, U., Lind, K., Asplund, M., et al. 2015, PhyS, 90, 054010, doi: 10.1088/0031-8949/90/5/054010
-
[30]
2022, MNRAS, 509, 4308, doi: 10.1093/mnras/stab3263 22
Hill, L., Thomas, D., Maraston, C., et al. 2022, MNRAS, 509, 4308, doi: 10.1093/mnras/stab3263 22
-
[31]
2024, ApJS, 272, 6, doi: 10.3847/1538-4365/ad33bc
Huang, X., He, Y., Bai, Z., et al. 2024, ApJS, 272, 6, doi: 10.3847/1538-4365/ad33bc
-
[32]
Hunter, J. D. 2007, Computing in Science & Engineering, 9, 90, doi: 10.1109/MCSE.2007.55
-
[33]
2013, A&A, 553, A6, doi: 10.1051/0004-6361/201219058
Husser, T. O., Wende-von Berg, S., Dreizler, S., et al. 2013, A&A, 553, A6, doi: 10.1051/0004-6361/201219058
-
[34]
Imig, J., Holtzman, J. A., Yan, R., et al. 2022, AJ, 163, 56, doi: 10.3847/1538-3881/ac3ca7 J¨ onsson, H., Holtzman, J. A., Allende Prieto, C., et al. 2020, AJ, 160, 120, doi: 10.3847/1538-3881/aba592
-
[35]
2021, MNRAS, 501, 5176, doi: 10.1093/mnras/staa3996
Khoperskov, S., Haywood, M., Snaith, O., et al. 2021, MNRAS, 501, 5176, doi: 10.1093/mnras/staa3996
-
[36]
Kordopatis, G., Wyse, R. F. G., Gilmore, G., et al. 2015, A&A, 582, A122, doi: 10.1051/0004-6361/201526258
-
[37]
Kupka, F., Dubernet, M. L., & VAMDC Collaboration. 2011, Baltic Astronomy, 20, 503, doi: 10.1515/astro-2017-0328 Lan¸ con, A., Gonneau, A., Verro, K., et al. 2021, A&A, 649, A97, doi: 10.1051/0004-6361/202039371
-
[38]
Landstreet, J. D., Kupka, F., Ford, H. A., et al. 2009, A&A, 503, 973, doi: 10.1051/0004-6361/200912083
-
[39]
C., Brugaletta, E., Fr´ emat, Y., et al
Lanzafame, A. C., Brugaletta, E., Fr´ emat, Y., et al. 2023, A&A, 674, A30, doi: 10.1051/0004-6361/202244156
-
[40]
2022, A&A, 668, A21, doi: 10.1051/0004-6361/202243701
Lazarz, D., Yan, R., Wilhelm, R., et al. 2022, A&A, 668, A21, doi: 10.1051/0004-6361/202243701
-
[41]
Linsky, J. L. 2017, ARA&A, 55, 159, doi: 10.1146/annurev-astro-091916-055327
-
[42]
Kelch, W. L. 1979a, ApJS, 41, 481, doi: 10.1086/190627
-
[43]
Linsky, J. L., Worden, S. P., McClintock, W., & Robertson, R. M. 1979b, ApJS, 41, 47, doi: 10.1086/190607
-
[44]
2026, The Astronomical Journal, 171, 256, doi: 10.3847/1538-3881/ae4ebe
Liu, Q., Bai, Z., Zhou, M., et al. 2026, The Astronomical Journal, 171, 256, doi: 10.3847/1538-3881/ae4ebe
-
[45]
L., Zhao, Y
Luo, A. L., Zhao, Y. H., Zhao, G., & et al. 2019, VizieR Online Data Catalog: LAMOST DR5 catalogs (Luo+, 2019), VizieR On-line Data Catalog: V/164. Originally published in: 2019RAA..in.prep..L
2019
-
[46]
Majewski, S. R., Schiavon, R. P., Frinchaboy, P. M., et al. 2017, AJ, 154, 94, doi: 10.3847/1538-3881/aa784d
-
[47]
Mashonkina, L., Korn, A. J., & Przybilla, N. 2007, A&A, 461, 261, doi: 10.1051/0004-6361:20065999
-
[48]
Mittag, M., Schmitt, J. H. M. M., & Schr¨ oder, K. P. 2013, A&A, 549, A117, doi: 10.1051/0004-6361/201219868
-
[49]
Mucciarelli, A. 2011, A&A, 528, A44, doi: 10.1051/0004-6361/201015814
-
[50]
Noyes, R. W., Hartmann, L. W., Baliunas, S. L., Duncan, D. K., & Vaughan, A. H. 1984, ApJ, 279, 763, doi: 10.1086/161945
-
[51]
1992, A&A, 266, 347
Pasquini, L. 1992, A&A, 266, 347
1992
-
[52]
2012, Turbospectrum: Code for spectral synthesis, Astrophysics Source Code Library, record ascl:1205.004
Plez, B. 2012, Turbospectrum: Code for spectral synthesis, Astrophysics Source Code Library, record ascl:1205.004
2012
-
[53]
Recio-Blanco, A., de Laverny, P., Palicio, P. A., et al. 2023, A&A, 674, A29, doi: 10.1051/0004-6361/202243750
-
[54]
2012, in SDO-4: Dynamics and Energetics of the Coupled Solar Atmosphere
Rutten, R. 2012, in SDO-4: Dynamics and Energetics of the Coupled Solar Atmosphere. The Synergy Between State-of-the-Art Observations and Numerical Simulations, 110
2012
-
[55]
, year = 2015, month = may, volume =
Ryabchikova, T., Piskunov, N., Kurucz, R. L., et al. 2015, PhyS, 90, 054005, doi: 10.1088/0031-8949/90/5/054005
-
[56]
Palicio, P. A. 2023, A&A, 672, A166, doi: 10.1051/0004-6361/202245606
-
[57]
Sbordone, L., Bonifacio, P., Castelli, F., & Kurucz, R. L. 2004, Memorie della Societa Astronomica Italiana Supplementi, 5, 93, doi: 10.48550/arXiv.astro-ph/0406268
work page internal anchor Pith review doi:10.48550/arxiv.astro-ph/0406268 2004
-
[58]
2012, MOOG: LTE line analysis and spectrum synthesis, Astrophysics Source Code Library, record ascl:1202.009
Sneden, C., Bean, J., Ivans, I., Lucatello, S., & Sobeck, J. 2012, MOOG: LTE line analysis and spectrum synthesis, Astrophysics Source Code Library, record ascl:1202.009
2012
-
[59]
Soubiran, C., Brouillet, N., & Casamiquela, L. 2022, A&A, 663, A4, doi: 10.1051/0004-6361/202142409
-
[60]
2016, A&A, 591, A118, doi: 10.1051/0004-6361/201628497
Soubiran, C., Le Campion, J.-F., Brouillet, N., & Chemin, L. 2016, A&A, 591, A118, doi: 10.1051/0004-6361/201628497
-
[61]
Strassmeier, K. G., Fekel, F. C., Bopp, B. W., Dempsey, R. C., & Henry, G. W. 1990, ApJS, 72, 191, doi: 10.1086/191414
-
[62]
2006, ApJ, 639, 516, doi: 10.1086/499220
Uitenbroek, H. 2006, ApJ, 639, 516, doi: 10.1086/499220
-
[63]
A., & Piskunov, N
Valenti, J. A., & Piskunov, N. 1996, A&AS, 118, 595
1996
-
[64]
Vernazza, J. E., Avrett, E. H., & Loeser, R. 1981, ApJS, 45, 635, doi: 10.1086/190731
-
[65]
Vernet, J., Dekker, H., D’Odorico, S., et al. 2011, A&A, 536, A105, doi: 10.1051/0004-6361/201117752
-
[66]
Verro, K., Trager, S. C., Peletier, R. F., et al. 2022, A&A, 660, A34, doi: 10.1051/0004-6361/202142388
-
[67]
Virtanen, P., Gommers, R., Oliphant, T. E., et al. 2020, Nature Methods, 17, 261, doi: 10.1038/s41592-019-0686-2
-
[68]
Wallace, L., Hinkle, K. H., Livingston, W. C., & Davis, S. P. 2011, ApJS, 195, 6, doi: 10.1088/0067-0049/195/1/6
-
[69]
Wilson, O. C. 1968, ApJ, 153, 221, doi: 10.1086/149652
-
[70]
2019, ApJ, 883, 175, doi: 10.3847/1538-4357/ab3ebc
Yan, R., Chen, Y., Lazarz, D., et al. 2019, ApJ, 883, 175, doi: 10.3847/1538-4357/ab3ebc
-
[71]
2022, ApJS, 263, 12, doi: 10.3847/1538-4365/ac9406
Zhang, W., Zhang, J., He, H., et al. 2022, ApJS, 263, 12, doi: 10.3847/1538-4365/ac9406
-
[72]
2012, Research in Astronomy and Astrophysics, 12, 723, doi: 10.1088/1674-4527/12/7/002
Zhao, G., Zhao, Y.-H., Chu, Y.-Q., Jing, Y.-P., & Deng, L.-C. 2012, Research in Astronomy and Astrophysics, 12, 723, doi: 10.1088/1674-4527/12/7/002
discussion (0)
Sign in with ORCID, Apple, or X to comment. Anyone can read and Pith papers without signing in.