Recognition: unknown
Degradation-aware Predictive Energy Management for Fuel Cell-Battery Ship Power System with Data-driven Load Forecasting
Pith reviewed 2026-05-10 10:41 UTC · model grok-4.3
The pith
Degradation-aware predictive control reduces hydrogen consumption by 5.8% and fuel cell degradation by 36.4% in hybrid ship systems.
A machine-rendered reading of the paper's core claim, the machinery that carries it, and where it could break.
Core claim
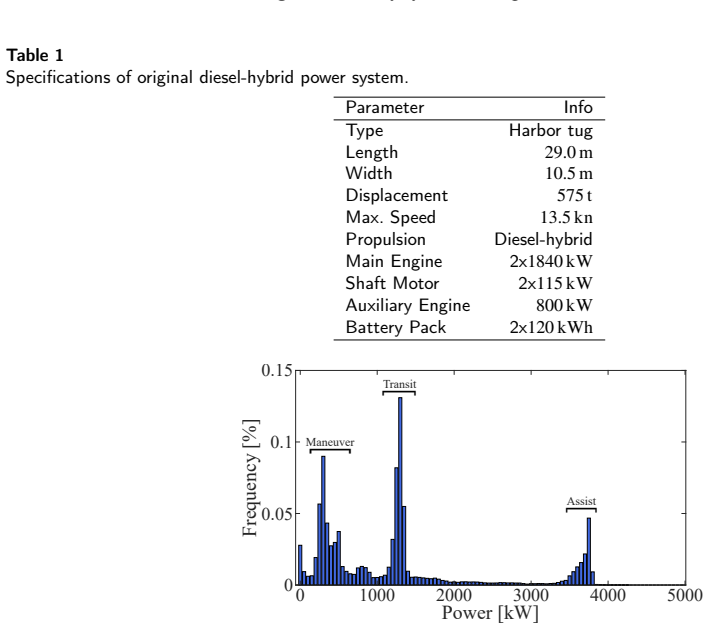
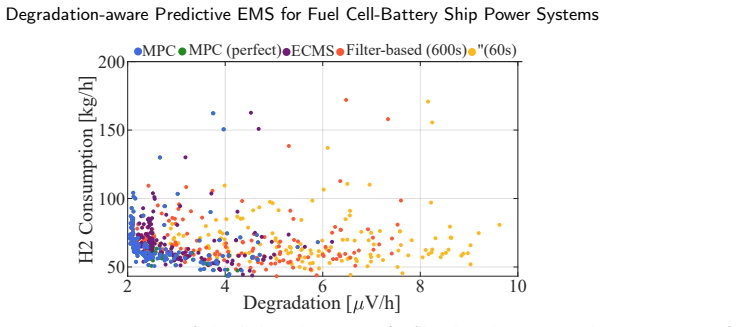
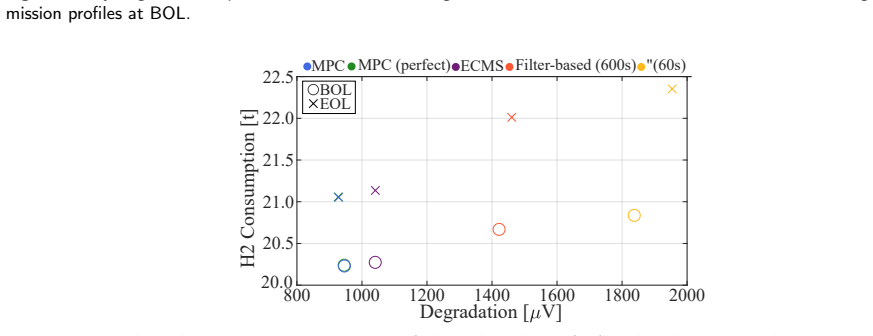
The central claim is that a predictive energy management strategy incorporating a degradation cost model and data-driven load forecasts minimizes the sum of hydrogen consumption and cell aging costs for fuel cell-battery hybrid power systems on ships. Demonstrated on a virtually retrofitted harbor tug using real operating data, the method achieves up to 5.8% lower hydrogen use and 36.4% less degradation than a filter-based benchmark, with a one-hour prediction horizon yielding additional 3.8% and 14.0% reductions respectively.
What carries the argument
The model predictive control formulation that includes a term for fuel cell degradation cost and uses a machine learning model to predict load trajectories, allowing optimization of the power distribution between fuel cell and battery over a receding horizon.
If this is right
- Lower total operational costs make hydrogen ships more competitive with conventional vessels.
- Reduced degradation extends fuel cell lifetime and decreases replacement frequency.
- Data-driven forecasting from onboard sensors enables practical implementation without external inputs.
- Increasing the prediction horizon further improves savings under the tested conditions.
Where Pith is reading between the lines
- The approach could extend to other hybrid propulsion systems in maritime or land transport where degradation is a factor.
- Integration with voyage planning and weather forecasts might enhance load prediction accuracy.
- Online updates to the degradation model based on sensor data could make the strategy more robust to varying conditions.
Load-bearing premise
The data-driven load forecasting model accurately predicts power demand over the 15-minute to one-hour horizons using only past onboard measurements, and the degradation cost model correctly quantifies the economic impact of fuel cell aging.
What would settle it
Applying the degradation-aware predictive controller to the same set of real operating data from the harbor tug and finding that total costs do not decrease or even increase compared to the filter-based benchmark.
Figures


read the original abstract
Hydrogen-based zero-emission ships are a key element in the decarbonization of the maritime sector. To strengthen these their economic competitiveness, it is key to drive their costs to a minimum. Current literature mainly focuses on fuel consumption minimization, but there is a lack of explicit consideration of costs arising from cell degradation and optimization-based approaches that leverage information on future load trajectories. This work aims at minimizing the operational cost of fuel cell-battery hybrid shipboard power systems, accounting for hydrogen consumption and cell degradation as the main cost drivers. A degradation-aware predictive energy management strategy utilizing data-driven load forecasting is designed and showcased at the example of a virtually retrofitted harbor tug. This work shows that the real onboard measurements of the vessel can be utilized to make accurate load predictions over 15min. Results indicate that the degradation-aware, predictive control simultaneously reduces the hydrogen consumption by up to 5.8% and the cell degradation by up to 36.4% with an aged fuel cell system when compared to a filter-based benchmark applied to real operating data of the harbor tug. With an increased prediction horizon of 1h, further significant reductions of 3.8% and 14.0% could be shown.
Editorial analysis
A structured set of objections, weighed in public.
Referee Report
Summary. The manuscript proposes a degradation-aware predictive energy management strategy (EMS) for fuel cell-battery hybrid shipboard power systems. It integrates a data-driven load forecaster with model predictive control (MPC) that explicitly accounts for both hydrogen consumption and fuel cell degradation costs in the objective. The approach is evaluated on real operating data from a virtually retrofitted harbor tug, claiming simultaneous reductions of up to 5.8% in hydrogen use and 36.4% in cell degradation versus a filter-based benchmark (with further gains at a 1 h prediction horizon).
Significance. If the forecasting accuracy and degradation model fidelity are substantiated, the work would provide a concrete demonstration of how predictive, multi-objective EMS can improve both fuel economy and component lifetime in maritime fuel-cell applications, addressing a gap between consumption-only optimization and degradation-aware control.
major comments (3)
- [Abstract and Results] Abstract and Results section: The headline quantitative claims (5.8 % H2 reduction, 36.4 % degradation reduction, plus 3.8 % / 14.0 % further gains at 1 h horizon) are reported without any accompanying forecasting-error statistics (RMSE, MAPE, or horizon-specific error distributions) or explicit statement that the load-forecasting model was trained and tested on disjoint data splits. This directly undermines attribution of the observed improvements to the predictive strategy rather than in-sample fitting.
- [Degradation cost model] Degradation cost model (objective function and § on cost formulation): The degradation term is load-bearing for the simultaneous-improvement claim, yet the manuscript supplies no validation of the model against experimental aging data under the current, temperature, and load profiles encountered on the tug. Without such grounding, the reported 36.4 % degradation reduction cannot be confirmed to reflect realistic lifetime extension.
- [Benchmark comparison] Benchmark comparison (Results section): The filter-based benchmark is applied to the same real operating data and aged fuel-cell system, but the manuscript does not detail whether the benchmark uses an equivalent degradation cost model or how its parameters were tuned. This leaves open the possibility that part of the reported advantage arises from asymmetric modeling rather than from the predictive, degradation-aware formulation.
minor comments (2)
- [Figures] Figure captions and axis labels should explicitly state the data source (real tug measurements) and whether any shaded regions represent prediction uncertainty or standard deviation.
- [Notation] Notation for the prediction horizon (15 min vs. 1 h) and the weighting factor on the degradation cost should be introduced once and used consistently in all equations and text.
Simulated Author's Rebuttal
We thank the referee for the thorough and constructive review. The comments highlight important aspects for strengthening the attribution of results and the transparency of modeling choices. We address each major comment below with clarifications and revisions to the manuscript.
read point-by-point responses
-
Referee: [Abstract and Results] Abstract and Results section: The headline quantitative claims (5.8 % H2 reduction, 36.4 % degradation reduction, plus 3.8 % / 14.0 % further gains at 1 h horizon) are reported without any accompanying forecasting-error statistics (RMSE, MAPE, or horizon-specific error distributions) or explicit statement that the load-forecasting model was trained and tested on disjoint data splits. This directly undermines attribution of the observed improvements to the predictive strategy rather than in-sample fitting.
Authors: We agree that forecasting performance metrics should be reported to support the claims. In the revised manuscript we will add RMSE, MAPE, and horizon-specific error distributions for the data-driven load forecaster. We will also explicitly state that the model was trained on 70 % of the real harbor-tug operating data and evaluated on the remaining 30 % held-out disjoint test set, confirming out-of-sample accuracy and thereby strengthening attribution of the reported savings to the predictive strategy. revision: yes
-
Referee: [Degradation cost model] Degradation cost model (objective function and § on cost formulation): The degradation term is load-bearing for the simultaneous-improvement claim, yet the manuscript supplies no validation of the model against experimental aging data under the current, temperature, and load profiles encountered on the tug. Without such grounding, the reported 36.4 % degradation reduction cannot be confirmed to reflect realistic lifetime extension.
Authors: The degradation cost model is taken from established semi-empirical PEMFC aging literature that accounts for load cycling and high-power operation. While the present study does not include new experimental aging tests under the exact tug profiles, the model parameters are calibrated to published data for comparable systems. In the revision we will add a dedicated subsection discussing the model assumptions, its applicability to maritime duty cycles, and the supporting experimental references. We acknowledge that absolute lifetime extension would ultimately require long-term hardware validation beyond the scope of this simulation-based work; the reported relative reduction is therefore presented under the modeled conditions. revision: partial
-
Referee: [Benchmark comparison] Benchmark comparison (Results section): The filter-based benchmark is applied to the same real operating data and aged fuel-cell system, but the manuscript does not detail whether the benchmark uses an equivalent degradation cost model or how its parameters were tuned. This leaves open the possibility that part of the reported advantage arises from asymmetric modeling rather than from the predictive, degradation-aware formulation.
Authors: The filter-based benchmark is a conventional non-predictive strategy that smooths fuel-cell power demand without an explicit degradation cost term. Its parameters were tuned to produce a comparable average power split to the proposed controller on the same data set. In the revised manuscript we will provide a detailed description of the benchmark implementation, its tuning procedure, and an explicit statement that it does not incorporate the degradation cost model, thereby clarifying that the observed advantages originate from the predictive multi-objective optimization. revision: yes
Circularity Check
No significant circularity detected
full rationale
The paper's core contribution is an empirical demonstration of a degradation-aware MPC-based energy management strategy that incorporates a data-driven load forecaster and a degradation cost term, evaluated via simulation on real tug operating data against a filter benchmark. No derivation step reduces a claimed prediction or result to an input by construction: the forecasting model is trained on measurements to generate future trajectories that are then fed into the optimizer, the performance deltas (H2 consumption and degradation reductions) are reported outcomes of that optimization, and the benchmark comparison uses the same data without the paper equating the forecaster output to the ground-truth load by definition. The abstract's assertion of 'accurate load predictions' is a claim about model quality rather than a tautological renaming of fitted values. No self-citation chain, uniqueness theorem, or ansatz smuggling is invoked to force the central result. The work is therefore self-contained against external benchmarks and receives a score of 0.
Axiom & Free-Parameter Ledger
Reference graph
Works this paper leans on
-
[1]
Approximation and optimization , 57–82doi:10.1007/978-3-030-12767-1_5
No free lunch theorem: A review. Approximation and optimization , 57–82doi:10.1007/978-3-030-12767-1_5. Antonopoulos, S., Visser, K., Kalikatzarakis, M., Reppa, V.,
-
[2]
Awais, M., Naseer, M., Khan, S., Anwer, R.M., Others,
doi:10.3390/jmse9090993. Awais, M., Naseer, M., Khan, S., Anwer, R.M., Others,
-
[3]
arXiv preprint arXiv:2307.13721 doi:10.48550/arXiv.2307.13721
Foundational models defining a new era in vision: A survey and outlook. arXiv preprint arXiv:2307.13721 doi:10.48550/arXiv.2307.13721. Bai, S., Kolter, J.Z., Koltun, V.,
-
[4]
An Empirical Evaluation of Generic Convolutional and Recurrent Networks for Sequence Modeling
An empirical evaluation of generic convolutional and recurrent networks for sequence modeling. arXiv preprint arXiv:1803. 01271 doi:10.48550/arXiv.1803.01271. Balestra, L., Schjølberg, I., 2021a. Energy management strategies for a zero-emission hybrid domestic ferry. International Journal of Hydrogen Energy 46, 38490–38503. doi:10.1016/j.ijhydene.2021.09....
work page internal anchor Pith review doi:10.48550/arxiv.1803.01271 2021
-
[5]
IEEE Transactions on Industrial Informatics 17, 5430–5440
Stochastic Model Predictive Energy Management in Hybrid Emission-Free Modern Maritime Vessels. IEEE Transactions on Industrial Informatics 17, 5430–5440. doi:10.1109/TII.2020.3027808. Banaei, M., Rafiei, M., Boudjadar, J., Khooban, M.H., 2020b. A Comparative Analysis of Optimal Operation Scenarios in Hybrid Emission-Free Ferry Ships. IEEE Transactions on ...
-
[6]
International Journal of Hydrogen Energy 42, 623–635
Development of a multi-scheme energy management strategy for a hybrid fuel cell driven passenger ship. International Journal of Hydrogen Energy 42, 623–635. doi:10.1016/j.ijhydene.2016.08.209. Bishop, C.M., Bishop, H.,
-
[7]
Lifetime prediction and the economic lifetime of Proton Exchange Membrane fuel cells. Applied Energy 142, 154–163. doi:10.1016/j.apenergy.2014.12.062. Chen, T., Guestrin, C.,
-
[8]
Xgboost: A scalable tree boosting system, in: acm sigkdd international conference on knowledge discovery and data mining. doi:10.1145/2939672.2939785. Das, A., Kong, W., Sen, R., Zhou, Y.,
-
[9]
A decoder- only foundation model for time-series forecasting.arXiv preprint arXiv:2310.10688,
A decoder-only foundation model for time-series forecasting, in: International Conference on Machine Learning. doi:10.48550/arXiv.2310.10688. deBruijn,F.A.,Dam,V.a.T.,Janssen,G.J.M.,2008. Review:DurabilityandDegradationIssuesofPEMFuelCellComponents. FuelCells8,3–22. doi:10.1002/fuce.200700053. Fletcher,T.,Thring,R.,Watkinson,M.,2016. AnEnergyManagementStr...
-
[10]
Design and control of hybrid power and propulsion systems for smart ships: A review of developments. Applied Energy 194, 30–54. doi:10.1016/j.apenergy.2017.02.060. Grimmelius, H.,
-
[11]
Advances in Neural Information Processing Systems doi:10.48550/arXiv.2310.07820
Large language models are zero-shot time series forecasters. Advances in Neural Information Processing Systems doi:10.48550/arXiv.2310.07820. Han, J., Charpentier, J.F., Tang, T.,
-
[12]
Model predictive maneuvering control and energy management for all-electric autonomous ships. Applied Energy 251, 113308. doi:10.1016/j.apenergy.2019.113308. Herzen, J., Lässig, F., Piazzetta, S.G., Neuer, T., Others,
-
[13]
Journal of Machine Learning Research 23, 1–6
Darts: User-friendly modern machine learning for time series. Journal of Machine Learning Research 23, 1–6. doi:10.48550/arXiv.2110.03224. Hyndman, R.J.,
-
[14]
Forecasting: principles and practice. OTexts. Jaurola,M.,Hedin,A.,Tikkanen,S.,Huhtala,K.,2019. Optimisingdesignandpowermanagementinenergy-efficientmarinevesselpowersystems: A literature review. Journal of Marine Engineering & Technology 18, 92–101. doi:10.1080/20464177.2018.1505584. T. Kopka et al.:Preprint submitted to ElsevierPage 26 of 28 Degradation-a...
-
[15]
Estimating the end-of-life of PEM fuel cells: Guidelines and metrics. Applied Energy 177, 87–97. doi:10.1016/j.apenergy.2016.05.076. Khazaei,J.,2021. OptimalFlowofMVDCShipboardMicrogridsWithHybridStorageEnhancedWithCapacitiveandResistiveDroopControllers. IEEE Transactions on Power Systems 36, 3728–3739. doi:10.1109/TPWRS.2021.3049343. Kingma, D.P., Ba, J.,
-
[16]
Adam: A Method for Stochastic Optimization
Adam: A method for stochastic optimization. arXiv preprint arXiv:1412.6980 doi:10.48550/arXiv.1412.6980. Kleen, G., Gibbons, W.,
work page internal anchor Pith review Pith/arXiv arXiv doi:10.48550/arxiv.1412.6980
-
[17]
Kopka, T., Andrea, C., Polinder, H.,
https://www.hydrogen.energy.gov/docs/hydrogenprogramlibraries/pdfs/review24/24004-hd-fuel-cell-system-cost-2023.pdf. Kopka, T., Andrea, C., Polinder, H.,
2023
-
[18]
Journal of Marine Engineering & Technology , 1–13doi:10.1080/20464177.2025.2489313
Virtual impedance-based frequency decoupling for modular fuel cell-battery DC shipboard power systems. Journal of Marine Engineering & Technology , 1–13doi:10.1080/20464177.2025.2489313. Kopka, T., Löffler, C., Coraddu, A., Polinder, H., 2023a. Hierarchical Control Strategy for Fuel Cell-Battery Shipboard Power System Utilizing a ModularControlArchitectur...
-
[19]
Journal of Power Sources 362, 39–49
Investigation of polymer electrolyte membrane fuel cell internal behaviour during long term operation and its use in prognostics. Journal of Power Sources 362, 39–49. doi:10.1016/j.jpowsour.2017.07.018. Meng,K.,Zhou,H.,Chen,B.,Tu,Z.,2021. DynamiccurrentcycleseffectonthedegradationcharacteristicofaH2/O2protonexchangemembrane fuel cell. Energy 224, 120168. ...
-
[20]
Energies , 32doi:10.3390/en11123492
Energy Storage Systems for Shipboard Microgrids—A Review. Energies , 32doi:10.3390/en11123492. Naser,M.Z.,Alavi,A.H.,2023. Errormetricsandperformancefitnessindicatorsforartificialintelligenceandmachinelearninginengineeringand sciences. Architecture, Structures and Construction 3, 499–517. doi:10.1007/s44150-021-00015-8. Nedstack,
-
[21]
https://nedstack.com/sites/default/files/2019-11/20191105_nedstack_fcs_13-xxl.pdf
Nedstack | FCS 13-XXL. https://nedstack.com/sites/default/files/2019-11/20191105_nedstack_fcs_13-xxl.pdf. Njoya, S.N., Tremblay, O., Dessaint, L.A.,
2019
-
[22]
A generic fuel cell model for the simulation of fuel cell vehicles, in: 2009 IEEE Vehicle Power and Propulsion Conference, Dearborn, MI, USA. pp. 1722–1729. doi:10.1109/VPPC.2009.5289692. Nuchturee, C., Li, T., Xia, H.,
-
[23]
Renewable and Sustainable Energy Reviews 134, 110145
Energy efficiency of integrated electric propulsion for ships – A review. Renewable and Sustainable Energy Reviews 134, 110145. doi:10.1016/j.rser.2020.110145. Oneto, L.,
-
[24]
Model Selection and Error Estimation in a Nutshell. Springer. doi:10.1007/978-3-030-24359-3. Oreshkin, B.N., Carpov, D., Chapados, N., Bengio, Y.,
-
[25]
N., Carpov, D., Chapados, N., and Bengio, Y
N-beats: Neural basis expansion analysis for interpretable time series forecasting. arXiv preprint arXiv:1905.10437 doi:10.48550/arXiv.1905.10437. Paran, S., Vu, T.V., Mezyani, T.E., Edrington, C.S.,
-
[26]
MPC-based power management in the shipboard power system, in: 2015 IEEE Electric Ship Technologies Symposium (ESTS), Old Town Alexandria, VA, USA. pp. 14–18. doi:10.1109/ESTS.2015.7157855. RS-PRO, . Rechargeable Lithiumion Iron Phosphate Battery (LiFePO4) - Datasheet. https://docs.rs-online.com/f4c2/A700000009327850.pdf. Sainani, K.L.,
-
[27]
The value of scatter plots. PM&R 8, 1213–1217. doi:10.1016/j.pmrj.2016.10.018. Salinas,D.,Flunkert,V.,Gasthaus,J.,Januschowski,T.,2020.Deepar:Probabilisticforecastingwithautoregressiverecurrentnetworks.International journal of forecasting 36, 1181–1191. doi:10.1016/j.ijforecast.2019.07.001. Sciarretta, A., Guzzella, L.,
-
[28]
IEEE Control Systems Magazine 27, 60–70
Control of hybrid electric vehicles. IEEE Control Systems Magazine 27, 60–70. doi:10.1109/MCS.2007. 338280. Seenumani,G.,Sun,J.,Peng,H.,2010. Ahierarchicaloptimalcontrolstrategyforpowermanagementofhybridpowersystemsinallelectricships applications,in:49thIEEEConferenceonDecisionandControl(CDC),Atlanta,GA,USA.pp.3972–3977. doi:10.1109/CDC.2010.5717035. Shak...
-
[29]
IEEE Electrification Magazine 8, 27–43
Hydrogen Fuel Cells for Ship Electric Propulsion: Moving Toward Greener Ships. IEEE Electrification Magazine 8, 27–43. doi:10.1109/MELE.2020.2985484. Shalev-Shwartz,S.,Ben-David,S.,2014. Understandingmachinelearning:Fromtheorytoalgorithms. Cambridgeuniversitypress. doi:10.1017/ CBO9781107298019. Tremblay, O., Dessaint, L.A., Dekkiche, A.I.,
-
[30]
A Generic Battery Model for the Dynamic Simulation of Hybrid Electric Vehicles, in: 2007 IEEE Vehicle Power and Propulsion Conference, Arlington, TX, USA. pp. 284–289. doi:10.1109/VPPC.2007.4544139. Wallnöfer-Ogris,E.,Poimer,F.,Köll,R.,Macherhammer,M.G.,Trattner,A.,2024. Maindegradationmechanismsofpolymerelectrolytemembrane fuelcellstacks–Mechanisms,influ...
-
[31]
doi:10.1016/j.ijhydene.2023.06.215. Xiang, Y., Yang, X.,
-
[32]
Xie, P., Guerrero, J.M., Tan, S., Bazmohammadi, N., Vasquez, J.C., Mehrzadi, M., Al-Turki, Y.,
doi:10.3390/en14040810. Xie, P., Guerrero, J.M., Tan, S., Bazmohammadi, N., Vasquez, J.C., Mehrzadi, M., Al-Turki, Y.,
-
[33]
IEEE Systems Journal 16, 578–590
Optimization-Based Power and Energy Management System in Shipboard Microgrid: A Review. IEEE Systems Journal 16, 578–590. doi:10.1109/JSYST.2020.3047673. Xie, P., Tan, S., Guerrero, J.M., Vasquez, J.C.,
-
[34]
MPC-informed ECMS based real-time power management strategy for hybrid electric ship. Energy Reports 7, 126–133. doi:10.1016/j.egyr.2021.02.013. Yuan,L.C.W.,Tjahjowidodo,T.,Lee,G.S.G.,Chan,R.,Adnanes,A.K.,2016. EquivalentConsumptionMinimizationStrategyforhybridall-electric tugboats to optimize fuel savings, in: Proc Am Control Conf, Boston, MA, USA. pp. 6...
-
[35]
Journal of Energy Storage 52, 104763
Two-level model predictive control energy management strategy for hybrid power ships with hybrid energy storage system. Journal of Energy Storage 52, 104763. doi:10.1016/j.est.2022.104763. T. Kopka et al.:Preprint submitted to ElsevierPage 27 of 28 Degradation-aware Predictive EMS for Fuel Cell-Battery Ship Power Systems Zhang, Z., Guan, C., Liu, Z.,
-
[36]
Real-Time Optimization Energy Management Strategy for Fuel Cell Hybrid Ships Considering Power Sources Degradation. IEEE Access 8, 87046–87059. doi:10.1109/ACCESS.2020.2991519. Zhao,W.X.,Zhou,K.,Li,J.,Tang,T.,Others,2023. Asurveyoflargelanguagemodels. arXivpreprintarXiv:2303.18223doi:10.48550/arXiv. 2303.18223. Zhao, Z.H.,
-
[37]
International Journal of Hydrogen Energy 47, 9719–9734
Improved fuzzy logic control-based energy management strategy for hybrid power system of FC/PV/battery/SC on tourist ship. International Journal of Hydrogen Energy 47, 9719–9734. doi:10.1016/j.ijhydene.2022.01.040. Zhu, L., Han, J., Peng, D., Wang, T., Tang, T., Charpentier, J.F.,
-
[38]
Fuzzy logic based energy management strategy for a fuel cell/battery/ultra- capacitor hybrid ship, in: 2014 First International Conference on Green Energy ICGE 2014, Sfax, Tunisia. pp. 107–112. doi:10.1109/ICGE. 2014.6835406. T. Kopka et al.:Preprint submitted to ElsevierPage 28 of 28
discussion (0)
Sign in with ORCID, Apple, or X to comment. Anyone can read and Pith papers without signing in.