Recognition: unknown
Photometric Metallicities for 367,324 stars of Omega Centauri
Pith reviewed 2026-05-10 09:59 UTC · model grok-4.3
The pith
Omega Centauri shows no significant metallicity gradient or irregular patterns within its half-light radius.
A machine-rendered reading of the paper's core claim, the machinery that carries it, and where it could break.
Core claim
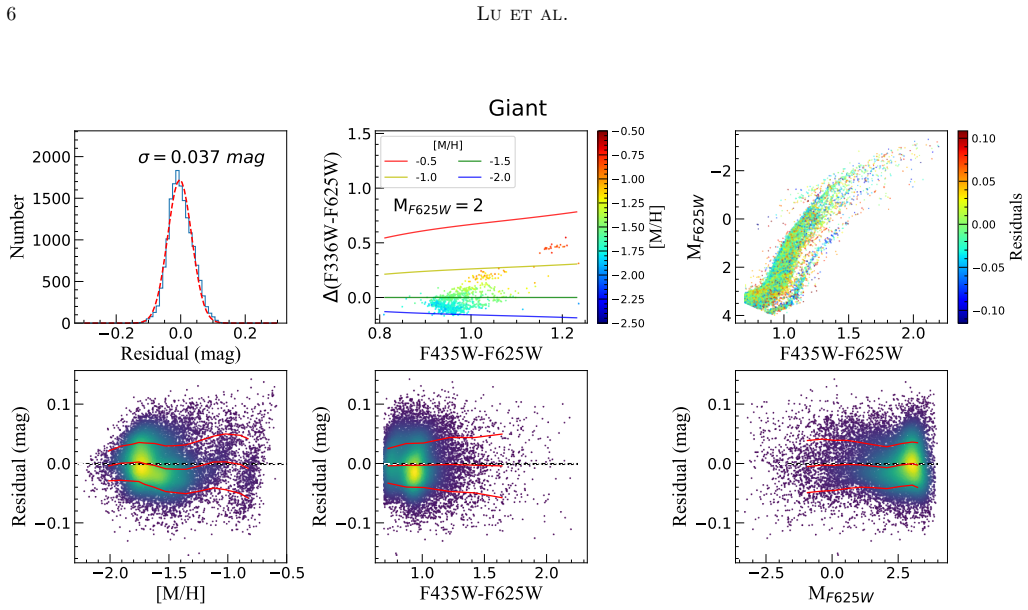
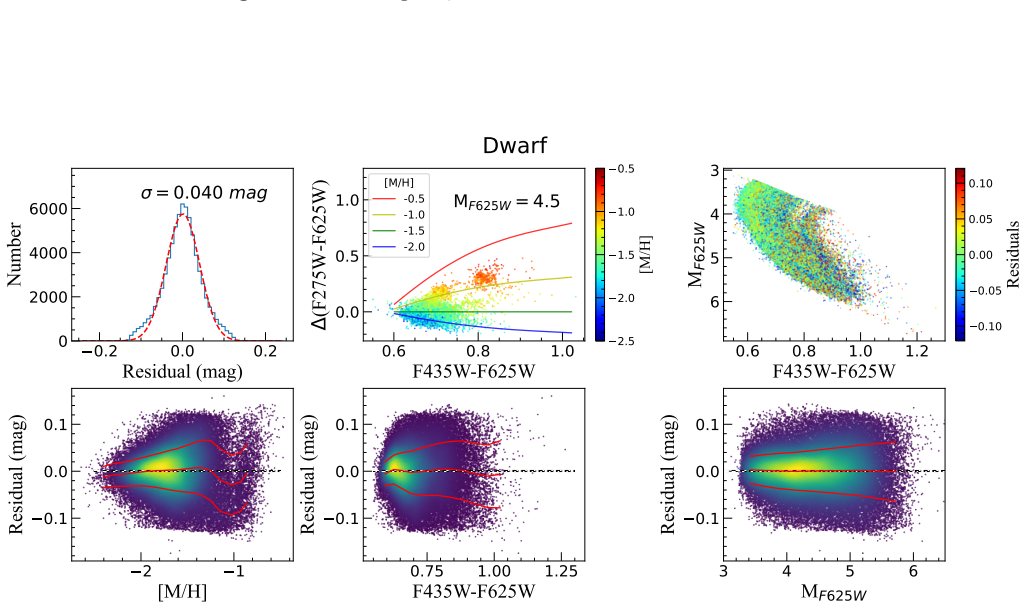
Using the wide metallicity range of Omega Centauri, HST photometry (F275W, F336W, F435W, F625W), and MUSE spectroscopy ([M/H]), we derive [M/H]- and M_F625W-dependent stellar loci to estimate photometric metallicities from HST colors. Our tests yield metallicity precisions of 0.10 dex for giants and 0.22 dex for fainter dwarfs. A subsample of 20,533 giants is used to study the spatial metallicity distribution and gradient. We find no significant metallicity gradient within the half-light radius, consistent with previous work. Moreover, the previously reported ring-like structure is less pronounced in our data, and no physically significant, irregular two-dimensional metallicity pattern is 0.
What carries the argument
HST color-based stellar loci that depend on both metallicity [M/H] and absolute magnitude M_F625W, calibrated directly from the combined HST plus MUSE data set.
Load-bearing premise
Stellar loci in HST color space depend primarily on [M/H] and M_F625W in a form that can be accurately derived from the combined HST+MUSE sample without significant systematic biases from photometry, reddening, or population mixing.
What would settle it
A new spectroscopic survey that measures [M/H] for thousands of stars spread across the half-light radius and finds a statistically significant radial metallicity gradient would contradict the no-gradient result.
Figures


read the original abstract
Omega Centauri is the most massive and chemically complex multi-population globular cluster with a wide metallicity range that has been extensively studied photometrically and spectroscopically. Using the wide metallicity range of omega Cen, HST photometry (F275W, F336W, F435W, F625W), and MUSE spectroscopy ([M/H]), we derive [M/H]- and M_{F625W}-dependent stellar loci to estimate photometric metallicities from HST colors. Our tests yield metallicity precisions of 0.10\,dex for giants and 0.22\,dex for fainter dwarfs. We construct a photometric metallicity catalog from simultaneous F336W, F435W, and F625W observations (plus F275W where available), containing 20,778 giants and 346,546 dwarfs. A subsample of 20,533 giants is used to study the spatial metallicity distribution and gradient. We find no significant metallicity gradient within the half-light radius, consistent with previous work. Moreover, the previously reported ring-like structure is less pronounced in our data, and no physically significant, irregular two-dimensional metallicity pattern is detected, indicating that the stellar subpopulations are well mixed within the half-light radius. Our catalog significantly extends the metallicity sample of omega Cen, and this approach can be applied to other HST data to estimate photometric metallicities.
Editorial analysis
A structured set of objections, weighed in public.
Referee Report
Summary. The manuscript derives photometric metallicities for 367,324 stars in Omega Centauri by constructing [M/H]- and M_F625W-dependent stellar loci from overlapping HST photometry (F275W, F336W, F435W, F625W) and MUSE spectroscopy. These loci are applied to produce a catalog of 20,778 giants and 346,546 dwarfs with reported internal precisions of 0.10 dex (giants) and 0.22 dex (dwarfs). Analysis of a 20,533-giant subsample finds no significant metallicity gradient within the half-light radius, a less pronounced ring-like structure than in prior work, and no physically significant irregular 2D metallicity patterns, leading to the conclusion that stellar subpopulations are well mixed.
Significance. If the photometric [M/H] values are free of spatially correlated systematics, the large catalog substantially extends existing metallicity samples and provides supporting evidence that Omega Centauri’s multiple populations are dynamically well-mixed inside the half-light radius. The calibration approach itself is potentially reusable for other HST-observed clusters, though its robustness depends on validation details not fully elaborated in the current text.
major comments (3)
- [§3] §3 (locus construction): The explicit functional form of the [M/H]- and M_F625W-dependent loci, the fitting procedure, and the propagation of photometric uncertainties into the derived [M/H] values are not provided. Without these, it is impossible to evaluate whether the quoted 0.10/0.22 dex precisions are internal scatter only or include external validation, and whether residual color terms could introduce radius- or density-dependent biases.
- [§5] §5 (spatial distribution): The central claims of no gradient, reduced ring-like feature, and well-mixed subpopulations rest on the assumption that photometric [M/H] estimates carry no position-dependent systematics from reddening, crowding, or unmodeled light-element variations. The MUSE overlap sample used to define the loci may have different spatial sampling or selection than the full HST catalog; any residual correlation between color residuals and local density or azimuth would directly affect the 2D map and gradient test.
- [§4] §4 (catalog validation): No external validation of the photometric [M/H] values against independent spectroscopic datasets (beyond the MUSE calibration sample) is presented for stars at varying radii or in different evolutionary phases. Such a test is required to confirm that the null results on spatial structure are not artifacts of calibration incompleteness.
minor comments (2)
- [Figure 2] Figure 2 and associated text: The comparison of the ring-like structure with previous studies would benefit from a quantitative metric (e.g., azimuthal amplitude or Fourier decomposition) rather than qualitative description.
- [Table 1] Table 1: The reported sample sizes (20,778 giants, 346,546 dwarfs) should be cross-checked against the final catalog numbers used in the spatial analysis to ensure consistency.
Simulated Author's Rebuttal
We thank the referee for their thorough review and valuable comments on our manuscript. We address each of the major comments point by point below. Where appropriate, we will revise the manuscript to incorporate additional details and clarifications to strengthen the presentation of our methods and results.
read point-by-point responses
-
Referee: [§3] §3 (locus construction): The explicit functional form of the [M/H]- and M_F625W-dependent loci, the fitting procedure, and the propagation of photometric uncertainties into the derived [M/H] values are not provided. Without these, it is impossible to evaluate whether the quoted 0.10/0.22 dex precisions are internal scatter only or include external validation, and whether residual color terms could introduce radius- or density-dependent biases.
Authors: We agree with the referee that the details of the locus construction are essential. In the revised manuscript, we will provide the explicit mathematical form of the [M/H]- and M_F625W-dependent stellar loci, describe the fitting procedure used to derive them from the combined HST photometry and MUSE spectroscopy, and explain the method for propagating photometric uncertainties into the [M/H] estimates. The quoted precisions (0.10 dex for giants and 0.22 dex for dwarfs) reflect the internal scatter around the fitted loci in the calibration sample; we will make this clear and include an assessment of potential residual color terms and their possible impact on spatial analyses. revision: yes
-
Referee: [§5] §5 (spatial distribution): The central claims of no gradient, reduced ring-like feature, and well-mixed subpopulations rest on the assumption that photometric [M/H] estimates carry no position-dependent systematics from reddening, crowding, or unmodeled light-element variations. The MUSE overlap sample used to define the loci may have different spatial sampling or selection than the full HST catalog; any residual correlation between color residuals and local density or azimuth would directly affect the 2D map and gradient test.
Authors: We recognize the potential for position-dependent systematics to affect our spatial analysis. In the revision, we will add plots and statistical tests showing the distribution of fit residuals as a function of projected radius, local density, and position angle to demonstrate the absence of significant correlations. We will also detail the spatial sampling of the MUSE calibration sample relative to the full HST catalog and confirm that it spans the relevant range of densities and radii. These additions will support our conclusion that the stellar subpopulations appear well-mixed within the half-light radius. revision: yes
-
Referee: [§4] §4 (catalog validation): No external validation of the photometric [M/H] values against independent spectroscopic datasets (beyond the MUSE calibration sample) is presented for stars at varying radii or in different evolutionary phases. Such a test is required to confirm that the null results on spatial structure are not artifacts of calibration incompleteness.
Authors: External validation beyond the MUSE sample is indeed desirable but challenging due to the limited availability of independent spectroscopic metallicities with matching multi-band HST photometry across different radii and evolutionary stages. In the revised text, we will expand the validation section to include comparisons with available literature [M/H] values for overlapping stars where possible, and discuss the representativeness of the calibration sample. We argue that the internal precision tests and consistency with previous gradient studies provide supporting evidence for our null results on spatial structure, though we acknowledge this as a limitation. revision: partial
Circularity Check
No significant circularity in photometric metallicity calibration or spatial conclusions
full rationale
The paper calibrates [M/H]- and M_F625W-dependent stellar loci in HST color space using overlapping MUSE spectroscopic metallicities as external input, then applies the resulting relations to independent HST photometry for a much larger sample. The spatial metallicity distribution, gradient, and mixing conclusions are derived from the positions and derived metallicities of the extended catalog; these do not reduce by construction to the calibration subset or fitted parameters. No self-definitional steps, fitted-input predictions, load-bearing self-citations, uniqueness theorems, or ansatz smuggling are present. The derivation is self-contained against external spectroscopic benchmarks and standard for photometric metallicity estimation.
Axiom & Free-Parameter Ledger
Reference graph
Works this paper leans on
-
[1]
Anderson, J., & van der Marel, R. P. 2010, ApJ, 710, 1032, doi: 10.1088/0004-637X/710/2/1032
-
[2]
Bacon, R., Accardo, M., Adjali, L., et al. 2010, in Society of Photo-Optical Instrumentation Engineers (SPIE) Conference Series, Vol. 7735, Ground-based and Airborne Instrumentation for Astronomy III, ed. I. S. McLean, S. K. Ramsay, & H. Takami, 773508, doi: 10.1117/12.856027
-
[3]
2014, The Messenger, 157, 13
Bacon, R., Vernet, J., Borisova, E., et al. 2014, The Messenger, 157, 13
2014
-
[4]
Monthly Notices of the Royal Astronomical Society , author =
Baumgardt, H., & Hilker, M. 2018, MNRAS, 478, 1520, doi: 10.1093/mnras/sty1057
-
[5]
Baumgardt, H., & Vasiliev, E. 2021, MNRAS, 505, 5957, doi: 10.1093/mnras/stab1474
-
[6]
Bekki, K., & Freeman, K. C. 2003, MNRAS, 346, L11, doi: 10.1046/j.1365-2966.2003.07275.x
-
[7]
Bellini, A., Anderson, J., Bedin, L. R., et al. 2017, ApJ, 842, 6, doi: 10.3847/1538-4357/aa7059
-
[8]
Bellini, A., Anderson, J., van der Marel, R. P., et al. 2014, ApJ, 797, 115, doi: 10.1088/0004-637X/797/2/115
-
[9]
Bellini, A., Libralato, M., Bedin, L. R., et al. 2018, ApJ, 853, 86, doi: 10.3847/1538-4357/aaa3ec
-
[10]
2011, Ap&SS, 335, 161, doi: 10.1007/s10509-010-0581-x
Bianchi, L., Herald, J., Efremova, B., et al. 2011, Ap&SS, 335, 161, doi: 10.1007/s10509-010-0581-x
-
[11]
Carollo, D., Beers, T. C., Chiba, M., et al. 2010, The Astrophysical Journal, 712, 692, doi: 10.1088/0004-637X/712/1/692
-
[12]
Clontz, C., Seth, A. C., Wang, Z., et al. 2025, ApJ, 984, 162, doi: 10.3847/1538-4357/adc1c5
-
[13]
Freeman, K. C., & Rodgers, A. W. 1975, ApJL, 201, L71, doi: 10.1086/181945 H¨ aberle, M., Neumayer, N., Bellini, A., et al. 2024, ApJ, 970, 192, doi: 10.3847/1538-4357/ad47f5
-
[14]
2004, A&A, 422, L9, doi: 10.1051/0004-6361:20040188
Hilker, M., Kayser, A., Richtler, T., & Willemsen, P. 2004, A&A, 422, L9, doi: 10.1051/0004-6361:20040188
-
[15]
2025, ApJS, 277, 7, doi: 10.3847/1538-4365/ada9e6
Huang, B., Yuan, H., Xu, S., et al. 2025, ApJS, 277, 7, doi: 10.3847/1538-4365/ada9e6
-
[16]
Huang, Y., Beers, T. C., Wolf, C., et al. 2022, ApJ, 925, 164, doi: 10.3847/1538-4357/ac21cb
-
[17]
2016, A&A, 588, A148, doi: 10.1051/0004-6361/201526949
Husser, T.-O., Kamann, S., Dreizler, S., et al. 2016, A&A, 588, A148, doi: 10.1051/0004-6361/201526949
-
[18]
Johnson, C. I., & Pilachowski, C. A. 2010, ApJ, 722, 1373, doi: 10.1088/0004-637X/722/2/1373
-
[19]
Kamann, S., Wisotzki, L., & Roth, M. M. 2013, A&A, 549, A71, doi: 10.1051/0004-6361/201220476
-
[20]
Libralato, M., Bellini, A., van der Marel, R. P., et al. 2018, ApJ, 861, 99, doi: 10.3847/1538-4357/aac6c0
-
[21]
Libralato, M., Bellini, A., Vesperini, E., et al. 2022, ApJ, 934, 150, doi: 10.3847/1538-4357/ac7727 Photometric Metallicities for 367,324 stars ofωCentauri13
-
[22]
2024, ApJS, 271, 26, doi: 10.3847/1538-4365/ad1eea
Lu, X., Yuan, H., Xu, S., et al. 2024, ApJS, 271, 26, doi: 10.3847/1538-4365/ad1eea
-
[23]
S., Neumayer, N., Clontz, C., et al
Nitschai, M. S., Neumayer, N., Clontz, C., et al. 2023, ApJ, 958, 8, doi: 10.3847/1538-4357/acf5db
-
[24]
S., Neumayer, N., H¨ aberle, M., et al
Nitschai, M. S., Neumayer, N., H¨ aberle, M., et al. 2024, ApJ, 970, 152, doi: 10.3847/1538-4357/ad5289
-
[25]
Onken, C. A., Wolf, C., Bessell, M. S., et al. 2019, PASA, 36, e033, doi: 10.1017/pasa.2019.27
-
[26]
Schlafly, E. F., & Finkbeiner, D. P. 2011, ApJ, 737, 103, doi: 10.1088/0004-637X/737/2/103
work page internal anchor Pith review doi:10.1088/0004-637x/737/2/103 2011
-
[27]
Villanova, S., Geisler, D., Gratton, R. G., & Cassisi, S. 2014, ApJ, 791, 107, doi: 10.1088/0004-637X/791/2/107
-
[28]
G., Adelman, J., Anderson, Jr., J
York, D. G., Adelman, J., Anderson, Jr., J. E., et al. 2000, The Astronomical Journal, 120, 1579, doi: 10.1086/301513
-
[29]
2015, ApJ, 799, 134, doi: 10.1088/0004-637X/799/2/134
Yuan, H., Liu, X., Xiang, M., Huang, Y., & Chen, B. 2015, ApJ, 799, 134, doi: 10.1088/0004-637X/799/2/134
discussion (0)
Sign in with ORCID, Apple, or X to comment. Anyone can read and Pith papers without signing in.