Recognition: unknown
The Metallicity Gradient of Sagittarius Dwarf Spheroidal Galaxy Prior to Infall Constrained by S-PLUS Observations of its Tidal Stream
Pith reviewed 2026-05-10 07:09 UTC · model grok-4.3
The pith
Observations of the Sagittarius stream constrain its progenitor dwarf galaxy to a pre-infall metallicity gradient between -0.38 and -0.24 dex per kiloparsec.
A machine-rendered reading of the paper's core claim, the machinery that carries it, and where it could break.
Core claim
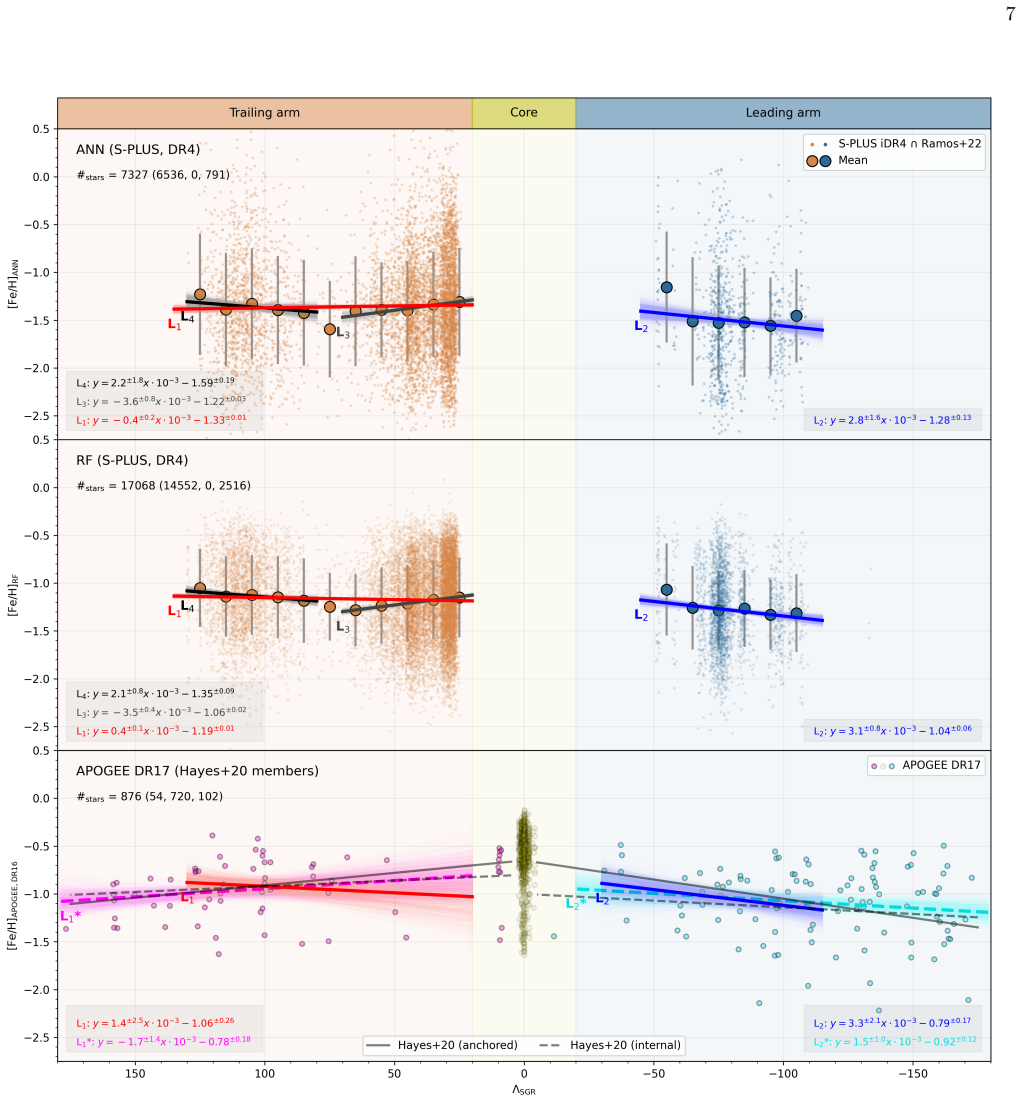
By comparing the observed metallicity patterns in the leading and trailing arms of the Sagittarius stream to predictions from N-body simulations in which metallicities were assigned according to a set of imprinted radial gradients in the progenitor, the paper constrains the original metallicity gradient of the Sagittarius dwarf spheroidal galaxy to between -0.38 and -0.24 dex kpc^{-1} from photometric data and -0.42 to -0.10 dex kpc^{-1} from APOGEE spectroscopy. These values are consistent with gradients observed in other Local Group dwarf galaxies.
What carries the argument
N-body simulations of the Sagittarius stream with metallicities assigned according to a single radial gradient in the progenitor dwarf galaxy.
If this is right
- The leading arm remains systematically more metal-poor than the trailing arm by 0.15-0.20 dex.
- The trailing arm exhibits an inner negative metallicity trend and an outer positive trend.
- The derived progenitor gradient falls within the range seen in other surviving Local Group dwarf galaxies.
- Photometric surveys like S-PLUS can reconstruct the chemodynamical history of fully disrupted satellites.
Where Pith is reading between the lines
- Applying the same simulation-matching approach to additional tidal streams could test whether most disrupted dwarfs shared similar pre-infall gradients.
- Differences between the photometric and spectroscopic gradient ranges could be used to quantify calibration offsets between the two metallicity estimators.
- Future simulations that allow the initial gradient to vary with radius or time could check whether a constant single-slope model is strictly required.
Load-bearing premise
The N-body simulation with a single radial metallicity gradient accurately reproduces the observed stream structure and that photometric metallicities have no large systematic offsets from the true iron abundance distribution.
What would settle it
A complete spectroscopic map of metallicities along both arms of the stream that produces a best-fit progenitor gradient outside the reported range or fails to recover the observed leading-trailing arm difference would falsify the constraint.
Figures


read the original abstract
We study the metallicity distribution along the Sagittarius (Sgr) stream using photometric metallicities from S-PLUS DR4, combined with Gaia DR3 kinematics and APOGEE DR17 spectroscopy. Our analysis confirms that the leading arm (Galactic latitude $b > 0$) is systematically more metal-poor than the trailing arm ($b < 0$) by 0.15--0.20 dex, and reveals a clear negative metallicity gradient along the leading arm. The trailing arm shows no significant overall gradient but displays distinct inner (negative) and outer (positive) trends. These features are consistently recovered across different photometric estimators and agree with spectroscopic data. We compare these results with predictions from an $N$-body simulation, in which metallicities were assigned according to a set of imprinted radial gradients in the progenitor. We were able to constrain the original metallicity gradient of the Sgr progenitor to be between $-0.38$ and $-0.24$ dex kpc$^{-1}$ based on photometric data, and $-0.42$ to $-0.10$ dex kpc$^{-1}$ from APOGEE. These values are consistent with gradients observed in other Local Group dwarf galaxies. Our findings demonstrate that metallicity-sensitive photometric surveys such as S-PLUS are powerful tools for reconstructing the chemodynamical evolution of disrupted satellites.
Editorial analysis
A structured set of objections, weighed in public.
Referee Report
Summary. The manuscript analyzes the metallicity distribution along the Sagittarius tidal stream using S-PLUS DR4 photometric metallicities, Gaia DR3 kinematics, and APOGEE DR17 spectroscopy. It reports that the leading arm is more metal-poor than the trailing arm by 0.15-0.20 dex, identifies a negative metallicity gradient along the leading arm (with segmented trends in the trailing arm), and compares these trends to N-body simulations in which metallicities are assigned according to radial gradients in the progenitor. This comparison is used to constrain the pre-infall metallicity gradient of the Sgr progenitor to -0.38 to -0.24 dex kpc^{-1} (photometric) and -0.42 to -0.10 dex kpc^{-1} (APOGEE).
Significance. If the N-body simulation faithfully reproduces the stream's spatial and kinematic structure and photometric [Fe/H] estimates carry no large position-dependent systematics, the work delivers a useful empirical constraint on the internal chemodynamical structure of the Sgr progenitor before infall. The result is consistent with gradients measured in other Local Group dwarfs and illustrates the value of photometric surveys for stream archaeology. The observational findings gain credibility from their recovery across independent photometric estimators and agreement with APOGEE spectroscopy.
major comments (3)
- [§5 (N-body comparison)] §5 (N-body comparison): The reported gradient range is obtained by varying the input progenitor radial gradient until the simulated metallicity distribution along the stream matches the observed one. This constitutes a constrained fit rather than an a priori prediction; the manuscript must supply quantitative goodness-of-fit statistics (e.g., KS-test p-values or reduced chi-squared) for the accepted models and demonstrate how the inferred interval changes when other simulation parameters (progenitor mass, orbit, or disruption time) are varied.
- [§4 (observational results)] §4 (observational results): No star-by-star comparison between S-PLUS photometric [Fe/H] and APOGEE spectroscopic [Fe/H] is shown for the same stream members. Such a cross-check is required to quantify any zero-point offsets or position-dependent biases that could arise from age, distance, or population gradients along the stream and thereby affect the derived progenitor gradient.
- [§3 (data selection)] §3 (data selection): The manuscript provides insufficient detail on the precise selection cuts, distance estimates, and error propagation used when fitting the metallicity gradients. Without these, it is difficult to assess whether the reported leading-arm gradient and arm-to-arm offset are robust to reasonable variations in the analysis pipeline.
minor comments (2)
- [Abstract and §5] The abstract and §5 should explicitly list the discrete gradient values tested in the simulations and the precise matching criterion employed.
- [Figure captions] Figure captions for metallicity-versus-position plots should state the bin size, the number of stars per bin, and whether the displayed uncertainties are statistical only or include systematic contributions.
Simulated Author's Rebuttal
We thank the referee for their thorough and constructive report. The comments have helped us strengthen the manuscript by adding quantitative statistics, direct cross-validation, and expanded methodological details. We address each major comment below and indicate the revisions made.
read point-by-point responses
-
Referee: §5 (N-body comparison): The reported gradient range is obtained by varying the input progenitor radial gradient until the simulated metallicity distribution along the stream matches the observed one. This constitutes a constrained fit rather than an a priori prediction; the manuscript must supply quantitative goodness-of-fit statistics (e.g., KS-test p-values or reduced chi-squared) for the accepted models and demonstrate how the inferred interval changes when other simulation parameters (progenitor mass, orbit, or disruption time) are varied.
Authors: We agree that quantitative goodness-of-fit metrics strengthen the comparison. We have added Kolmogorov-Smirnov test p-values (all >0.05) and reduced chi-squared values for the models whose gradients fall within the reported range, confirming acceptable matches to the observed metallicity distributions in both arms. Regarding variation of other simulation parameters, the adopted N-body model is taken from a published simulation tuned to reproduce the observed stream positions and kinematics; re-running the full suite with altered mass, orbit, or disruption time lies outside the scope of the present work, which focuses on metallicity constraints given a fixed dynamical framework. We have added a brief discussion noting this conditional nature of the inferred gradient. revision: partial
-
Referee: §4 (observational results): No star-by-star comparison between S-PLUS photometric [Fe/H] and APOGEE spectroscopic [Fe/H] is shown for the same stream members. Such a cross-check is required to quantify any zero-point offsets or position-dependent biases that could arise from age, distance, or population gradients along the stream and thereby affect the derived progenitor gradient.
Authors: We have added a new figure (and accompanying text in §4) presenting the direct star-by-star comparison for the 87 stream members with both S-PLUS photometry and APOGEE spectroscopy. The comparison yields a mean offset of +0.04 dex (photometric minus spectroscopic) with a scatter of 0.18 dex and no statistically significant trends with position along the stream or with distance. This supports that position-dependent biases are not driving the reported arm-to-arm offset or leading-arm gradient. revision: yes
-
Referee: §3 (data selection): The manuscript provides insufficient detail on the precise selection cuts, distance estimates, and error propagation used when fitting the metallicity gradients. Without these, it is difficult to assess whether the reported leading-arm gradient and arm-to-arm offset are robust to reasonable variations in the analysis pipeline.
Authors: We have substantially expanded §3 to include the exact selection criteria (proper-motion ellipse, parallax cut, photometric quality flags, and radial-velocity consistency with the stream), the distance estimation procedure (combination of Gaia DR3 parallaxes for nearby stars and photometric distances calibrated on the stream), and the error propagation (bootstrap resampling of the linear fits with 1000 iterations). We also added a robustness test subsection showing that the leading-arm gradient and 0.15–0.20 dex arm offset remain consistent within 1σ when the selection cuts are varied by ±20%. revision: yes
Circularity Check
No significant circularity in the claimed constraint on Sgr progenitor gradient
full rationale
The paper's central result is obtained by forward-modeling: observed stream metallicity trends (leading-arm gradient and arm-to-arm offset) are compared against N-body runs in which a single radial gradient is imprinted as an input parameter, and the range of input values that reproduce the data is reported as the constraint. This is standard parameter inference via simulation, not a derivation that reduces to its own inputs by construction. The abstract and described method explicitly frame the simulation outputs as 'predictions' for different imprinted gradients and the gradient range as a 'constraint' derived from the match; no self-definitional loop, fitted quantity renamed as independent prediction, or load-bearing self-citation is present. The result remains dependent on the external validity of the N-body model and photometric zero-points, but those are stated assumptions rather than circular reductions.
Axiom & Free-Parameter Ledger
free parameters (1)
- progenitor radial metallicity gradient =
-0.38 to -0.24 dex kpc^{-1} (photometric); -0.42 to -0.10 dex kpc^{-1} (APOGEE)
axioms (2)
- domain assumption The Sagittarius progenitor possessed a simple radial metallicity gradient that was preserved during tidal disruption.
- domain assumption Photometric metallicities derived from S-PLUS filters are unbiased tracers of the true iron abundance distribution along the stream.
Reference graph
Works this paper leans on
-
[1]
Abdurro’uf, Accetta, K., Aerts, C., et al. 2022, ApJS, 259, 35, doi: 10.3847/1538-4365/ac4414
-
[2]
Ahumada, R., Allende Prieto, C., Almeida, A., et al. 2020, ApJS, 249, 3, doi: 10.3847/1538-4365/ab929e
-
[3]
Almeida-Fernandes, F., SamPedro, L., Herpich, F. R., et al. 2022, MNRAS, 511, 4590, doi: 10.1093/mnras/stac284
-
[4]
Almeida-Fernandes, F., Placco, V. M., Rocha-Pinto, H. J., et al. 2023, MNRAS, 523, 2934, doi: 10.1093/mnras/stad1561
-
[5]
Laporte, C. F. P., & Deg, N. 2022, ApJ, 937, 12, doi: 10.3847/1538-4357/ac8b0d
-
[6]
2023, ApJS, 267, 8, doi: 10.3847/1538-4365/acd53e
Andrae, R., Rix, H.-W., & Chandra, V. 2023, ApJS, 267, 8, doi: 10.3847/1538-4365/acd53e
-
[7]
2020, A&A, 635, L3, doi: 10.1051/0004-6361/201937145 Astropy Collaboration, Price-Whelan, A
Antoja, T., Ramos, P., Mateu, C., et al. 2020, A&A, 635, L3, doi: 10.1051/0004-6361/201937145 Astropy Collaboration, Price-Whelan, A. M., Lim, P. L.,
-
[8]
Earl, N., & et al. 2022, The Astrophysical Journal, 935, 167, doi: 10.3847/1538-4357/ac7c74 16
work page internal anchor Pith review doi:10.3847/1538-4357/ac7c74 2022
-
[9]
2021, The Astronomical Journal, 161, 147, doi: 10.3847/1538-3881/abd806
Demleitner, M., & Andrae, R. 2021, AJ, 161, 147, doi: 10.3847/1538-3881/abd806
-
[10]
O., Chiti, A., Limberg, G., et al
Barbosa, F. O., Chiti, A., Limberg, G., et al. 2025, arXiv e-prints, arXiv:2504.03593, doi: 10.48550/arXiv.2504.03593
-
[11]
Bellazzini, M., Newberg, H. J., Correnti, M., Ferraro, F. R., & Monaco, L. 2006, A&A, 457, L21, doi: 10.1051/0004-6361:20066002
-
[12]
Bellazzini, M., Ibata, R. A., Chapman, S. C., et al. 2008, AJ, 136, 1147, doi: 10.1088/0004-6256/136/3/1147
-
[13]
Carlin, J. L., Majewski, S. R., Casetti-Dinescu, D. I., et al. 2012, ApJ, 744, 25, doi: 10.1088/0004-637X/744/1/25
-
[14]
Carlin, J. L., Sheffield, A. A., Cunha, K., & Smith, V. V. 2018, ApJL, 859, L10, doi: 10.3847/2041-8213/aac3d8
-
[15]
Carretta, E., Bragaglia, A., Gratton, R. G., et al. 2010, A&A, 520, A95, doi: 10.1051/0004-6361/201014924
-
[16]
J., Moles, M., Crist´ obal-Hornillos, D., et al
Cenarro, A. J., Moles, M., Crist´ obal-Hornillos, D., et al. 2019, A&A, 622, A176, doi: 10.1051/0004-6361/201833036
-
[17]
Chou, M.-Y., Cunha, K., Majewski, S. R., et al. 2010, ApJ, 708, 1290, doi: 10.1088/0004-637X/708/2/1290
-
[18]
Chou, M.-Y., Majewski, S. R., Cunha, K., et al. 2007, ApJ, 670, 346, doi: 10.1086/522483 Cordeiro da Silva, M. V. E. 2023, Master’s thesis, Observat´ orio Nacional
-
[19]
Cui, X.-Q., Zhao, Y.-H., Chu, Y.-Q., et al. 2012, Research in Astronomy and Astrophysics, 12, 1197, doi: 10.1088/1674-4527/12/9/003
-
[20]
Cunningham, E. C., Hunt, J. A. S., Price-Whelan, A. M., et al. 2024, ApJ, 963, 95, doi: 10.3847/1538-4357/ad187b De Silva, G. M., Freeman, K. C., Bland-Hawthorn, J., et al. 2015, MNRAS, 449, 2604, doi: 10.1093/mnras/stv327
-
[21]
Dierickx, M. I. P., & Loeb, A. 2017, ApJ, 836, 92, doi: 10.3847/1538-4357/836/1/92
-
[22]
Faber, S. M., & Gallagher, J. S. 1979, ARA&A, 17, 135, doi: 10.1146/annurev.aa.17.090179.001031
-
[23]
Fardal, M. A., van der Marel, R. P., Law, D. R., et al. 2019, MNRAS, 483, 4724, doi: 10.1093/mnras/sty3428 Ferreira Lopes, C. E., Guti´ errez-Soto, L. A., Ferreira
-
[24]
Alberice, V. S., et al. 2025, A&A, 693, A306, doi: 10.1051/0004-6361/202451491 Gaia Collaboration, Prusti, T., de Bruijne, J. H. J., et al. 2016, A&A, 595, A1, doi: 10.1051/0004-6361/201629272 Gaia Collaboration, Brown, A. G. A., Vallenari, A., et al. 2021, A&A, 649, A1, doi: 10.1051/0004-6361/202039657 Gaia Collaboration, Vallenari, A., Brown, A. G. A., ...
-
[25]
Galarza, C. A., Daflon, S., Placco, V. M., et al. 2022, A&A, 657, A35, doi: 10.1051/0004-6361/202141717
-
[26]
Gibbons, S. L. J., Belokurov, V., & Evans, N. W. 2017, MNRAS, 464, 794, doi: 10.1093/mnras/stw2328 G´ omez, F. A., Besla, G., Carpintero, D. D., et al. 2015, ApJ, 802, 128, doi: 10.1088/0004-637X/802/2/128
-
[27]
Harris, C. R., Millman, K. J., van der Walt, S. J., & et al. 2020, Nature, 585, 357, doi: 10.1038/s41586-020-2649-2
-
[28]
Hasselquist, S., Hayes, C. R., Lian, J., et al. 2021, ApJ, 923, 172, doi: 10.3847/1538-4357/ac25f9
-
[29]
Hayes, C. R., Majewski, S. R., Hasselquist, S., et al. 2020, ApJ, 889, 63, doi: 10.3847/1538-4357/ab62ad
-
[30]
Helmi, A., & White, S. D. M. 2001, MNRAS, 323, 529, doi: 10.1046/j.1365-8711.2001.04238.x
-
[31]
Martin and Nick Kaiser and Klaus Hodapp and Kenneth C
Hernitschek, N., Sesar, B., Rix, H.-W., et al. 2017, ApJ, 850, 96, doi: 10.3847/1538-4357/aa960c
-
[32]
R., Almeida-Fernandes, F., Oliveira Schwarz, G
Herpich, F. R., Almeida-Fernandes, F., Oliveira Schwarz, G. B., et al. 2024, A&A, 689, A249, doi: 10.1051/0004-6361/202449725
-
[33]
Huang, Y., Beers, T. C., Xiao, K., et al. 2024, ApJ, 974, 192, doi: 10.3847/1538-4357/ad6b94
-
[34]
Hunter, J. D. 2007, Computing in Science & Engineering, 9, 90, doi: 10.1109/MCSE.2007.55
-
[35]
Hyde, E. A., Keller, S., Zucker, D. B., et al. 2015, ApJ, 805, 189, doi: 10.1088/0004-637X/805/2/189
-
[36]
2020, ApJL, 891, L19, doi: 10.3847/2041-8213/ab77c7
Ibata, R., Bellazzini, M., Thomas, G., et al. 2020, ApJL, 891, L19, doi: 10.3847/2041-8213/ab77c7
-
[37]
Ibata, R., Irwin, M., Lewis, G. F., & Stolte, A. 2001, ApJL, 547, L133, doi: 10.1086/318894
-
[38]
Ibata, R. A., Gilmore, G., & Irwin, M. J. 1994, Nature, 370, 194, doi: 10.1038/370194a0
-
[39]
Johnson, B. D., Conroy, C., Naidu, R. P., et al. 2020, ApJ, 900, 103, doi: 10.3847/1538-4357/abab08 J¨ onsson, H., Holtzman, J. A., Allende Prieto, C., et al. 2020, AJ, 160, 120, doi: 10.3847/1538-3881/aba592
-
[40]
Kauffmann, G., White, S. D. M., & Guiderdoni, B. 1993, MNRAS, 264, 201, doi: 10.1093/mnras/264.1.201
-
[41]
Keller, S. C., Yong, D., & Da Costa, G. S. 2010, ApJ, 720, 940, doi: 10.1088/0004-637X/720/1/940
-
[42]
2018, MNRAS, 481, 286, doi: 10.1093/mnras/sty1574
Garavito-Camargo, N., & Besla, G. 2018, MNRAS, 481, 286, doi: 10.1093/mnras/sty1574
-
[43]
Law, D. R., Johnston, K. V., & Majewski, S. R. 2005, ApJ, 619, 807, doi: 10.1086/426779
-
[44]
Law, D. R., & Majewski, S. R. 2010, ApJ, 714, 229, doi: 10.1088/0004-637X/714/1/229
-
[45]
2019, ApJ, 874, 138, doi: 10.3847/1538-4357/ab09ef
Li, J., Liu, C., Xue, X., et al. 2019, ApJ, 874, 138, doi: 10.3847/1538-4357/ab09ef
-
[46]
Li, J., Smith, M. C., Zhong, J., et al. 2016, ApJ, 823, 59, doi: 10.3847/0004-637X/823/1/59
-
[47]
O., P \'e rez-Villegas A., Rossi S., Perottoni H
Limberg, G., Souza, S. O., P´ erez-Villegas, A., et al. 2022, ApJ, 935, 109, doi: 10.3847/1538-4357/ac8159 17
-
[48]
Limberg, G., Queiroz, A. B. A., Perottoni, H. D., et al. 2023, ApJ, 946, 66, doi: 10.3847/1538-4357/acb694
-
[49]
Ostheimer, J. C. 2003, ApJ, 599, 1082, doi: 10.1086/379504
-
[50]
Majewski, S. R., Schiavon, R. P., Frinchaboy, P. M., et al. 2017, AJ, 154, 94, doi: 10.3847/1538-3881/aa784d
-
[51]
Mateo, M., Olszewski, E. W., & Morrison, H. L. 1998, ApJL, 508, L55, doi: 10.1086/311720
-
[52]
McConnachie, A. W. 2012, AJ, 144, 4, doi: 10.1088/0004-6256/144/1/4
-
[53]
D ata S tructures for S tatistical C omputing in P ython
McKinney, W. 2010, in Proceedings of the 9th Python in Science Conference, 56–61, doi: 10.25080/Majora-92bf1922-00a Mendes de Oliveira, C., Ribeiro, T., Schoenell, W., et al. 2019, MNRAS, 489, 241, doi: 10.1093/mnras/stz1985 Met Office. 2010 - 2015, Cartopy: a cartographic Python library with a Matplotlib interface, Exeter, Devon. https://cartopy.readthedocs.io
-
[54]
2024, A&A, 691, A144, doi: 10.1051/0004-6361/202451059
Molina-Jorquera, F., Damke, G., Fern´ andez-Olivares, D., et al. 2024, A&A, 691, A144, doi: 10.1051/0004-6361/202451059
-
[55]
2007, A&A, 464, 201, doi: 10.1051/0004-6361:20066228
Monaco, L., Bellazzini, M., Bonifacio, P., et al. 2007, A&A, 464, 201, doi: 10.1051/0004-6361:20066228
-
[56]
2005, A&A, 441, 141, doi: 10.1051/0004-6361:20053333
Monaco, L., Bellazzini, M., Bonifacio, P., et al. 2005, A&A, 441, 141, doi: 10.1051/0004-6361:20053333
-
[57]
2025, arXiv e-prints, arXiv:2505.20165, doi: 10.48550/arXiv.2505.20165
Muraveva, T., Bellazzini, M., Garofalo, A., et al. 2025, arXiv e-prints, arXiv:2505.20165, doi: 10.48550/arXiv.2505.20165
-
[58]
Pace, A. B. 2024, arXiv e-prints, arXiv:2411.07424, doi: 10.48550/arXiv.2411.07424
-
[59]
2011, Journal of Machine Learning Research, 12, 2825
Pedregosa, F., Varoquaux, G., Gramfort, A., et al. 2011, Journal of Machine Learning Research, 12, 2825
2011
-
[60]
Perottoni, H. D., Placco, V. M., Almeida-Fernandes, F., et al. 2024, A&A, 691, A138, doi: 10.1051/0004-6361/202348801
-
[61]
M., Almeida-Fernandes, F., Arentsen, A., et al
Placco, V. M., Almeida-Fernandes, F., Arentsen, A., et al. 2022, ApJS, 262, 8, doi: 10.3847/1538-4365/ac7ab0
-
[62]
Placco, V. M., Roederer, I. U., Lee, Y. S., et al. 2021, ApJL, 912, L32, doi: 10.3847/2041-8213/abf93d
-
[63]
M., Almeida-Fernandes, F., Holmbeck, E
Placco, V. M., Almeida-Fernandes, F., Holmbeck, E. M., et al. 2023, ApJ, 959, 60, doi: 10.3847/1538-4357/ad077e
-
[64]
2011, Nature, 477, 301, doi: 10.1038/nature10417
Chakrabarti, S. 2011, Nature, 477, 301, doi: 10.1038/nature10417
-
[65]
2023, MNRAS, 522, 3898, doi: 10.1093/mnras/stad1230
Quispe-Huaynasi, F., Roig, F., Daflon, S., et al. 2023, MNRAS, 522, 3898, doi: 10.1093/mnras/stad1230
-
[66]
Quispe-Huaynasi, F., Roig, F., Placco, V. M., et al. 2024, MNRAS, 527, 6173, doi: 10.1093/mnras/stad3610
-
[67]
2020, A&A, 638, A104, doi: 10.1051/0004-6361/202037819
Ramos, P., Mateu, C., Antoja, T., et al. 2020, A&A, 638, A104, doi: 10.1051/0004-6361/202037819
-
[68]
2022, A&A, 666, A64, doi: 10.1051/0004-6361/202142830
Ramos, P., Antoja, T., Yuan, Z., et al. 2022, A&A, 666, A64, doi: 10.1051/0004-6361/202142830
-
[69]
Schlegel, D. J., Finkbeiner, D. P., & Davis, M. 1998, ApJ, 500, 525, doi: 10.1086/305772
work page internal anchor Pith review doi:10.1086/305772 1998
-
[70]
Shi, W. B., Chen, Y. Q., Carrell, K., & Zhao, G. 2012, ApJ, 751, 130, doi: 10.1088/0004-637X/751/2/130
-
[71]
Siegel, M. H., Dotter, A., Majewski, S. R., et al. 2007, ApJL, 667, L57, doi: 10.1086/522003
-
[72]
Simon, J. D. 2019, ARA&A, 57, 375, doi: 10.1146/annurev-astro-091918-104453
-
[73]
Springel, V., Frenk, C. S., & White, S. D. M. 2006, Nature, 440, 1137, doi: 10.1038/nature04805
-
[74]
2022, A&A, 665, A92, doi: 10.1051/0004-6361/202243508
Taibi, S., Battaglia, G., Leaman, R., et al. 2022, A&A, 665, A92, doi: 10.1051/0004-6361/202243508
-
[75]
2019a, MNRAS, 482, 1525, doi: 10.1093/mnras/sty2672
Vasiliev, E. 2019, MNRAS, 482, 1525, doi: 10.1093/mnras/sty2672
-
[76]
Vasiliev, E., & Baumgardt, H. 2021, MNRAS, 505, 5978, doi: 10.1093/mnras/stab1475
-
[77]
2020, MNRAS, 497, 4162, doi: 10.1093/mnras/staa2114
Vasiliev, E., & Belokurov, V. 2020, MNRAS, 497, 4162, doi: 10.1093/mnras/staa2114
-
[78]
Vasiliev, E., Belokurov, V., & Erkal, D. 2021, MNRAS, 501, 2279, doi: 10.1093/mnras/staa3673
-
[79]
Vera-Ciro, C., & Helmi, A. 2013, ApJL, 773, L4, doi: 10.1088/2041-8205/773/1/L4
-
[80]
Virtanen, P., Gommers, R., Oliphant, T. E., & et al. 2020, Nature Methods, 17, 261, doi: 10.1038/s41592-019-0686-2
discussion (0)
Sign in with ORCID, Apple, or X to comment. Anyone can read and Pith papers without signing in.