Recognition: unknown
The Role of Cluster Environments in Quiescent Galaxy Stellar Halo Assembly
Pith reviewed 2026-05-10 07:35 UTC · model grok-4.3
The pith
Cluster quiescent galaxies assemble stellar haloes faster than field ones if massive, but slower if less massive, over 0.1 to 1 in redshift.
A machine-rendered reading of the paper's core claim, the machinery that carries it, and where it could break.
Core claim
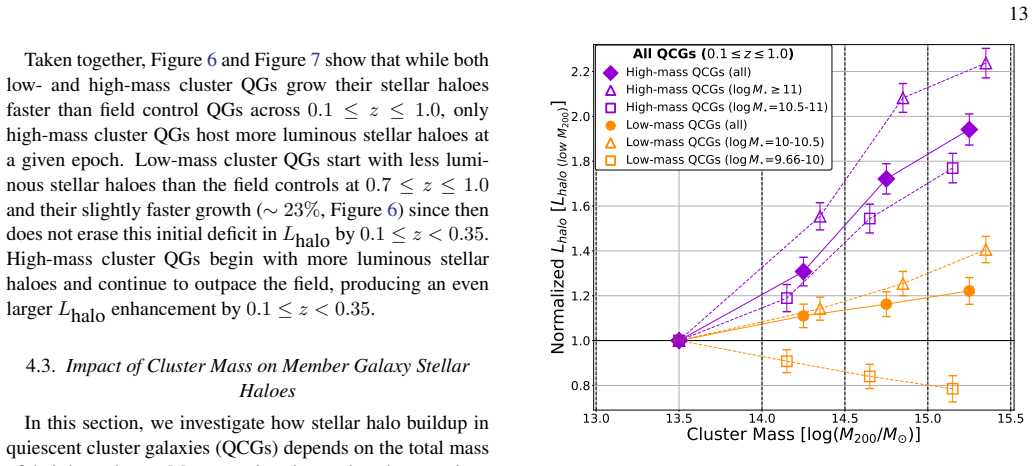
Over 0.1 ≤ z ≤ 1.0, quiescent galaxies in clusters build up their stellar haloes faster than those in the field, shown by a 23% larger increase in integrated halo luminosity for low-mass systems and a 40% larger increase for high-mass systems. High-mass cluster quiescent galaxies host more luminous haloes on average while low-mass cluster ones host less luminous haloes. Halo luminosity rises with host cluster mass for galaxies above log stellar mass 10 but falls for lower-mass cluster galaxies, pointing to enhanced merger accretion for the massive systems and stripping or loss of outer material for the less massive ones.
What carries the argument
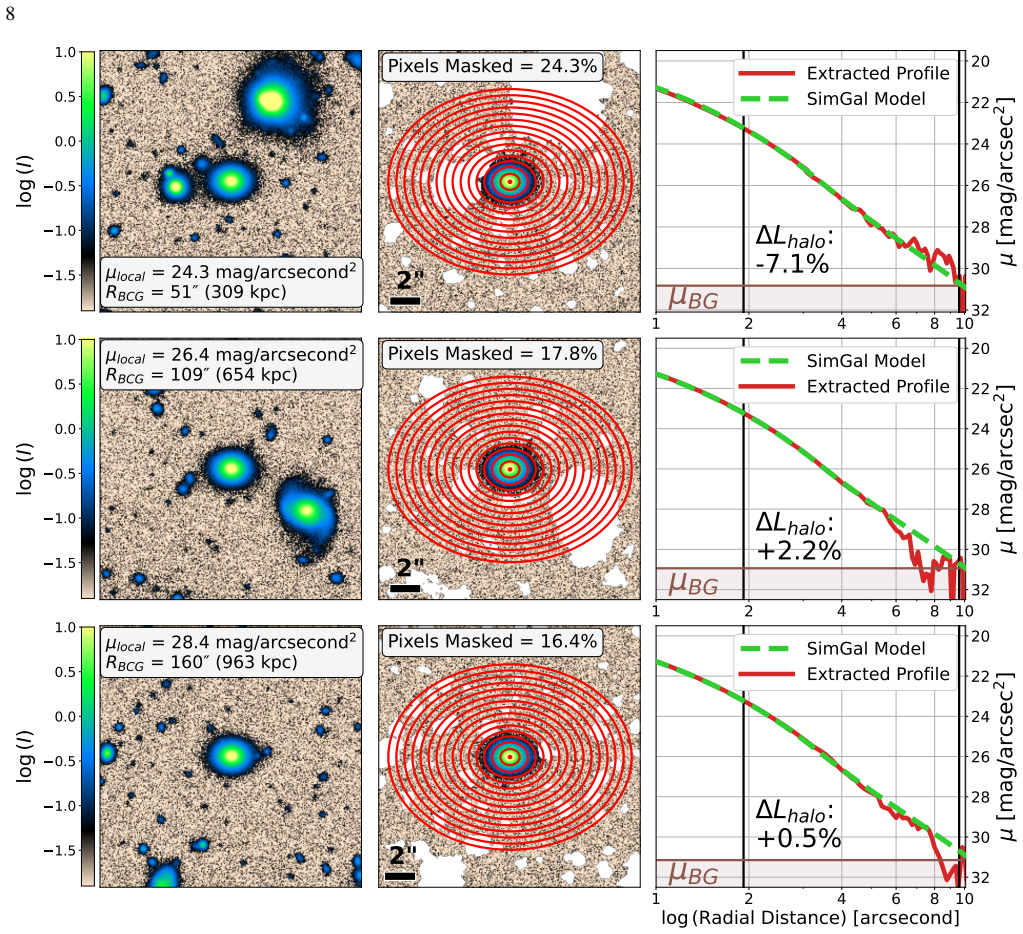
The evolution of rest-frame g-band surface brightness profiles extracted from deep imaging, used to compute integrated stellar halo luminosity as a tracer of hierarchical accretion-driven assembly and compared directly between cluster and field quiescent galaxy samples.
Load-bearing premise
That rest-frame g-band surface brightness profiles cleanly trace stellar halo assembly via hierarchical accretion without substantial contamination from intracluster light, background subtraction errors, or selection biases in identifying quiescent galaxies across environments.
What would settle it
A measurement of stellar halo masses or luminosities using independent techniques such as resolved stellar populations or dynamical modeling in matched cluster and field samples at 0.1 < z < 1 that shows no difference in assembly rates between environments.
Figures


read the original abstract
External interactions drive galaxy stellar mass growth and morphological evolution. As stellar haloes-assembled largely via hierarchical accretion-preserve signatures of these processes, their growth probes how environment regulates galaxy evolution. We investigate how cluster environments influence quiescent galaxy (QG) stellar halo assembly over 0.1 $\leq$ $z$ $\leq$ 1.0 in a sample of 2,168 cluster and 94,479 field QGs of $\log M_{\star} \geq 9.66$. Extended emission is traced via rest-frame $g$-band surface brightness ($\mu_g$) profiles extracted from deep HSC-SSP $grizy$ imaging. We study stellar halo assembly trends by linking median $\mu_g$ profile evolution to the underlying mass growth in galaxy subpopulations. Over 0.1 $\leq$ $z$ $\leq$ 1.0, cluster QGs build up stellar haloes faster than field QGs, with a $\sim23\%$ and $\sim40\%$ larger increase in integrated stellar halo luminosity ($L_{halo}$) in the low-mass ($9.66 \leq \log M_{\star} < 10.5$) and high-mass ($\log M_{\star} \geq 10.5$) samples, respectively. High-mass cluster QGs host more luminous stellar haloes than the field (mean cluster-to-field $L_{halo}$ ratio of $\sim1.2$), while low-mass cluster QGs host less luminous stellar haloes (mean ratio of $\sim0.87$). Among cluster QGs of $\log M_{\star} \geq 10$, $L_{halo}$ increases with host cluster mass, but decreases for cluster QGs of $\log M_{\star} < 10$. These results suggest higher-mass cluster QGs ($\log M_{\star} \geq 10$) experience enhanced stellar halo growth over 0.1 $\leq$ $z$ $\leq$ 1.0 fueled by increased merger-driven accretion, likely from minor mergers in cluster outskirts or in pre-infall group and filament environments. Lower-mass cluster QGs ($9.66 \leq \log M_{\star} < 10$) instead have suppressed stellar halo growth in clusters and likely lose outer stellar material to environmental stripping or accretion by high-mass galaxies during mergers.
Editorial analysis
A structured set of objections, weighed in public.
Referee Report
Summary. The manuscript presents an observational study of stellar halo assembly in quiescent galaxies (QGs) in cluster versus field environments over 0.1 ≤ z ≤ 1.0, using a sample of 2,168 cluster and 94,479 field QGs with log M⋆ ≥ 9.66 from HSC-SSP imaging. By analyzing rest-frame g-band surface brightness profiles, it reports that cluster QGs exhibit faster stellar halo build-up, with ~23% and ~40% larger increases in integrated stellar halo luminosity (L_halo) for low-mass (9.66 ≤ log M⋆ < 10.5) and high-mass (log M⋆ ≥ 10.5) samples, respectively. High-mass cluster QGs have a mean cluster-to-field L_halo ratio of ~1.2, while low-mass have ~0.87, with trends depending on cluster mass.
Significance. If the measurements accurately isolate galaxy stellar haloes from intracluster light and other contaminants, this study offers valuable insights into environmental regulation of hierarchical accretion and stellar mass assembly in QGs. The large sample size and redshift baseline allow for statistically robust comparisons between cluster and field populations, potentially constraining models of galaxy evolution in dense environments. The mass-dependent trends highlight differential effects on high- and low-mass systems.
major comments (2)
- [Abstract] Abstract: The central claims of faster halo build-up (~23% and ~40% larger L_halo increases) and mass-dependent cluster-to-field ratios (~1.2 vs. ~0.87) rely on integrated L_halo derived from rest-frame g-band μ_g profiles. The abstract provides no quantitative details on intracluster light (ICL) subtraction, masking, or modeling, which is a load-bearing step because ICL is expected to contribute at large radii and low surface brightness in clusters; without this, the reported enhancements for high-mass cluster QGs could partly trace ICL assembly rather than galaxy-specific halo growth via mergers.
- [Abstract] Abstract: No information is given on the radial fitting ranges for the surface brightness profiles, the exact definition and integration limits for L_halo, error bar estimation, completeness corrections, or background subtraction robustness. These omissions prevent verification of the quantitative trends and their statistical significance.
minor comments (2)
- [Abstract] The redshift range 0.1 ≤ z ≤ 1.0 is repeated multiple times in the abstract; streamlining this would improve conciseness.
- Notation for stellar mass (log M⋆) and luminosity (L_halo) should be checked for consistency with the full manuscript, including any tables or figures.
Simulated Author's Rebuttal
We thank the referee for their careful and constructive review. The comments correctly identify that the abstract is too concise on key methodological steps. We have revised the abstract to include brief but informative details on ICL handling, profile ranges, and L_halo definition while preserving its length and focus. Point-by-point responses follow.
read point-by-point responses
-
Referee: [Abstract] Abstract: The central claims of faster halo build-up (~23% and ~40% larger L_halo increases) and mass-dependent cluster-to-field ratios (~1.2 vs. ~0.87) rely on integrated L_halo derived from rest-frame g-band μ_g profiles. The abstract provides no quantitative details on intracluster light (ICL) subtraction, masking, or modeling, which is a load-bearing step because ICL is expected to contribute at large radii and low surface brightness in clusters; without this, the reported enhancements for high-mass cluster QGs could partly trace ICL assembly rather than galaxy-specific halo growth via mergers.
Authors: We agree that the abstract should explicitly reference the ICL subtraction procedure so that readers can immediately assess whether the reported L_halo trends isolate galaxy stellar halos. The full manuscript describes the masking of neighboring galaxies and the modeling of the diffuse ICL component fitted to the outer light profile. We have revised the abstract to state that 'intracluster light is subtracted via masking and outer-profile modeling' prior to presenting the L_halo results. This addition directly addresses the concern that the high-mass cluster enhancement could be contaminated by ICL while keeping the abstract concise. revision: yes
-
Referee: [Abstract] Abstract: No information is given on the radial fitting ranges for the surface brightness profiles, the exact definition and integration limits for L_halo, error bar estimation, completeness corrections, or background subtraction robustness. These omissions prevent verification of the quantitative trends and their statistical significance.
Authors: We acknowledge that these technical specifications are absent from the original abstract. They are fully documented in the methods and results sections, but the referee is correct that their omission hinders immediate verification. We have therefore added a single sentence to the abstract summarizing the key choices: surface-brightness profiles are measured over a fixed radial range, L_halo is integrated within well-defined limits after background subtraction, and uncertainties incorporate bootstrap resampling and completeness corrections. This revision supplies the necessary context without expanding the abstract beyond its intended scope. revision: yes
Circularity Check
No circularity: purely observational comparison of measured profiles and luminosities
full rationale
The paper reports direct measurements of rest-frame g-band surface brightness profiles extracted from HSC-SSP imaging for 2,168 cluster and 94,479 field quiescent galaxies. Integrated L_halo values are computed from these profiles and compared across mass bins, environments, and redshift ranges 0.1 ≤ z ≤ 1.0. No equations, fitted parameters, or self-citations are invoked to derive the reported trends (∼23–40% larger L_halo increase in clusters, mass-dependent cluster-to-field ratios). The derivation chain consists solely of data reduction steps (profile extraction, integration, median stacking) applied to independent observations; none reduce by construction to the inputs or to prior self-citations. This is a standard observational study whose central claims remain independent of any self-referential loop.
Axiom & Free-Parameter Ledger
free parameters (2)
- Stellar mass division at log M⋆ = 10
- Redshift bounds 0.1 ≤ z ≤ 1.0
axioms (2)
- domain assumption Stellar haloes are assembled largely via hierarchical accretion
- domain assumption Rest-frame g-band surface brightness profiles trace stellar halo luminosity growth
Reference graph
Works this paper leans on
-
[1]
Abadi, M. G., Moore, B., & Bower, R. G. 1999, MNRAS, 308, 947, doi: 10.1046/j.1365-8711.1999.02715.x
-
[2]
Afanasiev, A. V ., Mei, S., Fu, H., et al. 2023, A&A, 670, A95, doi: 10.1051/0004-6361/202244634
-
[3]
Aguerri, J. A. L., Iglesias-Paramo, J., Vilchez, J. M., & Mu˜noz-Tu˜n´on, C. 2004, AJ, 127, 1344, doi: 10.1086/382107
-
[4]
Aihara, H., AlSayyad, Y ., Ando, M., et al. 2019, PASJ, 71, 114, doi: 10.1093/pasj/psz103 —. 2022, PASJ, 74, 247, doi: 10.1093/pasj/psab122
-
[5]
2023, AJ, 166, 25, doi: 10.3847/1538-3881/acd773
Annunziatella, M., Sajina, A., Stefanon, M., et al. 2023, AJ, 166, 25, doi: 10.3847/1538-3881/acd773
-
[6]
2013, A&A, 558, A67, doi: 10.1051/0004-6361/201321768 Astropy Collaboration, Robitaille, T
Arnouts, S., Le Floc’h, E., Chevallard, J., et al. 2013, A&A, 558, A67, doi: 10.1051/0004-6361/201321768 Astropy Collaboration, Robitaille, T. P., Tollerud, E. J., et al. 2013, A&A, 558, A33, doi: 10.1051/0004-6361/201322068 Bah´e, Y . M., & McCarthy, I. G. 2015, MNRAS, 447, 969, doi: 10.1093/mnras/stu2293
-
[7]
Bell, E. F., Naab, T., McIntosh, D. H., et al. 2006, ApJ, 640, 241, doi: 10.1086/499931
-
[8]
Bergin, E. A., & Tafalla, M. 2007, ARA&A, 45, 339, doi: 10.1146/annurev.astro.45.071206.100404
-
[9]
Bernardi, M., Roche, N., Shankar, F., & Sheth, R. K. 2011, MNRAS, 412, L6, doi: 10.1111/j.1745-3933.2010.00982.x
-
[10]
Bezanson, R., van Dokkum, P. G., Tal, T., et al. 2009, ApJ, 697, 1290, doi: 10.1088/0004-637X/697/2/1290
-
[11]
2015, A&A, 576, A103, doi: 10.1051/0004-6361/201425235
Bialas, D., Lisker, T., Olczak, C., Spurzem, R., & Kotulla, R. 2015, A&A, 576, A103, doi: 10.1051/0004-6361/201425235
-
[12]
Blanton, M. R., & Moustakas, J. 2009, ARA&A, 47, 159, doi: 10.1146/annurev-astro-082708-101734
-
[13]
2023, MNRAS, 519, 5202, doi: 10.1093/mnras/stac3759
Boecker, A., Neumayer, N., Pillepich, A., et al. 2023, MNRAS, 519, 5202, doi: 10.1093/mnras/stac3759
-
[14]
Borlaff, A., Eliche-Moral, M. C., Beckman, J. E., et al. 2017, A&A, 604, A119, doi: 10.1051/0004-6361/201630282
-
[15]
2018, PASJ, 70, S5, doi: 10.1093/pasj/psx080
Bosch, J., Armstrong, R., Bickerton, S., et al. 2018, PASJ, 70, S5, doi: 10.1093/pasj/psx080
-
[16]
2022, A&ARv, 30, 3, doi: 10.1007/s00159-022-00140-3
Boselli, A., Fossati, M., & Sun, M. 2022, A&A Rv, 30, 3, doi: 10.1007/s00159-022-00140-3
-
[17]
2006, PASP, 118, 517, doi: 10.1086/500691 Bouch´ e, N., Dekel, A., Genzel, R., et al
Boselli, A., & Gavazzi, G. 2006, PASP, 118, 517, doi: 10.1086/500691
-
[18]
Bottrell, C., Yesuf, H. M., Popping, G., et al. 2024, MNRAS, 527, 6506, doi: 10.1093/mnras/stad2971
-
[19]
Bouwens, R. J., & Silk, J. 1996, ApJL, 471, L19, doi: 10.1086/310329
-
[20]
Boylan-Kolchin, M., Ma, C.-P., & Quataert, E. 2005, MNRAS, 362, 184, doi: 10.1111/j.1365-2966.2005.09278.x
-
[21]
Bradley, L., Sip˝ocz, B., Robitaille, T., et al. 2022, astropy/photutils: 1.5.0, 1.5.0, Zenodo, Zenodo, doi: 10.5281/zenodo.6825092
-
[22]
2017, MNRAS, 466, 1275, doi: 10.1093/mnras/stw2991
Brown, T., Catinella, B., Cortese, L., et al. 2017, MNRAS, 466, 1275, doi: 10.1093/mnras/stw2991
-
[23]
Brown, T., Roberts, I. D., Thorp, M., et al. 2023, ApJ, 956, 37, doi: 10.3847/1538-4357/acf195
-
[24]
Bruzual, G., & Charlot, S. 2003, MNRAS, 344, 1000, doi: 10.1046/j.1365-8711.2003.06897.x
-
[25]
2017, MNRAS, 466, 4888, doi: 10.1093/mnras/stw3382
Buitrago, F., Trujillo, I., Curtis-Lake, E., et al. 2017, MNRAS, 466, 4888, doi: 10.1093/mnras/stw3382
-
[26]
Byrne-Mamahit, S., Ellison, S. L., Patton, D. R., et al. 2025, MNRAS, 544, 1673, doi: 10.1093/mnras/staf1765
-
[27]
Carollo, C. M., Bschorr, T. J., Renzini, A., et al. 2013, ApJ, 773, 112, doi: 10.1088/0004-637X/773/2/112
-
[28]
2003, PASP, 115, 763, doi: 10.1086/376392
Chabrier, G. 2003, PASP, 115, 763, doi: 10.1086/376392
work page internal anchor Pith review doi:10.1086/376392 2003
-
[29]
Chamba, N., Trujillo, I., & Knapen, J. H. 2022, A&A, 667, A87, doi: 10.1051/0004-6361/202243612
-
[30]
2025, Phd thesis, Saint Mary’s University, Halifax, NS, Canada
Chen, L. 2025, Phd thesis, Saint Mary’s University, Halifax, NS, Canada. https://library2.smu.ca/handle/01/32620
2025
-
[31]
2024, ApJ, 961, 253, doi: 10.3847/1538-4357/ad15fd
Chen, Z., Gu, Y ., Zou, H., & Yuan, Q. 2024, ApJ, 961, 253, doi: 10.3847/1538-4357/ad15fd
-
[32]
Christensen, C. R., Brooks, A. M., Munshi, F., et al. 2024, ApJ, 961, 236, doi: 10.3847/1538-4357/ad0c5a
-
[33]
Cirasuolo, M., Fairley, A., Rees, P., et al. 2020, The Messenger, 180, 10, doi: 10.18727/0722-6691/5195
-
[34]
Conselice, C. J. 2003, ApJS, 147, 1, doi: 10.1086/375001
-
[35]
Conselice, C. J., Mundy, C. J., Ferreira, L., & Duncan, K. 2022, ApJ, 940, 168, doi: 10.3847/1538-4357/ac9b1a
-
[36]
2021, Galaxies, 9, 60, doi: 10.3390/galaxies9030060
Contini, E. 2021, Galaxies, 9, 60, doi: 10.3390/galaxies9030060
-
[37]
Contini, E., Yi, S. K., & Jeon, S. 2024, arXiv e-prints, arXiv:2404.01560, doi: 10.48550/arXiv.2404.01560
-
[38]
2016, ApJ, 833, 158, doi: 10.3847/1538-4357/833/2/158
Hernquist, L. 2016, ApJ, 833, 158, doi: 10.3847/1538-4357/833/2/158
-
[39]
Monthly Notices of the Royal Astronomical Society , author =
Cooper, A. P., Cole, S., Frenk, C. S., et al. 2010, MNRAS, 406, 744, doi: 10.1111/j.1365-2966.2010.16740.x
-
[40]
2005, ApJ, 626, 680, doi: 10.1086/430104
Daddi, E., Renzini, A., Pirzkal, N., et al. 2005, ApJ, 626, 680, doi: 10.1086/430104 24
-
[41]
J., Utsumi, Y ., & Dell’Antonio, I
Damjanov, I., Sohn, J., Geller, M. J., Utsumi, Y ., & Dell’Antonio, I. 2022, arXiv e-prints, arXiv:2210.01129. https://arxiv.org/abs/2210.01129
-
[42]
Damjanov, I., Zahid, H. J., Geller, M. J., et al. 2019, ApJ, 872, 91, doi: 10.3847/1538-4357/aaf97d
-
[43]
Damjanov, I., McCarthy, P. J., Abraham, R. G., et al. 2009, ApJ, 695, 101, doi: 10.1088/0004-637X/695/1/101
-
[44]
Davies, L. J. M., Robotham, A. S. G., Lagos, C. d. P., et al. 2019, MNRAS, 483, 5444, doi: 10.1093/mnras/sty3393
-
[45]
Davison, T. A., Norris, M. A., Pfeffer, J. L., Davies, J. J., & Crain, R. A. 2020, MNRAS, 497, 81, doi: 10.1093/mnras/staa1816 de Jong, R. S. 2008, MNRAS, 388, 1521, doi: 10.1111/j.1365-2966.2008.13505.x De Lucia, G., Hirschmann, M., & Fontanot, F. 2019, MNRAS, 482, 5041, doi: 10.1093/mnras/sty3059
-
[46]
Debattista, V . P., Ness, M., Gonzalez, O. A., et al. 2017, MNRAS, 469, 1587, doi: 10.1093/mnras/stx947
-
[47]
Delahaye, A. G., Webb, T. M. A., Nantais, J., et al. 2017, ApJ, 843, 126, doi: 10.3847/1538-4357/aa756a DESI Collaboration, Adame, A. G., Aguilar, J., et al. 2024, AJ, 168, 58, doi: 10.3847/1538-3881/ad3217
-
[48]
2023, A&A, 670, A82, doi: 10.1051/0004-6361/202243363
Desprez, G., Picouet, V ., Moutard, T., et al. 2023, A&A, 670, A82, doi: 10.1051/0004-6361/202243363
-
[49]
Dey, A., Najita, J. R., Koposov, S. E., et al. 2023, ApJ, 944, 1, doi: 10.3847/1538-4357/aca5f8
-
[50]
Dressler, A. 1984, ARA&A, 22, 185, doi: 10.1146/annurev.astro.22.1.185 D’Souza, R., Kauffman, G., Wang, J., & Vegetti, S. 2014, MNRAS, 443, 1433, doi: 10.1093/mnras/stu1194
-
[51]
Dulcien, C., Jaffe, Y . L., Crossett, J. P., et al. 2026, arXiv e-prints, arXiv:2603.06821, doi: 10.48550/arXiv.2603.06821
-
[52]
Edwards, L. O. V ., Hamel, K. A. S. J., Shy, J. C., et al. 2024, MNRAS, 530, 3924, doi: 10.1093/mnras/stae1055
-
[53]
Elias, L. M., Sales, L. V ., Creasey, P., et al. 2018, MNRAS, 479, 4004, doi: 10.1093/mnras/sty1718
-
[54]
L., Catinella, B., & Cortese, L
Ellison, S. L., Catinella, B., & Cortese, L. 2018, MNRAS, 478, 3447, doi: 10.1093/mnras/sty1247
-
[55]
Ellison, S. L., & Ferreira, L. 2025, arXiv e-prints, arXiv:2511.21512, doi: 10.48550/arXiv.2511.21512
work page internal anchor Pith review Pith/arXiv arXiv doi:10.48550/arxiv.2511.21512 2025
-
[56]
The observational properties of post-merger galaxies
Ellison, S. L., Mendel, J. T., Patton, D. R., & Scudder, J. M. 2013, MNRAS, 435, 3627, doi: 10.1093/mnras/stt1562
-
[57]
Monthly Notices of the Royal Astronomical Society , author =
Ellison, S. L., Simard, L., Cowan, N. B., et al. 2009, MNRAS, 396, 1257, doi: 10.1111/j.1365-2966.2009.14817.x
-
[58]
Ellison, S. L., Thorp, M. D., Pan, H.-A., et al. 2020, MNRAS, 492, 6027, doi: 10.1093/mnras/staa001 Euclid Collaboration, Gentile, F., Daddi, E., et al. 2025a, arXiv e-prints, arXiv:2511.02964, doi: 10.48550/arXiv.2511.02964 Euclid Collaboration, Mellier, Y ., Abdurro’uf, et al. 2025b, A&A, 697, A1, doi: 10.1051/0004-6361/202450810
-
[59]
Fabian, A. C. 2012, ARA&A, 50, 455, doi: 10.1146/annurev-astro-081811-125521
work page internal anchor Pith review doi:10.1146/annurev-astro-081811-125521 2012
-
[60]
Monthly Notices of the Royal Astronomical Society , author =
Fakhouri, O., & Ma, C.-P. 2009, MNRAS, 394, 1825, doi: 10.1111/j.1365-2966.2009.14480.x
-
[61]
2016, MNRAS, 463, 1907, doi: 10.1093/mnras/stw2108
Fang, Y ., Clampitt, J., Dalal, N., et al. 2016, MNRAS, 463, 1907, doi: 10.1093/mnras/stw2108
-
[62]
2024, A&A, 687, A117, doi: 10.1051/0004-6361/202347774
Figueira, M., Siudek, M., Pollo, A., et al. 2024, A&A, 687, A117, doi: 10.1051/0004-6361/202347774
-
[63]
Fillingham, S. P., Cooper, M. C., Boylan-Kolchin, M., et al. 2018, MNRAS, 477, 4491, doi: 10.1093/mnras/sty958
-
[64]
Fillingham, S. P., Cooper, M. C., Pace, A. B., et al. 2016, MNRAS, 463, 1916, doi: 10.1093/mnras/stw2131
-
[65]
G., Kelson, D., & Illingworth, G
Franx, M., van Dokkum, P. G., Kelson, D., & Illingworth, G. D. 2000, in ASP Conference Series, V ol. 197, Dynamics of Galaxies, 231
2000
-
[66]
Geda, R., Crawford, S. M., Hunt, L., et al. 2022, AJ, 163, 202, doi: 10.3847/1538-3881/ac5908
-
[67]
2024, MNRAS, 528, 4797, doi: 10.1093/mnras/stae154 —
George, A., Damjanov, I., Sawicki, M., et al. 2024, MNRAS, 528, 4797, doi: 10.1093/mnras/stae154 —. 2025, ApJ, 987, 45, doi: 10.3847/1538-4357/addc6b George et al. in prep., Bulge+Disk Morphology in Rest-frame UV and Optical: Size–Mass Relations Reveal Distinct Growth Paths for Star-forming and Quiescent Galaxies. G´eron, T., Smethurst, R. J., Lintott, C....
-
[68]
2022, ApJ, 932, 44, doi: 10.3847/1538-4357/ac6750
Gilhuly, C., Merritt, A., Abraham, R., et al. 2022, ApJ, 932, 44, doi: 10.3847/1538-4357/ac6750
-
[69]
Gladders, M. D., & Yee, H. K. C. 2005, ApJS, 157, 1, doi: 10.1086/427327
-
[70]
Gnedin, O. Y . 2003, ApJ, 582, 141, doi: 10.1086/344636
-
[71]
Golden-Marx, J. B., Zhang, Y ., Ogando, R. L. C., et al. 2023, MNRAS, 521, 478, doi: 10.1093/mnras/stad469
-
[72]
Goto, T. 2005, MNRAS, 359, 1415, doi: 10.1111/j.1365-2966.2005.08982.x
-
[73]
Graham, A. W., & Driver, S. P. 2005, PASA, 22, 118, doi: 10.1071/AS05001
-
[74]
Greene, J., Bezanson, R., Ouchi, M., Silverman, J., & the PFS Galaxy Evolution Working Group. 2022, arXiv e-prints, arXiv:2206.14908, doi: 10.48550/arXiv.2206.14908
-
[75]
2021, ApJ, 921, 60, doi: 10.3847/1538-4357/ac1ce0
Gu, Y ., Fang, G., Yuan, Q., Lu, S., & Liu, S. 2021, ApJ, 921, 60, doi: 10.3847/1538-4357/ac1ce0
-
[76]
Monthly Notices of the Royal Astronomical Society , author =
Guo, Y ., McIntosh, D. H., Mo, H. J., et al. 2009, MNRAS, 398, 1129, doi: 10.1111/j.1365-2966.2009.15223.x
-
[77]
Hahn, C., Blanton, M. R., Moustakas, J., et al. 2015, ApJ, 806, 162, doi: 10.1088/0004-637X/806/2/162
-
[78]
Harris, C. R., Millman, K. J., van der Walt, S. J., et al. 2020, Nature, 585, 357, doi: 10.1038/s41586-020-2649-2
-
[79]
1997, ARA&A, 35, 357, doi: 10.1146/annurev.astro.35.1.357 25
Hickson, P. 1997, ARA&A, 35, 357, doi: 10.1146/annurev.astro.35.1.357 25
-
[80]
Hilz, M., Naab, T., & Ostriker, J. P. 2013, MNRAS, 429, 2924, doi: 10.1093/mnras/sts501
discussion (0)
Sign in with ORCID, Apple, or X to comment. Anyone can read and Pith papers without signing in.