Recognition: unknown
Analysis of synthetic OVI absorption associated with galaxy groups in SIMBA and TNG50 simulations
Pith reviewed 2026-05-10 03:30 UTC · model grok-4.3
The pith
Simulations of galaxy groups yield lower OVI covering fractions than observed in the COS-IGrM survey.
A machine-rendered reading of the paper's core claim, the machinery that carries it, and where it could break.
Core claim
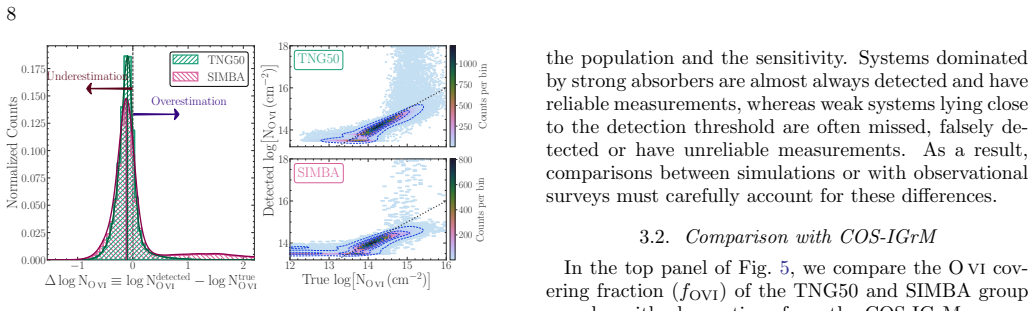
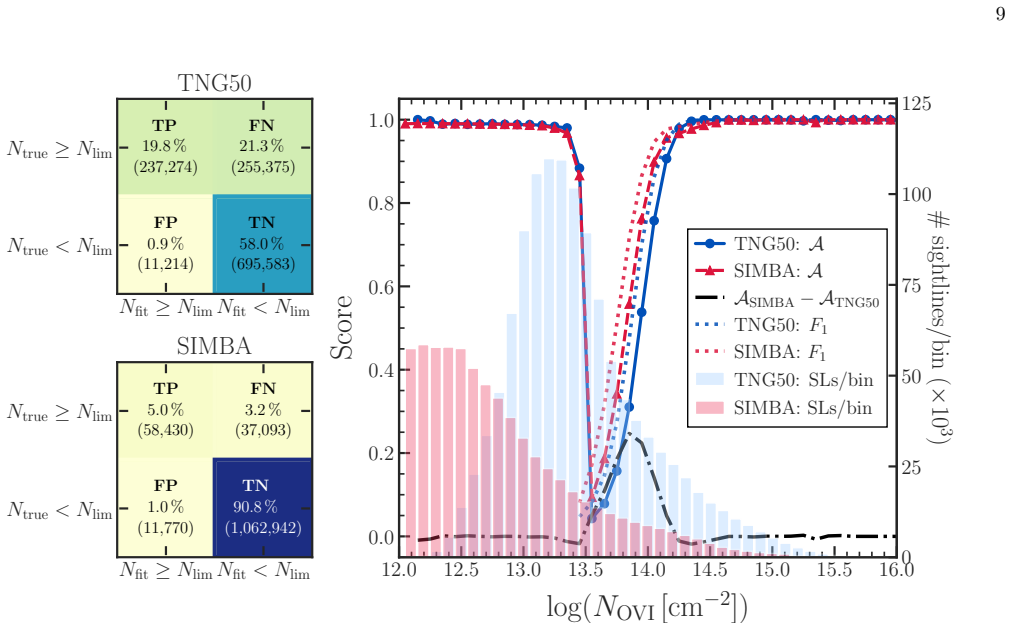
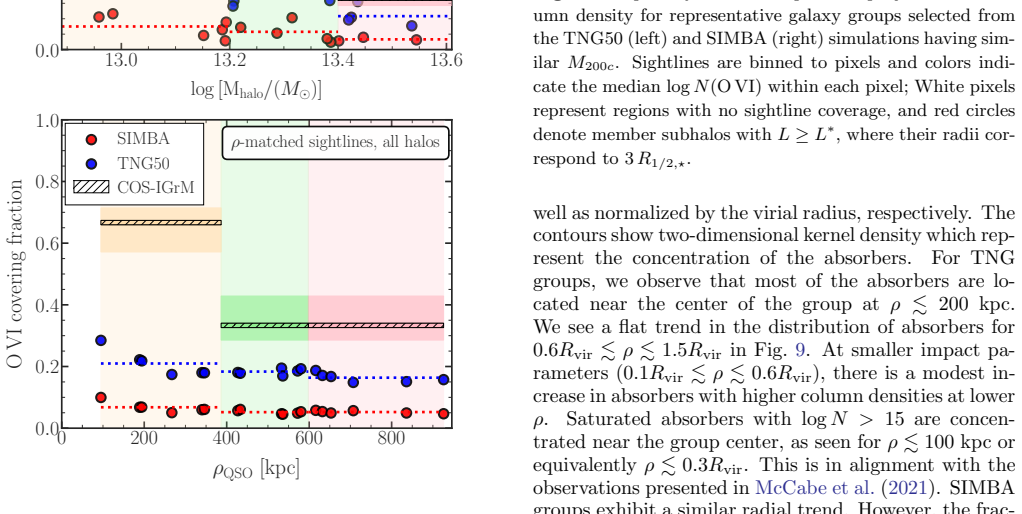
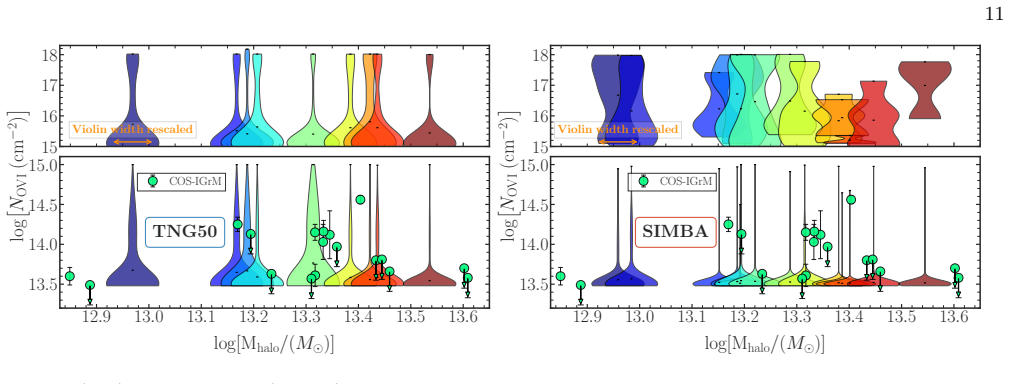
The OVI covering fraction (f_OVI) in TNG50 (20.62 ± 2.56%) and SIMBA (5.98 ± 0.82%) are both systematically lower than COS-IGrM (44 ± 5%). Kinematic analysis reveals that vast majority (~95%) of absorbers in both the simulations are gravitationally bound. In TNG50, strong absorbers (log N_OVI > 15) are located near star-forming galaxies (log sSFR > -11) within ~200kpc, suggesting physical connection to stellar feedback, whereas SIMBA shows no comparable trend. Furthermore, in TNG50 occurrence of OVI absorbers at small impact parameters increases with stellar mass of nearest galaxy, but shows no dependence on total stellar mass of group. In contrast, SIMBA shows no clear correlation with the
What carries the argument
The creation of 90,000 synthetic spectra per selected galaxy group to measure OVI absorber covering fractions, radial distributions, and velocities relative to the group center and nearest galaxies.
Load-bearing premise
That the selection of 14 galaxy groups from each simulation with matching halo masses and the generation of 90,000 synthetic spectra per group accurately represent the observed population without biases in resolution or feedback implementation.
What would settle it
If observations of additional galaxy groups in the same mass range reveal OVI covering fractions around 20% or less, or if simulation runs with altered resolution or feedback parameters produce covering fractions matching the observed 44%, the finding of systematic underprediction would be challenged.
Figures


read the original abstract
We compare OVI absorption in synthetic spectra from galaxy groups in the SIMBA and TNG50 cosmological hydrodynamic simulations against those observed from the COS-IGrM survey. We select 14 galaxy groups from each simulation with $12.89 \le \log(M_{\rm halo}/M_\odot) \le 13.61$, closely matching COS-IGrM, and create 90,000 synthetic spectra per group. We demonstrate the utility of synthetic absorption spectroscopy when comparing simulations with QSO absorption-based observations. We investigate absorber properties such as radial distributions and kinematics with respect to the group and nearest galaxy. The OVI covering fraction ($f_{\rm OVI}$) in TNG50 ($20.62 \pm 2.56\%$) and SIMBA ($5.98 \pm 0.82\%$) are both systematically lower than COS-IGrM ($44 \pm 5\%$). Kinematic analysis reveals that vast majority ($\sim 95\%$) of absorbers in both the simulations are gravitationally bound. In TNG50, strong absorbers ($\log N_{\rm OVI} > 15$) are located near star-forming galaxies ($\log {\rm sSFR} > -11$) within $\sim 200$kpc, suggesting physical connection to stellar feedback, whereas SIMBA shows no comparable trend. Furthermore, in TNG50 occurrence of OVI absorbers at small impact parameters increases with stellar mass of nearest galaxy, but shows no dependence on total stellar mass of group. In contrast, SIMBA shows no clear correlation with nearest galaxy's stellar mass, though groups with higher total stellar mass exhibit higher detection rate at larger impact parameters. Differences observed in simulations may arise from feedback models and resolution effects. Finally, we show absorber analysis methodology is important factor when comparing simulations with absorption spectroscopy observations.
Editorial analysis
A structured set of objections, weighed in public.
Referee Report
Summary. The manuscript compares synthetic OVI absorption in galaxy groups from the SIMBA and TNG50 simulations to COS-IGrM observations. Fourteen groups are selected from each simulation in the halo mass range 12.89 ≤ log(M_halo/M_⊙) ≤ 13.61; 90,000 synthetic spectra are generated per group. The OVI covering fractions are reported as 20.62 ± 2.56% (TNG50) and 5.98 ± 0.82% (SIMBA), both lower than the observed 44 ± 5%. Additional analysis covers radial distributions, kinematics (∼95% of absorbers gravitationally bound), and correlations with nearest-galaxy stellar mass and star-formation rate, with differences attributed to feedback models and resolution.
Significance. If the comparison holds after addressing uncertainty quantification, the work demonstrates the utility of synthetic spectroscopy for direct simulation–observation tests and identifies deficiencies in current feedback prescriptions for producing OVI in group-scale IGrM. The side-by-side SIMBA–TNG50 comparison and the kinematic result that most absorbers are bound are useful for guiding future simulation improvements.
major comments (2)
- [§4] §4 (results on covering fractions): The quoted uncertainties on the mean OVI covering fractions (20.62 ± 2.56% for TNG50, 5.98 ± 0.82% for SIMBA) are derived from the 90,000 sightlines per group. With only 14 groups, these errors do not incorporate inter-group variance. The proper uncertainty on the reported means is the standard error of the mean across the 14 per-group f_OVI values (σ/√14). If the group-to-group scatter is comparable to or larger than the quoted errors, the claimed systematic offset from the COS-IGrM value of 44 ± 5% is not robustly supported. This is load-bearing for the central claim.
- [§2] §2 (methods): The generation of the 90,000 synthetic spectra per group, including ionization modeling, velocity structure, and any resolution-dependent systematics, is not described in sufficient detail to allow assessment of potential biases in the f_OVI comparison. This directly affects the reliability of the quantitative results.
minor comments (2)
- [Abstract] Abstract: The quantitative results are clearly stated, but a one-sentence summary of the synthetic-spectrum generation procedure would improve accessibility.
- [§5] The discussion of differences between SIMBA and TNG50 feedback implementations could be strengthened by explicit reference to the specific sub-grid parameters that differ between the two runs.
Simulated Author's Rebuttal
We thank the referee for their careful reading of the manuscript and for the constructive major comments. These have prompted us to strengthen the uncertainty analysis and expand the methodological description. We respond to each point below and have revised the manuscript accordingly.
read point-by-point responses
-
Referee: [§4] §4 (results on covering fractions): The quoted uncertainties on the mean OVI covering fractions (20.62 ± 2.56% for TNG50, 5.98 ± 0.82% for SIMBA) are derived from the 90,000 sightlines per group. With only 14 groups, these errors do not incorporate inter-group variance. The proper uncertainty on the reported means is the standard error of the mean across the 14 per-group f_OVI values (σ/√14). If the group-to-group scatter is comparable to or larger than the quoted errors, the claimed systematic offset from the COS-IGrM value of 44 ± 5% is not robustly supported. This is load-bearing for the central claim.
Authors: We agree that the reported uncertainties must incorporate inter-group variance to properly assess the robustness of the offset from the COS-IGrM value. The original uncertainties were computed from the large sightline samples within each group. In the revised manuscript we have extracted the OVI covering fraction for each of the 14 groups separately, computed the standard deviation across these 14 values, and reported the standard error of the mean (σ/√14) for both simulations. We also include the measured group-to-group scatter and explicitly discuss whether the systematic offset relative to the observed 44 ± 5% remains statistically significant under the revised uncertainties. This change directly addresses the load-bearing concern for the central claim. revision: yes
-
Referee: [§2] §2 (methods): The generation of the 90,000 synthetic spectra per group, including ionization modeling, velocity structure, and any resolution-dependent systematics, is not described in sufficient detail to allow assessment of potential biases in the f_OVI comparison. This directly affects the reliability of the quantitative results.
Authors: We appreciate the referee’s request for greater methodological transparency. The original manuscript provided only a concise description of the synthetic spectra. In the revised version we have substantially expanded Section 2 to include: (i) the ionization modeling procedure (post-processing of the simulation density, temperature, and metallicity fields under collisional ionization equilibrium), (ii) how the line-of-sight velocity structure is extracted from the particle data to construct the absorption profiles, (iii) the precise algorithm for placing the 90,000 sightlines per group (including the impact-parameter sampling strategy), and (iv) an explicit discussion of resolution-dependent systematics, including comparisons with higher-resolution sub-volumes and the impact on OVI column densities. These additions allow a full evaluation of possible biases in the reported f_OVI values. revision: yes
Circularity Check
No circularity: direct simulation-to-observation comparison
full rationale
The paper selects 14 groups per simulation with halo masses matched to COS-IGrM, generates 90,000 synthetic sightlines per group using standard radiative transfer, and computes f_OVI directly from the resulting absorption statistics. No parameters are fitted to the target observations and then re-predicted; no equations reduce to their own inputs by construction; no load-bearing self-citations or uniqueness theorems are invoked. The central result (lower simulated f_OVI) is an output of the simulation runs themselves, not a re-expression of fitted inputs. Uncertainties are reported from the sightline ensemble, and any underestimation of group-to-group variance is a statistical limitation rather than a circular derivation.
Axiom & Free-Parameter Ledger
Reference graph
Works this paper leans on
-
[1]
Aguerri, J. A. L., & Zarattini, S. 2021, Universe, 7, 132
2021
-
[2]
Ragagnin, A. 2023, A&A, 675, A188, doi: 10.1051/0004-6361/202245782 Angl´ es-Alc´ azar, D., Dav´ e, R., Faucher-Gigu` ere, C.-A.,¨Ozel, F., & Hopkins, P. F. 2017, Monthly Notices of the Royal Astronomical Society, 464, 2840
-
[3]
2023, Monthly Notices of the Royal Astronomical Society, 524, 5391
Ayromlou, M., Nelson, D., & Pillepich, A. 2023, Monthly Notices of the Royal Astronomical Society, 524, 5391
2023
-
[4]
Bordoloi, R., Wagner, A. Y., Heckman, T. M., & Norman, C. A. 2017, ApJ, 848, 122, doi: 10.3847/1538-4357/aa8e9c
-
[5]
Bregman, J. N. 2007, Annu. Rev. Astron. Astrophys., 45, 221
2007
-
[6]
2024, MNRAS, 534, 1247, doi: 10.1093/mnras/stae2115
Cui, W., Jennings, F., Dave, R., Babul, A., & Gozaliasl, G. 2024, MNRAS, 534, 1247, doi: 10.1093/mnras/stae2115
-
[7]
Danforth, C. W., & Shull, J. M. 2008, ApJ, 679, 194, doi: 10.1086/587127
-
[8]
J., Crain, R
Davies, J. J., Crain, R. A., McCarthy, I. G., et al. 2019, Monthly Notices of the Royal Astronomical Society, 485, 3783
2019
-
[9]
Davies, J. J., Crain, R. A., Oppenheimer, B. D., & Schaye, J. 2020, MNRAS, 491, 4462, doi: 10.1093/mnras/stz3201
-
[10]
Davis, M., Efstathiou, G., Frenk, C. S., & White, S. D. M. 1985, ApJ, 292, 371, doi: 10.1086/163168 Dav´ e, R., Angl´ es-Alc´ azar, D., Narayanan, D., et al. 2019, Monthly Notices of the Royal Astronomical Society, 486, 2827, doi: 10.1093/mnras/stz937
-
[11]
doi:10.1111/j.1365-2966.2009.15598.x , archivePrefix =
Dolag, K., Borgani, S., Murante, G., & Springel, V. 2009, MNRAS, 399, 497, doi: 10.1111/j.1365-2966.2009.15034.x
-
[12]
Eckert, D., Gaspari, M., Gastaldello, F., Le Brun, A. M. C., & O’Sullivan, E. 2021, Universe, 7, 142, doi: 10.3390/universe7050142
-
[13]
Eke, V. R., Baugh, C. M., Cole, S., et al. 2004, MNRAS, 348, 866, doi: 10.1111/j.1365-2966.2004.07408.x 19 Faucher-Gigu` ere, C.-A., Lidz, A., Zaldarriaga, M., &
-
[14]
Hernquist, L. 2009, ApJ, 703, 1416, doi: 10.1088/0004-637X/703/2/1416
-
[15]
Ferland, G. J., Porter, R. L., van Hoof, P. A. M., et al. 2013, The 2013 Release of Cloudy. https://arxiv.org/abs/1302.4485
-
[16]
Ford, A. B., Werk, J. K., Dav´ e, R., et al. 2016, MNRAS, 459, 1745, doi: 10.1093/mnras/stw595
-
[17]
Fukugita, M., & Peebles, P. J. E. 2006, The Astrophysical Journal, 639, 590, doi: 10.1086/499556
-
[18]
2021, Universe, 7, 208
Gastaldello, F., Simionescu, A., Mernier, F., et al. 2021, Universe, 7, 208
2021
-
[19]
2007, ApJS, 168, 213, doi: 10.1086/509786 G´ omez, P
Gnat, O., & Sternberg, A. 2007, ApJS, 168, 213, doi: 10.1086/509786 G´ omez, P. L., Nichol, R. C., Miller, C. J., et al. 2003, ApJ, 584, 210, doi: 10.1086/345593
-
[20]
Green, J. C., Froning, C. S., Osterman, S., et al. 2012, ApJ, 744, 60, doi: 10.1088/0004-637X/744/1/6010.1086/141956
-
[21]
Dutton, A. A. 2017, Monthly Notices of the Royal Astronomical Society, 464, 2796
2017
-
[22]
Helsdon, S. F., & Ponman, T. J. 2000, MNRAS, 315, 356, doi: 10.1046/j.1365-8711.2000.03396.x
-
[23]
2022, in Handbook of X-ray and Gamma-ray Astrophysics (Springer), 1–66
Hlavacek-Larrondo, J., Li, Y., & Churazov, E. 2022, in Handbook of X-ray and Gamma-ray Astrophysics (Springer), 1–66
2022
-
[24]
Hopkins, P. F. 2015, MNRAS, 450, 53, doi: 10.1093/mnras/stv195
-
[25]
Hu, C.-Y., Smith, M. C., Teyssier, R., et al. 2023, ApJ, 950, 132, doi: 10.3847/1538-4357/accf9e
-
[26]
B., Bryan, G
Hummels, C. B., Bryan, G. L., Smith, B. D., & Turk, M. J. 2013, Monthly Notices of the Royal Astronomical Society, 430, 1548
2013
-
[27]
B., Smith, B
Hummels, C. B., Smith, B. D., Hopkins, P. F., et al. 2019, The Astrophysical Journal, 882, 156
2019
-
[28]
D., Chen, H.-W., & Mulchaey, J
Johnson, S. D., Chen, H.-W., & Mulchaey, J. S. 2015, Monthly Notices of the Royal Astronomical Society, 449, 3263–3273, doi: 10.1093/mnras/stv553
-
[29]
2005, The Astrophysical Journal, 620, 21, doi: 10.1086/426931
Kang, H., Ryu, D., Cen, R., & Song, D. 2005, The Astrophysical Journal, 620, 21, doi: 10.1086/426931
-
[30]
F., Walther, M., & Davies, F
Khaire, V., Hu, T., Hennawi, J. F., Walther, M., & Davies, F. 2024, Monthly Notices of the Royal Astronomical Society, 527, 4545
2024
-
[31]
Lewis, I., Balogh, M., De Propris, R., et al. 2002, MNRAS, 334, 673, doi: 10.1046/j.1365-8711.2002.05558.x
-
[32]
J., Kravtsov, A
Liang, C. J., Kravtsov, A. V., & Agertz, O. 2016, Monthly Notices of the Royal Astronomical Society, 458, 1164
2016
-
[33]
2024, MNRAS, 528, 3844, doi: 10.1093/mnras/stae278
Mallik, S., & Srianand, R. 2024, MNRAS, 528, 3844, doi: 10.1093/mnras/stae278
-
[34]
2023, MNRAS, 523, 2296, doi: 10.1093/mnras/stad1550
Khandai, N. 2023, MNRAS, 523, 2296, doi: 10.1093/mnras/stad1550
-
[35]
2018, Monthly Notices of the Royal Astronomical Society, 480, 5113
Marinacci, F., Vogelsberger, M., Pakmor, R., et al. 2018, Monthly Notices of the Royal Astronomical Society, 480, 5113
2018
-
[36]
W., Kacprzak, G
Marra, R., Churchill, C. W., Kacprzak, G. G., et al. 2021, The Astrophysical Journal, 907, 8
2021
-
[37]
2021, Astrophysical Journal, 923, doi: 10.3847/1538-4357/ac283c
McCabe, T., Borthakur, S., Heckman, T., et al. 2021, Astrophysical Journal, 923, doi: 10.3847/1538-4357/ac283c
-
[38]
G., Schaye, J., Ponman, T
McCarthy, I. G., Schaye, J., Ponman, T. J., et al. 2010, Monthly Notices of the Royal Astronomical Society, 406, 822
2010
-
[39]
2019, The Astrophysical Journal, 885, 63
McDonald, M., McNamara, B., Voit, G., et al. 2019, The Astrophysical Journal, 885, 63
2019
-
[40]
McQuinn, M., & Werk, J. K. 2018, The Astrophysical Journal, 852, 33, doi: 10.3847/1538-4357/aa9d3f
-
[41]
The overdensity and masses of the friends-of-friends halos and universality of halo mass function,
More, S., Kravtsov, A. V., Dalal, N., & Gottl¨ ober, S. 2011, ApJS, 195, 4, doi: 10.1088/0067-0049/195/1/4
-
[42]
Mulchaey, J. S. 2000, ARA&A, 38, 289, doi: 10.1146/annurev.astro.38.1.289
-
[43]
Mulchaey, J. S., Mushotzky, R. F., Burstein, D., & Davis, D. S. 1996, ApJL, 456, L5, doi: 10.1086/309861
-
[44]
P., Pillepich, A., Springel, V., et al
Naiman, J. P., Pillepich, A., Springel, V., et al. 2018, Monthly Notices of the Royal Astronomical Society, 477, 1206
2018
-
[45]
Narayanan, A., Savage, B. D., Mishra, P. K., et al. 2018, MNRAS, 475, 3529, doi: 10.1093/mnras/sty042
-
[46]
First results from the IllustrisTNG simulations: the galaxy color bimodality
Nelson, D., Pillepich, A., Springel, V., et al. 2017, Monthly Notices of the Royal Astronomical Society, 475, 624, doi: 10.1093/mnras/stx3040
work page internal anchor Pith review doi:10.1093/mnras/stx3040 2017
-
[47]
2018, Monthly Notices of the Royal Astronomical Society, 477, 450–479, doi: 10.1093/mnras/sty656
Nelson, D., Kauffmann, G., Pillepich, A., et al. 2018a, Monthly Notices of the Royal Astronomical Society, 477, 450–479, doi: 10.1093/mnras/sty656
-
[48]
Nelson, D., Pillepich, A., Springel, V., et al. 2019, MNRAS, 490, 3234, doi: 10.1093/mnras/stz2306
-
[49]
2025, The Synthetic Absorption Line Spectral Almanac (SALSA)
Nelson, D., Peroux, C., Richter, P., et al. 2025, The Synthetic Absorption Line Spectral Almanac (SALSA). https://arxiv.org/abs/2510.19904
-
[50]
McCarthy, I. G. 2021, Universe, 7, 209, doi: 10.3390/universe7070209
-
[51]
doi:10.1111/j.1365-2966.2009.15598.x , archivePrefix =
Oppenheimer, B. D., & Dav´ e, R. 2009, Monthly Notices of the Royal Astronomical Society, 395, 1875–1904, doi: 10.1111/j.1365-2966.2009.14676.x 20
-
[52]
, archivePrefix = "arXiv", eprint =
Oppenheimer, B. D., Dav´ e, R., Katz, N., Kollmeier, J. A., & Weinberg, D. H. 2011, Monthly Notices of the Royal Astronomical Society, 420, 829–859, doi: 10.1111/j.1365-2966.2011.20096.x
-
[53]
Oppenheimer, B. D., & Schaye, J. 2013, MNRAS, 434, 1043, doi: 10.1093/mnras/stt1043
-
[54]
Oppenheimer, B. D., Crain, R. A., Schaye, J., et al. 2016, MNRAS, 460, 2157, doi: 10.1093/mnras/stw1066
-
[55]
2016, Monthly Notices of the Royal Astronomical Society, 458, 733, doi: 10.1093/mnras/stw194
Pachat, S., Narayanan, A., Muzahid, S., et al. 2016, Monthly Notices of the Royal Astronomical Society, 458, 733, doi: 10.1093/mnras/stw194
-
[56]
S., Corlies, L., Tumlinson, J., et al
Peeples, M. S., Corlies, L., Tumlinson, J., et al. 2019, The Astrophysical Journal, 873, 129
2019
-
[57]
2018a, MNRAS, 475, 648, doi: 10.1093/mnras/stx3112
Pillepich, A., Nelson, D., Hernquist, L., et al. 2017, Monthly Notices of the Royal Astronomical Society, 475, 648, doi: 10.1093/mnras/stx3112 —. 2018, Monthly Notices of the Royal Astronomical Society, 475, 648
-
[58]
2019, MNRAS, 490, 3196, doi: 10.1093/mnras/stz2338
Pillepich, A., Nelson, D., Springel, V., et al. 2019, MNRAS, 490, 3196, doi: 10.1093/mnras/stz2338
-
[59]
Pointon, S. K., Nielsen, N. M., Kacprzak, G. G., et al. 2017, The Astrophysical Journal, 844, 23, doi: 10.3847/1538-4357/aa7743
-
[60]
Pratt, C. T., & Bregman, J. N. 2020, The Astrophysical Journal, 890, 156, doi: 10.3847/1538-4357/ab6e6c
-
[61]
2011, ApJ, 740, 91, doi: 10.1088/0004-637X/740/2/91
Cooksey, K. 2011, ApJ, 740, 91, doi: 10.1088/0004-637X/740/2/91
-
[62]
Ramella, M., Geller, M. J., Pisani, A., & da Costa, L. N. 2002, AJ, 123, 2976, doi: 10.1086/340357
-
[63]
1998, Annual Review of Astronomy and Astrophysics, 36, 267–316, doi: 10.1146/annurev.astro.36.1.267
Rauch, M. 1998, Annual Review of Astronomy and Astrophysics, 36, 267–316, doi: 10.1146/annurev.astro.36.1.267 Roca-F` abrega, S., Dekel, A., Faerman, Y., et al. 2019, Monthly Notices of the Royal Astronomical Society, 484, 3625 R¨ ottgers, B., Naab, T., Cernetic, M., et al. 2020, MNRAS, 496, 152, doi: 10.1093/mnras/staa1490
-
[64]
Savage, B. D., Kim, T.-S., Wakker, B. P., et al. 2014, The Astrophysical Journal Supplement Series, 212, 8, doi: 10.1088/0067-0049/212/1/8
-
[65]
Savage, B. D., Narayanan, A., Wakker, B. P., et al. 2010, The Astrophysical Journal, 719, 1526–1545, doi: 10.1088/0004-637x/719/2/1526
-
[66]
Shull, J. M., Smith, B. D., & Danforth, C. W. 2012, ApJ, 759, 23, doi: 10.1088/0004-637X/759/1/23
-
[67]
Smith, B. D., Hallman, E. J., Shull, J. M., & O’Shea, B. W. 2011, ApJ, 731, 6, doi: 10.1088/0004-637X/731/1/6
-
[68]
2024, The Open Journal of Astrophysics, 7, 115, doi: 10.33232/001c.126621
Sorini, D., Bose, S., Dav´ e, R., & Angl´ es-Alc´ azar, D. 2024, The Open Journal of Astrophysics, 7, 115, doi: 10.33232/001c.126621
-
[69]
N., Bean, R., Dor´ e, O., et al
Spergel, D. N., Bean, R., Dor´ e, O., et al. 2007, ApJS, 170, 377, doi: 10.1086/513700
-
[70]
doi:10.1111/j.1365-2966.2009.15598.x , archivePrefix =
Springel, V. 2010, MNRAS, 401, 791, doi: 10.1111/j.1365-2966.2009.15715.x
-
[71]
Springel, V., White, S. D. M., Tormen, G., & Kauffmann, G. 2001, MNRAS, 328, 726, doi: 10.1046/j.1365-8711.2001.04912.x
-
[72]
2018, Monthly Notices of the Royal Astronomical Society, 475, 676
Springel, V., Pakmor, R., Pillepich, A., et al. 2018, Monthly Notices of the Royal Astronomical Society, 475, 676
2018
-
[73]
Stern, J., Faucher-Gigu` ere, C.-A., Hennawi, J. F., et al. 2018, ApJ, 865, 91, doi: 10.3847/1538-4357/aac884
-
[74]
Stocke, J. T., Keeney, B. A., Danforth, C. W., et al. 2017, ApJ, 838, 37, doi: 10.3847/1538-4357/aa64e2 —. 2019, ApJS, 240, 15, doi: 10.3847/1538-4365/aaf73d —. 2014, ApJ, 791, 128, doi: 10.1088/0004-637X/791/2/128
-
[75]
2021, MNRAS, 501, 4948, doi: 10.1093/mnras/staa3972
Strawn, C., Roca-F` abrega, S., Mandelker, N., et al. 2021, MNRAS, 501, 4948, doi: 10.1093/mnras/staa3972
-
[76]
Strawn, C., Roca-F` abrega, S., Primack, J. R., et al. 2024, ApJ, 962, 29, doi: 10.3847/1538-4357/ad12cb
-
[77]
Suresh, J., Rubin, K. H. R., Kannan, R., et al. 2017, MNRAS, 465, 2966, doi: 10.1093/mnras/stw2499
-
[78]
2008, A&A, 479, 927, doi: 10.1051/0004-6361:20078036
Tago, E., Einasto, J., Saar, E., et al. 2008, A&A, 479, 927, doi: 10.1051/0004-6361:20078036
-
[79]
Taira, E., Kopenhafer, C., O’Shea, B. W., et al. 2025, ApJ, 991, 221, doi: 10.3847/1538-4357/adfc4e Tepper-Garc´ ıa, T., Richter, P., Schaye, J., et al. 2012, MNRAS, 425, 1640, doi: 10.1111/j.1365-2966.2012.21545.x
-
[80]
A., Bell, E
Terrazas, B. A., Bell, E. F., Pillepich, A., et al. 2020, Monthly Notices of the Royal Astronomical Society, 493, 1888
2020
discussion (0)
Sign in with ORCID, Apple, or X to comment. Anyone can read and Pith papers without signing in.