Recognition: unknown
Early Prediction of Student Performance Using Bayesian Updating with Informative Priors Across Cohorts
Pith reviewed 2026-05-10 01:30 UTC · model grok-4.3
The pith
Bayesian updating with informative priors from a previous cohort improves early prediction of student performance in a new cohort.
A machine-rendered reading of the paper's core claim, the machinery that carries it, and where it could break.
Core claim
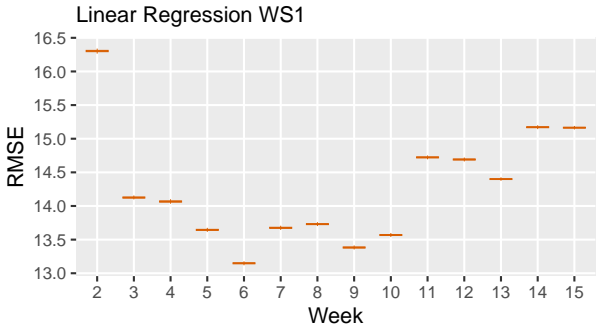
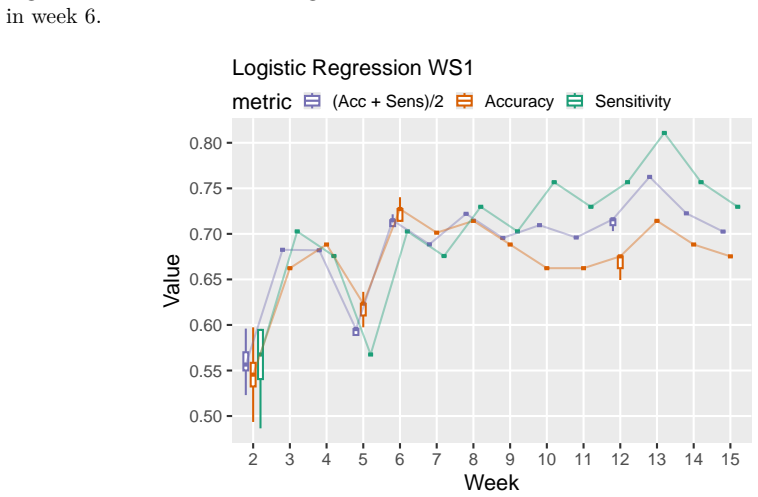
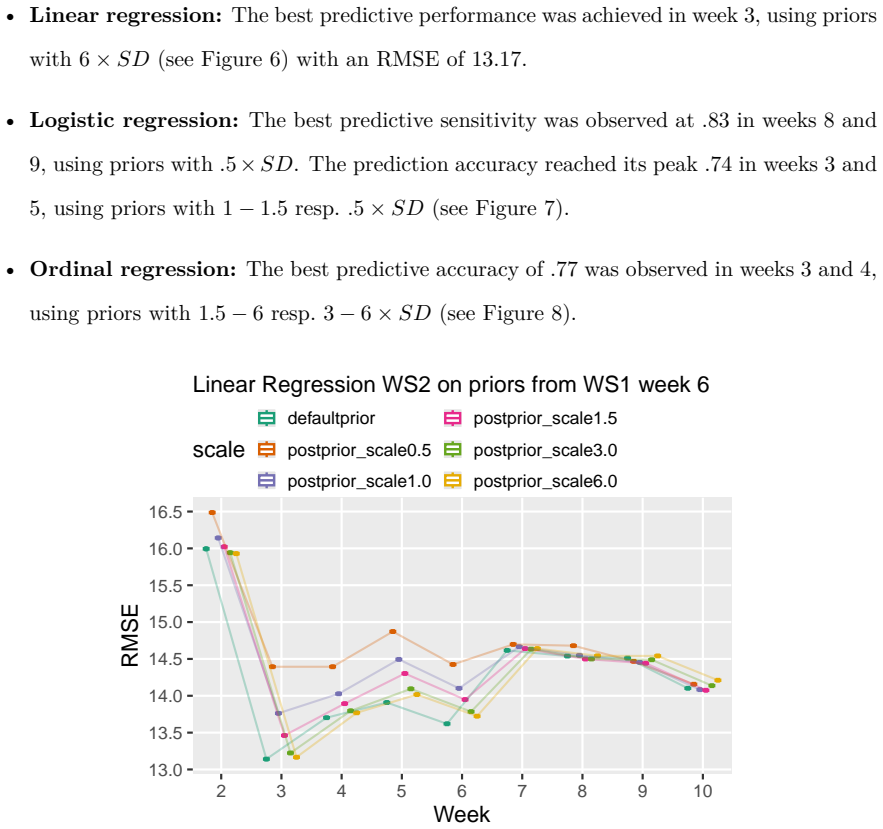
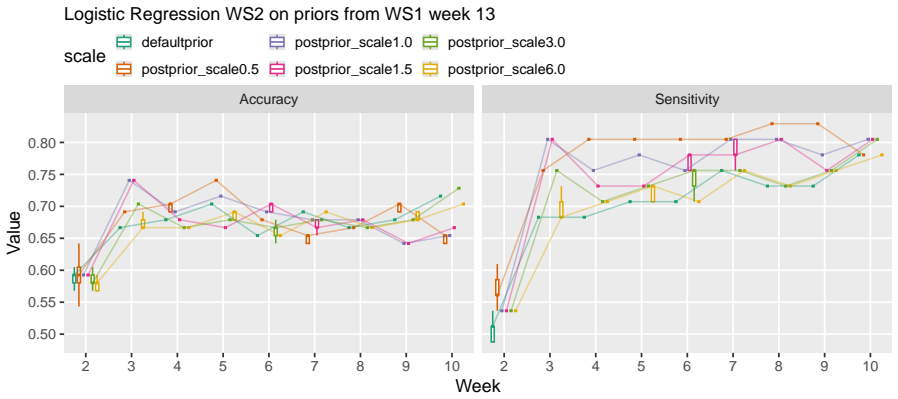
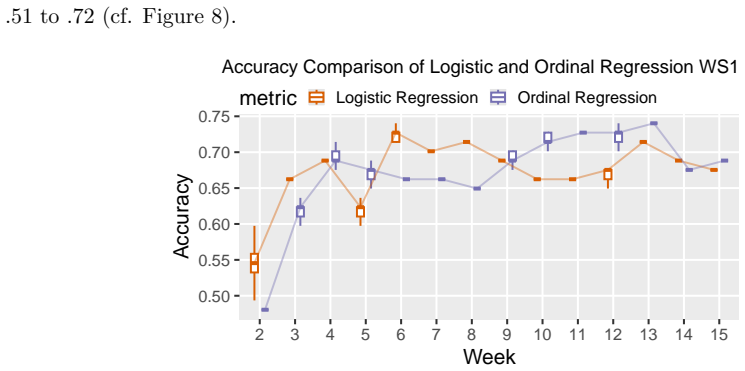
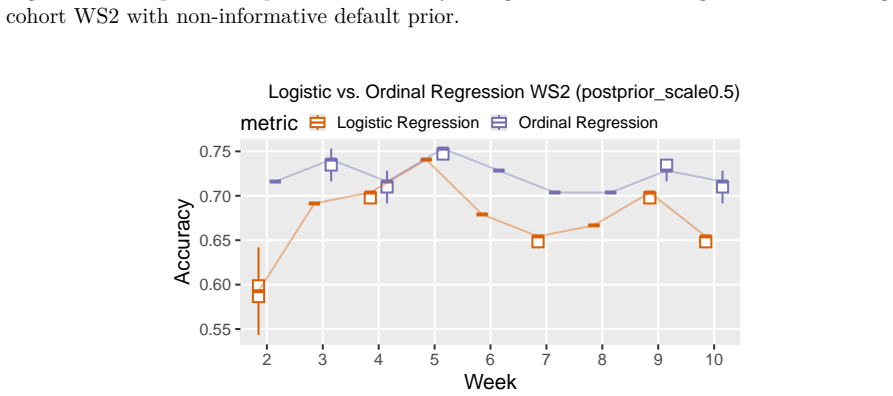
Fitting weekly Bayesian linear, logistic, and ordinal regression models to six SRL-aligned engagement indicators from two consecutive cohorts (N1=307, N2=323), using informative priors taken from the posterior of the source cohort, improves prediction of exam points, final grades, and binary at-risk status in the target cohort. Logistic models with priors reduce misclassification by 22% and false negatives by 38% in week 3; ordinal models reduce misclassification by 42% in week 2 and reach accuracy 0.77 by week 4, outperforming uninformative-prior models when current data remain limited.
What carries the argument
Bayesian updating with informative priors derived from the posterior distributions of a preceding cohort, applied to weekly digital trace data on self-regulated learning engagement indicators.
If this is right
- Logistic and ordinal models show the largest accuracy gains in the earliest weeks when current-cohort data are scarcest.
- Linear models gain little from the informative priors.
- In the source cohort, performance already becomes substantial by week 6 without needing prior information.
- The method yields robust cross-cohort prediction without requiring large amounts of new data in the first weeks.
Where Pith is reading between the lines
- The procedure could be tested on non-mathematics courses to determine how much cohort similarity is required for the gains to persist.
- Institutions could maintain a rolling informative prior drawn from the most recent completed term to accelerate early-warning systems each semester.
- Adding demographic or prior-grade variables to the engagement indicators might further stabilize the early-week predictions, though the paper restricts attention to digital trace data alone.
Load-bearing premise
The two consecutive cohorts must be similar enough in learning behaviors, course structure, and engagement patterns for the previous cohort's posterior to serve as useful informative priors for the new one.
What would settle it
Applying the same informative-prior models to a subsequent cohort whose course design or student engagement patterns differ substantially from the source cohort and checking whether the reported reductions in early misclassification disappear or reverse relative to uninformative priors.
Figures


read the original abstract
Early identification of at risk students in higher education depends on predictive models that maintain accuracy across successive cohorts -- a requirement that single-cohort modeling approaches fail to meet. This study evaluates Bayesian updating with informative priors from a previous cohort to improve cross-cohort prediction robustness using digital trace data. We fit weekly Bayesian linear, logistic, and ordinal regression models with either uninformative default priors or informative priors derived from posterior distributions of a preceding cohort. Models were applied to six weekly self-regulated learning (SRL)-aligned engagement indicators from two consecutive cohorts of students in a blended first-year mathematics course (N1 = 307; N2 = 323). Outcomes were exam points, final grades, and a binary at risk indicator. The models were evaluated weekly based on accuracy, sensitivity, and RMSE. In the source cohort, performance was already substantial by week 6. In the target cohort, informative priors improved early classification: Logistic models with priors reduced misclassification by 22% and false negatives by 38% in week 3 relative to the uninformative default. Ordinal models with priors similarly showed the strongest improvements in early weeks, reducing misclassification by 42% in week 2 and reaching an accuracy of .77 by week 4. Linear models showed little benefit from prior information. These findings demonstrate that Bayesian updating is a viable method for improving early classification performance across cohorts, with gains concentrated in the early weeks of the semester when current-cohort data are scarce.
Editorial analysis
A structured set of objections, weighed in public.
Referee Report
Summary. The manuscript evaluates Bayesian updating with informative priors derived from the posterior of one cohort applied to a subsequent cohort for early prediction of student exam performance, final grades, and at-risk status. Using weekly digital-trace SRL engagement indicators from two consecutive cohorts (N=307 and N=323) in a blended first-year mathematics course, it compares linear, logistic, and ordinal regression models with default versus informative priors, reporting concrete early-week gains such as 22% lower misclassification and 38% fewer false negatives for logistic models in week 3 and 42% lower misclassification for ordinal models in week 2.
Significance. If the central assumption holds, the work supplies a practical, replicable demonstration that Bayesian prior transfer can mitigate data scarcity in the first few weeks of a course, yielding measurable improvements in classification metrics precisely when current-cohort data are limited. The use of real consecutive cohorts and multiple outcome types (continuous, binary, ordinal) strengthens the applied relevance for educational data mining.
major comments (2)
- [§2 and §3] §2 (Data and Cohorts) and §3 (Prior Construction): the load-bearing claim that posteriors from cohort 1 constitute valid informative priors for cohort 2 requires exchangeability of the six SRL predictors, course structure, and student behaviors across years. No quantitative check—mean/variance comparisons, Kolmogorov-Smirnov tests, or effect-size summaries on the engagement indicators—is reported, so the observed early-week gains cannot be unambiguously attributed to the Bayesian mechanism rather than idiosyncratic cohort differences.
- [§4] §4 (Results, week-2/3 tables): the reported percentage reductions (22% misclassification, 38% false negatives, 42% misclassification) are presented without accompanying standard errors, confidence intervals, or permutation tests that would establish whether the differences exceed what would be expected from sampling variability alone under the uninformative-prior baseline.
minor comments (2)
- [§2] The six SRL-aligned engagement indicators are referenced repeatedly but never enumerated with precise operational definitions or variable names; adding an explicit list or table in §2 would improve reproducibility.
- [Figures] Figure captions and axis labels in the weekly performance plots should state the exact metric (accuracy, sensitivity, RMSE) and the number of students remaining in the analysis each week.
Simulated Author's Rebuttal
We thank the referee for the constructive comments and the positive evaluation of the significance of our work. We address the two major comments point by point below, indicating the revisions we plan to incorporate.
read point-by-point responses
-
Referee: [§2 and §3] §2 (Data and Cohorts) and §3 (Prior Construction): the load-bearing claim that posteriors from cohort 1 constitute valid informative priors for cohort 2 requires exchangeability of the six SRL predictors, course structure, and student behaviors across years. No quantitative check—mean/variance comparisons, Kolmogorov-Smirnov tests, or effect-size summaries on the engagement indicators—is reported, so the observed early-week gains cannot be unambiguously attributed to the Bayesian mechanism rather than idiosyncratic cohort differences.
Authors: We agree that the absence of explicit quantitative checks for exchangeability leaves open the possibility that cohort-specific differences contribute to the observed gains. The study design relies on the fact that both cohorts participated in the identical blended first-year mathematics course with the same instructors, materials, and assessment scheme in consecutive years. This setup provides a reasonable foundation for the exchangeability assumption regarding the SRL predictors and student behaviors. To strengthen the manuscript and directly address the referee's concern, we will revise §2 to include mean and variance comparisons, Kolmogorov-Smirnov tests, and effect-size summaries (Cohen's d) for each of the six engagement indicators across the two cohorts. These additions will be presented in a new table or subsection, enabling readers to judge the degree of similarity independently. revision: yes
-
Referee: [§4] §4 (Results, week-2/3 tables): the reported percentage reductions (22% misclassification, 38% false negatives, 42% misclassification) are presented without accompanying standard errors, confidence intervals, or permutation tests that would establish whether the differences exceed what would be expected from sampling variability alone under the uninformative-prior baseline.
Authors: We acknowledge that the reported percentage reductions are point estimates and that formal assessment of their statistical significance relative to sampling variability would improve the presentation. The differences arise from comparing model performance metrics on the target cohort under the two prior specifications. In the revised version of §4, we will supplement the tables with bootstrap confidence intervals (using 1,000 resamples) for the misclassification, false negative, and accuracy rates. We will also add the results of permutation tests that shuffle the prior type within each week to generate a null distribution for the metric differences. This will allow us to report whether the observed improvements are larger than what would be expected by chance under the uninformative baseline. revision: yes
Circularity Check
No circularity: empirical cross-cohort evaluation of standard Bayesian updating
full rationale
The paper fits weekly regression models on digital trace data from two consecutive cohorts (N1=307, N2=323) and directly compares uninformative vs. informative priors derived from the source cohort's posterior. Performance metrics (accuracy, sensitivity, RMSE, misclassification rates) are computed on the target cohort's outcomes. No equations reduce a claimed prediction to a fitted quantity by construction, no self-citations are load-bearing for the central claim, and the cohort-similarity assumption is tested only by the observed empirical gains rather than assumed via definition. The derivation chain is therefore self-contained against external data benchmarks.
Axiom & Free-Parameter Ledger
free parameters (1)
- Informative prior hyperparameters
axioms (1)
- domain assumption The six weekly SRL-aligned engagement indicators are consistent and comparable across the two consecutive cohorts.
Reference graph
Works this paper leans on
-
[1]
A., and Gates, K
Greene, J. A., and Gates, K. M. (2022). Predicting student outcomes using digital logs of learning behaviors: Review, current standards, and suggestions for future work.Behavior Research Methods, 55(6):3026–3054. 25
2022
-
[2]
and Aslanian, S
Barshay, J. and Aslanian, S. (2019). Colleges are using big data to track students in an effort to boost graduation rates, but it comes at a cost
2019
-
[3]
L., Chavez, M
Bernacki, M. L., Chavez, M. M., and Uesbeck, P. M. (2020). Predicting achievement and providing support before STEM majors begin to fail.Computers & Education, 158:103999
2020
-
[4]
Hollander-Blackmon, C., and Hogan, K. A. (2025). Using multimodal learning analytics to validate digital traces of self-regulated learning in a laboratory study and predict performance in undergraduate courses.Journal of Educational Psychology, 117(2):176–205. Bürkner, P.-C. (2017). brms: An R package for Bayesian multilevel models usingStan.Journal of St...
2025
-
[5]
L., Hilpert, J
Cogliano, M., Bernacki, M. L., Hilpert, J. C., and Strong, C. L. (2022). A self-regulated learning analytics prediction-and-intervention design: Detecting and supporting struggling biology students.Journal of educational psychology, 114(8):1801–1816
2022
-
[6]
Colling, L., Deininger, H., Parrisius, C., Von Keyserlingk, L., Bodnar, S., Holz, H., Kasneci, G., Nagengast, B., Trautwein, U., and Meurers, D. (2025). How do learners practice? – theory-informed sequence analyses to investigate self-regulated learning processes and their link to achievement.Educational Psychology, pages 1–24
2025
-
[7]
Conijn, R., Snijders, C., Kleingeld, A., and Matzat, U. (2017). Predicting Student Perfor- mance from LMS Data: A Comparison of 17 Blended Courses Using Moodle LMS.IEEE Transactions on Learning Technologies, 10(1):17–29
2017
-
[8]
F., and Liu, L
Du, J., Hew, K. F., and Liu, L. (2023). What can online traces tell us about students’ self- regulated learning? A systematic review of online trace data analysis.Computers & Educa- tion, 201:104828
2023
-
[9]
B., Stern, H
Gelman, A., Carlin, J. B., Stern, H. S., Dunson, D. B., Vehtari, A., and Rubin, D. B. (2013). Bayesian Data Analysis. Chapman & Hall/CRC Texts in Statistical Science Series. CRC, Boca Raton, Florida, third edition
2013
-
[10]
G., and Su, Y.-S
Gelman, A., Jakulin, A., Pittau, M. G., and Su, Y.-S. (2008). A weakly informative default prior distribution for logistic and other regression models.The Annals of Applied Statistics. 26
2008
-
[11]
D., Gelman, A., et al
Hoffman, M. D., Gelman, A., et al. (2014). The no-u-turn sampler: adaptively setting path lengths in hamiltonian monte carlo.J. Mach. Learn. Res., 15(1):1593–1623. König, C. and Van De Schoot, R. (2018). Bayesian statistics in educational research: A look at the current state of affairs.Educational Review, 70(4):486–509
2014
-
[12]
A., Jovanovic, J., Pardo, A., Lim, L., Maldonado-Mahauad, J., Gentili, S., Pérez-Sanagustín, M., and Tsai, Y.-S
Matcha, W., Gasevic, D., Uzir, N. A., Jovanovic, J., Pardo, A., Lim, L., Maldonado-Mahauad, J., Gentili, S., Pérez-Sanagustín, M., and Tsai, Y.-S. (2020). Analytics of learning strategies: Role of course design and delivery modality.Journal of Learning Analytics, 7(2):45–71
2020
-
[13]
Pardo, A., Han, F., and Ellis, R. A. (2017). Combining University Student Self-Regulated Learning Indicators and Engagement with Online Learning Events to Predict Academic Per- formance.IEEE Transactions on Learning Technologies, 10(1):82–92
2017
-
[14]
A., Lee, C., Panter, A
Hogan, K. A., Lee, C., Panter, A. T., and Gates, K. M. (2024). Co-designing enduring learning analytics prediction and support tools in undergraduate biology courses.British Journal of Educational Technology, 55(5):1860–1883. R Core Team (2025).R: A Language and Environment for Statistical Computing. R Foundation for Statistical Computing, Vienna, Austria
2024
-
[15]
Roediger, H. L. and Karpicke, J. D. (2006). Test-Enhanced Learning: Taking Memory Tests Improves Long-Term Retention.Psychological Science, 17(3):249–255
2006
-
[16]
Schunk, D. H. and Greene, J. A., editors (2018).Handbook of Self-Regulation of Learning and Performance. Educational Psychology Handbook Series. Routledge, Taylor & Francis Group, New York London, second edition edition
2018
-
[17]
Schwerter, J., Lauermann, F., Dimpfl, T., and Bernacki, M. L. (2026). Retrieval Practice in Higher Education: Causality and Content Transfer Effects in a Gateway Math Course. Journal of Educational Psychology, in press
2026
-
[18]
Sghir, N., Adadi, A., and Lahmer, M. (2023). Recent advances in Predictive Learning Ana- lytics: A decade systematic review (2012–2022).Education and Information Technologies, 28(7):8299–8333. 27
2023
-
[19]
Xing, W., Du, D., Bakhshi, A., Chiu, K.-C., and Du, H. (2021). Designing a Transferable Pre- dictive Model for Online Learning Using a Bayesian Updating Approach.IEEE Transactions on Learning Technologies, 14(4):474–485
2021
-
[20]
F., Bernacki, M
Yu, L., Halpin, P. F., Bernacki, M. L., Ren, S., Plumley, R. D., and Greene, J. A. (2025). In- terpreting Predictive Learning Sequences in a College Math Course through a Self-Regulated Learning Framework.Journal of Learning Analytics, pages 1–21
2025
-
[21]
Zimmerman, B. J. (2002). Becoming a Self-Regulated Learner: An Overview.Theory into Practice, 41(2):64–71. 28
2002
discussion (0)
Sign in with ORCID, Apple, or X to comment. Anyone can read and Pith papers without signing in.