Recognition: no theorem link
Systemic Risk and Default Cascades in Global Equity Markets: A Network and Tail-Risk Approach Based on the Gai Kapadia Framework
Pith reviewed 2026-05-10 17:06 UTC · model grok-4.3
The pith
Global equity networks show strong resilience to default cascades, limiting failures to one or two assets on average.
A machine-rendered reading of the paper's core claim, the machinery that carries it, and where it could break.
Core claim
The extended framework shows that equity market networks exhibit strong global resilience, with negligible probability of large-scale failure, while maintaining localized vulnerability within highly clustered subnetworks. Shocks produce an average of 1.0 failed asset for single events and 2.0 for simultaneous shocks. Brazilian equities display high clustering coefficients near 0.8-1.0 that amplify local propagation, whereas developed-market assets have lower connectivity near 0.2-0.5 that restricts systemic spread. Heavy-tailed loss distributions, estimated via empirical CCDF and Hill methods, appear more pronounced in emerging markets.
What carries the argument
The Gai-Kapadia default-cascade propagation model applied to threshold-filtered correlation networks derived from equity price co-movements, combined with Monte Carlo simulations and tail-risk estimators.
If this is right
- Systemic risk in equities stems from the interaction of network topology and tail behavior rather than isolated asset features.
- Shocks remain below a critical threshold that would trigger widespread defaults.
- Monitoring high-clustering subnetworks, such as those in Brazilian assets, offers a practical target for risk oversight.
- The framework supplies a scalable method for stress testing under deterministic and stochastic shock scenarios.
Where Pith is reading between the lines
- If price-based networks capture contagion paths, then cross-market diversification that avoids dense emerging-market clusters could reduce exposure to localized failures.
- Regulators could focus surveillance resources on regions showing high clustering rather than on individual large assets.
- Testing the same model on larger global networks or on data from actual crisis periods would check whether the observed resilience holds beyond the 2015-2026 sample.
Load-bearing premise
That networks constructed from price co-movements accurately represent exposure and contagion paths in equity markets in the same way interbank lending does in the original Gai-Kapadia model.
What would settle it
A real-world equity-market shock that produces a cascade with more than a handful of failures, or out-of-sample simulations that consistently yield average failures well above two assets.
Figures


read the original abstract
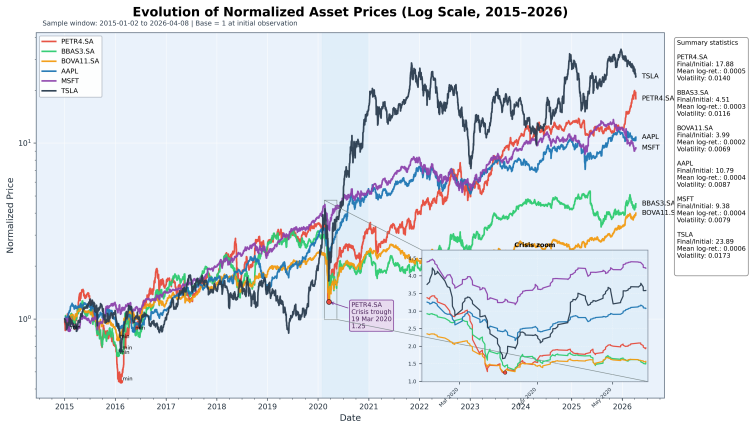
This study extends the Gai-Kapadia framework, originally developed for interbank contagion, to assess systemic risk and default cascades in global equity markets. We analyze a 30 asset network comprising Brazilian and developed market equities over the period 2015-2026, constructing exposure based financial networks from price co-movements. Threshold filtering (theta = 0.3 and theta = 0.5) is applied to isolate significant interconnections. Cascade dynamics are analyzed through a combination of deterministic propagation and stochastic Monte Carlo simulations (n = 1000) under varying shock intensities. The results show that the system exhibits strong global resilience, with a negligible probability of large scale failure, while maintaining localized vulnerability within highly clustered subnetworks. In particular, shocks lead to an average of 1.0 failed asset for single shocks and 2.0 for simultaneous shocks, indicating limited propagation below a critical threshold. Network analysis reveals a clear structural asymmetry: Brazilian assets display high clustering (Ci approx 0.8-1.0) and dense connectivity, which amplifies local shock propagation, whereas developed market assets exhibit lower connectivity (Ci approx 0.2-0.5), limiting systemic spread. Tail risk analysis, based on empirical CCDF and Hill estimators, confirms the presence of heavy tailed loss distributions, particularly in emerging markets, reinforcing their exposure to extreme events. These findings demonstrate that systemic risk arises from the interaction between network topology and tail behavior, rather than from isolated asset characteristics. The proposed framework provides a scalable and empirically grounded approach for stress testing and systemic risk assessment, offering relevant insights for regulators and portfolio managers in increasingly interconnected financial markets.
Editorial analysis
A structured set of objections, weighed in public.
Referee Report
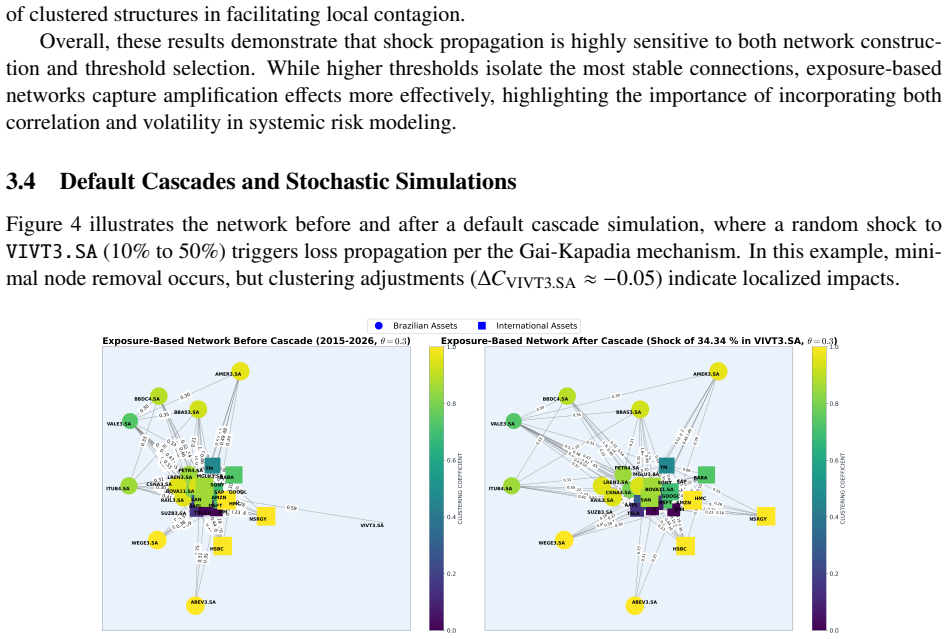
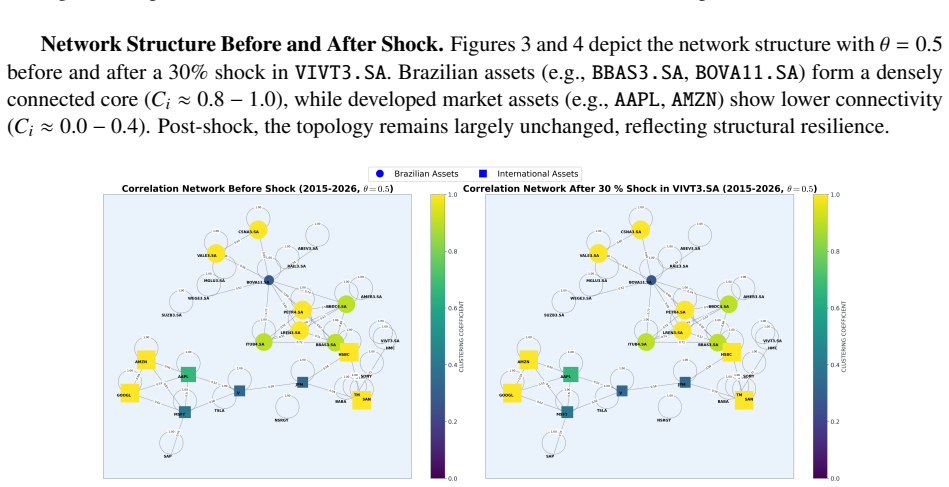
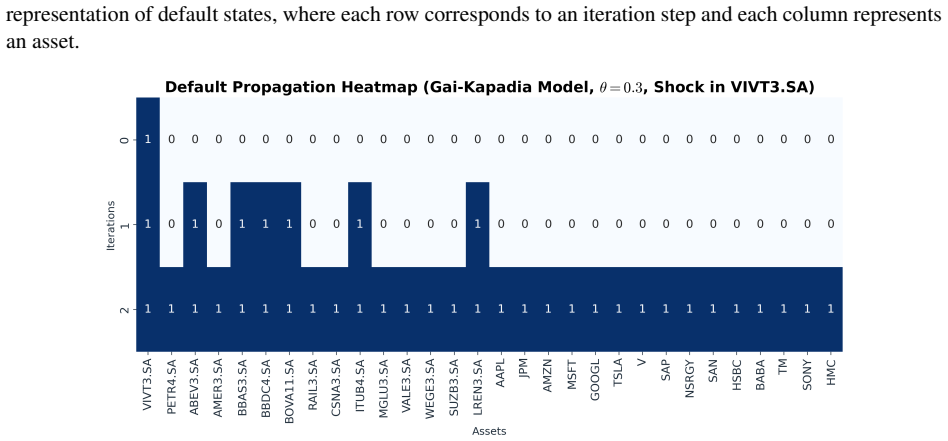
Summary. The paper extends the Gai-Kapadia interbank contagion framework to global equity markets by constructing a 30-asset network from price co-movements (Brazilian and developed-market equities, 2015-2026), applying threshold filters at 0.3 and 0.5 to define edges, and running deterministic plus Monte Carlo (n=1000) cascade simulations under single and simultaneous shocks. It reports strong global resilience (average 1.0 failed assets for single shocks, 2.0 for simultaneous shocks, negligible large-scale failure probability) alongside localized vulnerability in high-clustering Brazilian subnetworks (C_i ≈ 0.8-1.0) versus lower connectivity in developed markets (C_i ≈ 0.2-0.5), with heavy-tailed loss distributions confirmed via empirical CCDF and Hill estimators.
Significance. If the correlation-network proxy for contagion channels is valid, the work supplies a scalable, empirically grounded stress-testing framework that links network topology to tail-risk behavior in equity markets, with potential value for regulators and portfolio managers. The combination of standard Monte Carlo cascade runs and Hill tail estimators is a methodological strength.
major comments (3)
- [Abstract / Network Construction] Abstract and network-construction description: the central resilience claim (average cascade sizes of 1.0 and 2.0, negligible large-scale failure) rests on applying the Gai-Kapadia propagation rule to a thresholded correlation network, yet equity defaults do not mechanically transmit balance-sheet losses along price-co-movement edges in the manner assumed for interbank exposures; this semantic mismatch renders the simulated outcomes non-diagnostic of actual systemic risk.
- [Cascade Dynamics] Cascade-dynamics section: shock definition, exact correlation estimator, and buffer-size determination for equities are not specified, while thresholds 0.3 and 0.5 appear post-hoc; without sensitivity checks these choices directly control network density and therefore the reported limited propagation.
- [Network Analysis] Results on structural asymmetry: the contrast between Brazilian (C_i ≈ 0.8-1.0) and developed-market (C_i ≈ 0.2-0.5) clustering is presented as load-bearing for localized vulnerability, but no robustness table or alternative filtering (e.g., minimum-spanning-tree or partial correlations) is shown to confirm that the asymmetry survives changes in network-construction parameters.
minor comments (2)
- [Abstract] The data window 2015-2026 includes future dates; clarify whether this is a typo or an out-of-sample projection.
- [Network Analysis] Notation for clustering coefficient is given as “Ci approx 0.8-1.0”; adopt consistent subscript notation (C_i) and report exact values or ranges with standard errors.
Simulated Author's Rebuttal
We thank the referee for the insightful comments, which have helped us improve the clarity and robustness of our work. We provide point-by-point responses to the major comments below.
read point-by-point responses
-
Referee: [Abstract / Network Construction] Abstract and network-construction description: the central resilience claim (average cascade sizes of 1.0 and 2.0, negligible large-scale failure) rests on applying the Gai-Kapadia propagation rule to a thresholded correlation network, yet equity defaults do not mechanically transmit balance-sheet losses along price-co-movement edges in the manner assumed for interbank exposures; this semantic mismatch renders the simulated outcomes non-diagnostic of actual systemic risk.
Authors: We agree that the transmission mechanism differs fundamentally between interbank exposures and equity price co-movements. Our approach uses the Gai-Kapadia cascade rule as a stylized model to explore how shocks might propagate through a network of correlated assets, where correlations serve as a proxy for shared risk factors and potential contagion channels. This is explicitly framed as a 'network and tail-risk approach based on the Gai-Kapadia framework' rather than a direct replication of balance-sheet contagion. To address the concern, we will revise the abstract and the network construction section to emphasize the proxy nature of the correlation edges and the stress-testing interpretation of the results. We believe this clarifies the scope without overstating the direct applicability to equity default cascades. revision: yes
-
Referee: [Cascade Dynamics] Cascade-dynamics section: shock definition, exact correlation estimator, and buffer-size determination for equities are not specified, while thresholds 0.3 and 0.5 appear post-hoc; without sensitivity checks these choices directly control network density and therefore the reported limited propagation.
Authors: We acknowledge that these methodological details were insufficiently specified in the manuscript. The correlation estimator used is the standard Pearson correlation coefficient computed on daily returns over the 2015-2026 period. Shocks are defined as an initial percentage loss to an asset (e.g., 10%, 20%, etc.), and the buffer for each asset is determined as a multiple of its historical volatility (specifically, set to 1.5 times the standard deviation of returns to represent a resilience threshold). The thresholds of 0.3 and 0.5 were selected to capture moderate and strong co-movements, respectively, following common practices in financial network literature. We will add a dedicated subsection detailing these choices and include sensitivity analyses varying the thresholds (0.2, 0.4, 0.6) and buffer sizes to demonstrate that the main findings on resilience and localized vulnerability are robust. revision: yes
-
Referee: [Network Analysis] Results on structural asymmetry: the contrast between Brazilian (C_i ≈ 0.8-1.0) and developed-market (C_i ≈ 0.2-0.5) clustering is presented as load-bearing for localized vulnerability, but no robustness table or alternative filtering (e.g., minimum-spanning-tree or partial correlations) is shown to confirm that the asymmetry survives changes in network-construction parameters.
Authors: The clustering asymmetry is a key finding, and we recognize the need for robustness checks. While the primary results use threshold filtering, we will add a new subsection on robustness that includes alternative network constructions: (i) partial correlation networks to control for common factors, and (ii) minimum spanning tree representations. We will present tables showing that the higher clustering in Brazilian assets (relative to developed markets) persists across these specifications, supporting the localized vulnerability conclusion. This will strengthen the evidence for the structural asymmetry. revision: yes
Circularity Check
No significant circularity; simulation results are independent of network construction inputs
full rationale
The paper constructs a correlation network from price co-movement data using fixed thresholds (theta=0.3/0.5), then applies the external Gai-Kapadia cascade rules through deterministic and Monte Carlo simulation to obtain average failure counts. These counts are computed outputs of the model run on the network and do not reduce by definition or fitting to the correlation inputs themselves. No self-citations, ansatzes, or uniqueness claims are invoked to justify the central resilience result, and the derivation chain remains self-contained as an empirical application rather than a tautological renaming or self-referential fit.
Axiom & Free-Parameter Ledger
free parameters (2)
- theta =
0.3 and 0.5
- n_simulations =
1000
axioms (1)
- domain assumption Price co-movements can be used to construct exposure-based financial networks suitable for modeling contagion cascades
Reference graph
Works this paper leans on
-
[1]
American Economic Review 105: 564--608
Acemoglu D, Ozdaglar A, Tahbaz-Salehi A (2015) Systemic risk and stability in financial networks. American Economic Review 105: 564--608
2015
-
[2]
Journal of Political Economy 108: 1--33
Allen F, Gale D (2000) Financial contagion. Journal of Political Economy 108: 1--33
2000
-
[3]
Mathematical Finance 9: 203--228
Artzner P, Delbaen F, Eber JM, Heath D (1999) Coherent measures of risk. Mathematical Finance 9: 203--228
1999
-
[4]
Science 286: 509--512
Barabási A-L, Albert R (1999) Emergence of scaling in random networks. Science 286: 509--512
1999
-
[5]
Journal of Economic Dynamics and Control 36: 1121--1141
Battiston S, Delli Gatti D, Gallegati M, Greenwald BC, Stiglitz JE (2012) Liaisons dangereuses: Increasing connectivity, risk sharing, and systemic risk. Journal of Economic Dynamics and Control 36: 1121--1141
2012
-
[6]
Quantitative Finance 23: 789--805
Battiston S, Martinez-Jaramillo S (2023) Financial networks and systemic stability: Insights from multilayer models. Quantitative Finance 23: 789--805
2023
-
[7]
Journal of Financial Economics 104: 535--559
Billio M, Getmansky M, Lo AW, Pelizzon L (2012) Econometric measures of connectedness and systemic risk in the finance and insurance sectors. Journal of Financial Economics 104: 535--559
2012
-
[8]
arXiv preprint arXiv:2504.01969
Castillo Pereda AI (2025) Systemic risk and default cascades in global equity markets: Extending the Gai Kapadia framework with stochastic simulations and network analysis. arXiv preprint arXiv:2504.01969
-
[9]
Quantitative Finance 1: 223--236
Cont R (2001) Empirical properties of asset returns: stylized facts and statistical issues. Quantitative Finance 1: 223--236
2001
-
[10]
arXiv preprint arXiv:2309.15511
Das B, Fasen-Hartmann V (2023) Measuring risk contagion in financial networks with CoVaR. arXiv preprint arXiv:2309.15511
-
[11]
Journal of Financial Stability 68: 101123
Das S, Fasen-Hartmann V (2023) Systemic risk in financial networks: A dynamic perspective. Journal of Financial Stability 68: 101123
2023
-
[12]
Princeton University Press, Princeton
Duffie D, Singleton KJ (2003) Credit risk: Pricing, measurement, and management. Princeton University Press, Princeton
2003
-
[13]
Management Science 47: 236--249
Eisenberg L, Noe TH (2001) Systemic risk in financial systems. Management Science 47: 236--249
2001
-
[14]
Journal of Financial Stability 61: 100960
Ellis S, Sharma S, Brzeszczyński J (2022) Systemic risk measures and regulatory challenges. Journal of Financial Stability 61: 100960. doi: https://doi.org/10.1016/j.jfs.2021.100960
-
[15]
International Monetary Fund Publications, Washington, DC
International Monetary Fund (2025) Regional Economic Outlook: Western Hemisphere, April 2025. International Monetary Fund Publications, Washington, DC
2025
-
[16]
The Journal of Finance 57: 2223--2261
Forbes KJ, Rigobon R (2002) No contagion, only interdependence: Measuring stock market co-movements. The Journal of Finance 57: 2223--2261
2002
-
[17]
Journal of Money, Credit and Banking 32: 611--638
Freixas X, Parigi BM, Rochet J-C (2000) Systemic risk, interbank relations, and liquidity provision by the central bank. Journal of Money, Credit and Banking 32: 611--638
2000
-
[18]
Proceedings of the Royal Society A 466: 2401--2423
Gai P, Kapadia S (2010) Contagion in financial networks. Proceedings of the Royal Society A 466: 2401--2423
2010
-
[19]
Journal of Economic Literature 54: 779--831
Glasserman P, Young HP (2016) Contagion in financial networks. Journal of Economic Literature 54: 779--831
2016
-
[20]
Nature 469: 351--355
Haldane AG, May RM (2011) Systemic risk in banking ecosystems. Nature 469: 351--355
2011
-
[21]
Journal of Financial Services Research 8: 123--150
Kaufman GG (1994) Bank contagion: A review of the theory and evidence. Journal of Financial Services Research 8: 123--150
1994
-
[22]
Physical Review E 72: 067102
Lee SH, Goh KI, Kahng B, Kim D (2005) Incomplete information and screening in financial markets. Physical Review E 72: 067102
2005
-
[23]
Journal of Economic Dynamics and Control 66: 36--50
Lux T (2016) Financial contagion as an endogenous feedback process. Journal of Economic Dynamics and Control 66: 36--50
2016
-
[24]
Journal of Business 36: 394--419
Mandelbrot BB (1963) The variation of certain speculative prices. Journal of Business 36: 394--419
1963
-
[25]
The European Physical Journal B 11: 193--197
Mantegna RN (1999) Hierarchical structure in financial markets. The European Physical Journal B 11: 193--197
1999
-
[26]
Cambridge University Press, Cambridge
Mantegna RN, Stanley HE (1999) Introduction to econophysics: Correlations and complexity in finance. Cambridge University Press, Cambridge
1999
-
[27]
Oxford University Press, Oxford
Newman MEJ (2010) Networks: An introduction. Oxford University Press, Oxford
2010
-
[28]
Nature 410: 268--276
Strogatz SH (2001) Exploring complex networks. Nature 410: 268--276
2001
-
[29]
Addison-Wesley, Reading, MA
Tukey JW (1977) Exploratory data analysis. Addison-Wesley, Reading, MA
1977
-
[30]
Physica A: Statistical Mechanics and its Applications 645: 129876
Poledna S, Thurner S (2024) Systemic risk amplification in equity markets: A network-based approach. Physica A: Statistical Mechanics and its Applications 645: 129876
2024
-
[31]
Journal of Financial Stability 52: 100808
Poledna S, Martínez-Jaramillo S, Caccioli F, Thurner S (2021) Quantification of systemic risk from overlapping portfolios in the financial system. Journal of Financial Stability 52: 100808. doi: https://doi.org/10.1016/j.jfs.2020.100808
-
[32]
World Bank Group Publications, Washington, DC
World Bank (2025) Global Economic Prospects, January 2025. World Bank Group Publications, Washington, DC
2025
-
[33]
Online Database, Available at: https://finance.yahoo.com, Accessed: April 25, 2025
Yahoo Finance (2023) Historical financial data. Online Database, Available at: https://finance.yahoo.com, Accessed: April 25, 2025
2023
discussion (0)
Sign in with ORCID, Apple, or X to comment. Anyone can read and Pith papers without signing in.