Recognition: unknown
Prevailing thermally-pulsing-asymptotic-giant branch stars in the near-infrared rest-frame spectra of distant quiescent galaxies: towards robust galaxy ages and masses
Pith reviewed 2026-05-10 01:27 UTC · model grok-4.3
The pith
Models with a strong TP-AGB phase fit the near-infrared spectra of distant quiescent galaxies best and return younger ages plus lower masses.
A machine-rendered reading of the paper's core claim, the machinery that carries it, and where it could break.
Core claim
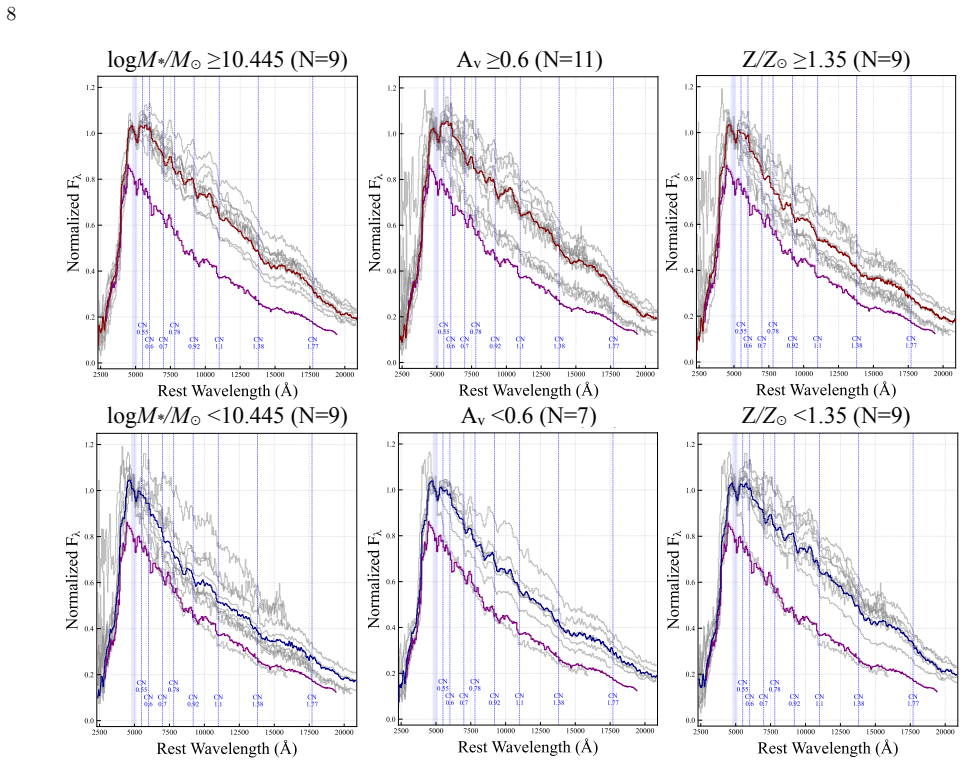
JWST/NIRSpec PRISM spectra of 27 quiescent galaxies at z>1, with high signal-to-noise ratios, are best reproduced by the Maraston 2013 models that incorporate a sizable TP-AGB phase. Relative to the Bruzual & Charlot 2003 and Conroy & Gunn 2009 models, the M13 models yield younger mass-weighted ages and lower stellar masses while all models favor super-solar metallicities. Stacked spectra show TP-AGB features are strongest for galaxies with ages 0.4-1.8 Gyr and are most pronounced in high-mass, dusty, metal-rich systems.
What carries the argument
Comparison of three stellar population synthesis models that differ mainly in the magnitude of the thermally pulsing asymptotic giant branch (TP-AGB) contribution, applied to rest-frame near-infrared spectra to assess fit quality and derived galaxy parameters.
Load-bearing premise
Differences between model fits are driven primarily by the TP-AGB treatment rather than by other ingredients such as dust attenuation, initial mass function, or isochrone libraries, and the sample of 27 galaxies is representative without strong selection biases.
What would settle it
A larger sample of high-redshift quiescent galaxies in which the Bruzual & Charlot 2003 or Conroy & Gunn 2009 models yield statistically superior fits to the spectra would undermine the claim that the TP-AGB phase prevails in these objects.
Figures


read the original abstract
We recently reported the discovery of prominent features from the thermally pulsing asymptotic giant branch (TP-AGB) phase in the near-IR rest-frame of a massive quiescent galaxy (QG) at z~1 observed with JWST, which set strong constraints on population synthesis models. Here we compare those results against similar measures from a much larger sample of JWST/NIRSpec PRISM spectra for 27 QGs at z>1 from programs GO-5019 and CEERS, with signal-to-noise ratios of ~100 (15/27) and ~50 (12/27), respectively. Each spectrum is modeled with three stellar population synthesis models: the latest Maraston (M13) models with a sizable TP-AGB phase, the Bruzual & Charlot 2003 (BC03) models, and the Conroy & Gunn (2009, C09) models, both of which include TP-AGB contributions of smaller magnitude. The M13 model generally provides the best fit quality. Compared to BC03 and C09, M13 yields systematically younger mass-weighted ages (by <500 Myr) hence lower stellar masses (by >0.2 dex). All models favor super-solar (Z/Z_sun > 1.5) metallicities. Signal-to-noise-weighted stacked spectra reveal that TP-AGB-related features are strongest in galaxies with mass-weighted ages of t = 0.4-1.8 Gyr, consistent with the predicted peak TP-AGB contribution in M13 models. Further sample subdivisions show that these features are most pronounced in high-mass (log M_*/M_sun > 10.445), dusty (A_v > 0.6), and metal-rich (Z/Z_sun > 0.35) systems. These results confirm the prevalence of TP-AGB stars in the NIR spectra of high-redshift, intermediate-age galaxies and pave the way towards improved spectral population synthesis modeling and robust stellar ages and masses.
Editorial analysis
A structured set of objections, weighed in public.
Referee Report
Summary. The manuscript analyzes JWST/NIRSpec PRISM spectra of 27 quiescent galaxies at z>1, fitting each with three stellar population synthesis models: Maraston 2013 (M13, with sizable TP-AGB), Bruzual & Charlot 2003 (BC03), and Conroy & Gunn 2009 (C09, both with smaller TP-AGB). It reports that M13 generally yields the best fit quality, systematically younger mass-weighted ages (<500 Myr) and lower stellar masses (>0.2 dex) than the other two, with all models favoring super-solar metallicities. Stacked spectra indicate TP-AGB-related features are strongest for mass-weighted ages 0.4-1.8 Gyr and most pronounced in high-mass, dusty, metal-rich systems.
Significance. If the results hold after addressing the issues below, the work supplies valuable high-S/N empirical constraints on TP-AGB contributions in the near-IR rest-frame of intermediate-age high-redshift quiescent galaxies. This directly informs refinements to population synthesis models and improves the reliability of derived stellar ages and masses, addressing a long-standing uncertainty in modeling evolved stellar populations.
major comments (3)
- [§3] §3 (Model Comparison and Fitting): The systematic offsets in age and mass are presented as arising primarily from differences in TP-AGB treatment. However, the three models also employ distinct isochrone libraries, evolutionary tracks, and stellar spectral libraries. No controlled experiment (e.g., varying only the TP-AGB strength within the M13 framework while freezing other ingredients) is shown, so the attribution of the <500 Myr age and >0.2 dex mass shifts specifically to TP-AGB cannot be isolated from these other differences. This is load-bearing for the central interpretive claim.
- [§2] §2 (Sample and Data): The 27-galaxy sample is drawn from GO-5019 and CEERS with reported S/N levels, but no quantitative assessment of selection biases (e.g., correlations between selection criteria and age, dust, or mass) or completeness tests is provided. Such biases could affect both the stacked spectral features and the reported model preferences, undermining claims about the prevalence of TP-AGB features across the broader population.
- [§4] §4 (Results and Stacking): The fitting procedure lacks sufficient detail on the chi-squared implementation, parameter error estimation, covariance between age/metallicity/dust, and systematic tests (wavelength calibration, dust modeling choices). Without these, it is difficult to evaluate the statistical significance of the reported best-fit quality differences and the subdivisions by age, mass, A_v, and Z.
minor comments (2)
- [Abstract] The abstract states quantitative offsets but does not mention the specific S/N thresholds or the exact number of galaxies in each S/N bin; adding these would improve clarity for readers.
- [Figure captions] Figure captions for the stacked spectra should explicitly state the weighting scheme (signal-to-noise weighted) and the exact age bins used for subdivision.
Simulated Author's Rebuttal
We thank the referee for their detailed and constructive report. We address each of the major comments below and have revised the manuscript accordingly to strengthen the analysis and clarify the interpretations.
read point-by-point responses
-
Referee: [§3] The systematic offsets in age and mass are presented as arising primarily from differences in TP-AGB treatment. However, the three models also employ distinct isochrone libraries, evolutionary tracks, and stellar spectral libraries. No controlled experiment (e.g., varying only the TP-AGB strength within the M13 framework while freezing other ingredients) is shown, so the attribution of the <500 Myr age and >0.2 dex mass shifts specifically to TP-AGB cannot be isolated from these other differences. This is load-bearing for the central interpretive claim.
Authors: We acknowledge that the models differ in multiple ingredients beyond TP-AGB treatment, including isochrones and spectral libraries. The M13 models are distinguished by their prominent TP-AGB phase, which is the focus of our study and consistent with our earlier work on individual galaxies. However, we agree that a controlled test isolating only TP-AGB would be ideal but is not feasible with existing public models. In the revised manuscript, we have expanded the discussion in §3 to note the other differences and to state that the observed systematic offsets are primarily driven by the enhanced TP-AGB contribution in M13, as supported by comparisons in the literature, while acknowledging potential contributions from other model components. revision: partial
-
Referee: [§2] The 27-galaxy sample is drawn from GO-5019 and CEERS with reported S/N levels, but no quantitative assessment of selection biases (e.g., correlations between selection criteria and age, dust, or mass) or completeness tests is provided. Such biases could affect both the stacked spectral features and the reported model preferences, undermining claims about the prevalence of TP-AGB features across the broader population.
Authors: The sample is selected as all quiescent galaxies at z>1 with high-S/N NIRSpec PRISM spectra available from the GO-5019 and CEERS programs. We have added quantitative comparisons in §2 between our sample and the parent photometric catalogs to assess potential biases in mass, dust, and age distributions. A full completeness analysis is challenging without a complete spectroscopic parent sample, but we have included a discussion of selection effects and caveats on generalizing the prevalence of TP-AGB features to the entire high-redshift quiescent population. revision: partial
-
Referee: [§4] The fitting procedure lacks sufficient detail on the chi-squared implementation, parameter error estimation, covariance between age/metallicity/dust, and systematic tests (wavelength calibration, dust modeling choices). Without these, it is difficult to evaluate the statistical significance of the reported best-fit quality differences and the subdivisions by age, mass, A_v, and Z.
Authors: We have revised the manuscript to provide a more detailed description of the fitting procedure. This includes the exact chi-squared formulation, the method for estimating parameter uncertainties via bootstrapping, an analysis of parameter covariances, and results from systematic tests on wavelength shifts and dust attenuation laws. These additions are now in §4 and allow for a better assessment of the robustness of the model comparisons and the trends observed in the stacked spectra. revision: yes
Circularity Check
No significant circularity; results from direct fits to independent JWST spectra
full rationale
The paper fits three distinct stellar population synthesis models (M13, BC03, C09) to new JWST/NIRSpec PRISM spectra of 27 quiescent galaxies from GO-5019 and CEERS. All central claims—best-fit quality for M13, systematic age/mass offsets, super-solar metallicities, and the age dependence of TP-AGB features in stacked spectra—are direct numerical outcomes of these fits and signal-to-noise-weighted stacking. No equation or step reduces by construction to a prior fitted parameter, self-defined quantity, or load-bearing self-citation. The brief reference to the authors' earlier discovery supplies context only and is not used to derive or constrain the new results. The analysis is self-contained against external data and standard model comparisons.
Axiom & Free-Parameter Ledger
free parameters (3)
- mass-weighted age
- metallicity Z/Z_sun
- dust extinction A_v
axioms (2)
- domain assumption Stellar population synthesis models (M13, BC03, C09) accurately predict the spectral energy distribution from stars in different evolutionary phases including TP-AGB
- domain assumption The near-IR rest-frame spectra of the selected quiescent galaxies are dominated by stellar light with negligible contribution from AGN or other non-stellar sources
Reference graph
Works this paper leans on
-
[1]
Arrabal Haro, P., Dickinson, M., Finkelstein, S. L., et al. 2023a, Nature, 622, 707, doi: 10.1038/s41586-023-06521-7 Arrabal Haro, P., Dickinson, M., Finkelstein, S. L., et al. 2023b, ApJL, 951, L22, doi: 10.3847/2041-8213/acdd54
-
[2]
Bruzual, G., & Charlot, S. 2003, MNRAS, 344, 1000, doi: 10.1046/j.1365-8711.2003.06897.x
-
[3]
2022, JWST Calibration Pipeline, 1.6.2 Zenodo, doi: 10.5281/zenodo.7041998
Bushouse, H., Eisenhamer, J., Dencheva, N., et al. 2022, JWST Calibration Pipeline, 1.6.2 Zenodo, doi: 10.5281/zenodo.7041998
-
[4]
Calzetti, D., Armus, L., Bohlin, R. C., et al. 2000, ApJ, 533, 682, doi: 10.1086/308692
work page internal anchor Pith review doi:10.1086/308692 2000
-
[5]
2016, MNRAS, 456, 790, doi: 10.1093/mnras/stv2692
Capozzi, D., Maraston, C., Daddi, E., et al. 2016, MNRAS, 456, 790, doi: 10.1093/mnras/stv2692
-
[6]
Chabrier, G. 2003, PASP, 115, 763, doi: 10.1086/376392
work page internal anchor Pith review doi:10.1086/376392 2003
-
[7]
Conroy, C., & Gunn, J. E. 2010, ApJ, 712, 833, doi: 10.1088/0004-637X/712/2/833
-
[8]
Conroy, C., Gunn, J. E., & White, M. 2009, ApJ, 699, 486, doi: 10.1088/0004-637X/699/1/486
work page internal anchor Pith review doi:10.1088/0004-637x/699/1/486 2009
-
[9]
Cox, I. G., Kartaltepe, J. S., Bagley, M. B., et al. 2025, arXiv e-prints, arXiv:2510.08743, doi: 10.48550/arXiv.2510.08743 de Graaff, A., Rix, H.-W., Carniani, S., et al. 2024, A&A, 684, A87, doi: 10.1051/0004-6361/202347755
-
[10]
Finkelstein, S. L., Bagley, M. B., Arrabal Haro, P., et al. 2025, ApJL, 983, L4, doi: 10.3847/2041-8213/adbbd3
-
[11]
Fitzpatrick, E. L. 1999, PASP, 111, 63, doi: 10.1086/316293
-
[12]
2012, ApJL, 759, L44, doi: 10.1088/2041-8205/759/2/L44
Gobat, R., Strazzullo, V., Daddi, E., et al. 2012, ApJL, 759, L44, doi: 10.1088/2041-8205/759/2/L44
-
[13]
2011, Stellar Populations
Greggio, L., & Renzini, A. 2011, Stellar Populations. A User Guide from Low to High Redshift
2011
-
[14]
Grogin, N. A., Kocevski, D. D., Faber, S. M., et al. 2011, ApJS, 197, 35, doi: 10.1088/0067-0049/197/2/35
- [15]
-
[16]
Koekemoer, A. M., Faber, S. M., Ferguson, H. C., et al. 2011, ApJS, 197, 36, doi: 10.1088/0067-0049/197/2/36
-
[17]
2010, ApJL, 722, L64, doi: 10.1088/2041-8205/722/1/L64
Kriek, M., Labb´ e, I., Conroy, C., et al. 2010, ApJL, 722, L64, doi: 10.1088/2041-8205/722/1/L64
-
[18]
Liu, S., & Luo, A. L. 2023, Research in Astronomy and Astrophysics, 23, 015017, doi: 10.1088/1674-4527/aca583
-
[19]
2025, NatAs, 9, 128, doi: 10.1038/s41550-024-02391-9
Lu, S., Daddi, E., Maraston, C., et al. 2025, Nature Astronomy, 9, 128, doi: 10.1038/s41550-024-02391-9
-
[20]
A., Ramsay, G., Andronov, I., et al
Maraston, C. 1998, MNRAS, 300, 872, doi: 10.1046/j.1365-8711.1998.01947.x
-
[21]
Theevolutionofbinaryfractionsinglobularclusters,
Maraston, C. 2005, MNRAS, 362, 799, doi: 10.1111/j.1365-2966.2005.09270.x
-
[22]
2006, ApJ, 652, 85, doi: 10.1086/508143
Maraston, C., Daddi, E., Renzini, A., et al. 2006, ApJ, 652, 85, doi: 10.1086/508143 No¨ el, N. E. D., Greggio, L., Renzini, A., Carollo, C. M., &
-
[23]
2013, ApJ, 772, 58, doi: 10.1088/0004-637X/772/1/58
Maraston, C. 2013, ApJ, 772, 58, doi: 10.1088/0004-637X/772/1/58
-
[24]
Oke, J. B., & Gunn, J. E. 1983, ApJ, 266, 713, doi: 10.1086/160817
-
[25]
Onodera, M., Carollo, C. M., Renzini, A., et al. 2015, ApJ, 808, 161, doi: 10.1088/0004-637X/808/2/161
-
[26]
2007, ApJL, 659, L103, doi: 10.1086/517999
Maraston, C. 2007, ApJL, 659, L103, doi: 10.1086/517999
-
[27]
Riffel, R., Mason, R. E., Martins, L. P., et al. 2015, MNRAS, 450, 3069, doi: 10.1093/mnras/stv866
-
[28]
2017, ApJS, 229, 32, doi: 10.3847/1538-4365/aa66cb
Stefanon, M., Yan, H., Mobasher, B., et al. 2017, ApJS, 229, 32, doi: 10.3847/1538-4365/aa66cb
-
[29]
2005, ApJ, 621, 673, doi: 10.1086/426932
Oliveira, C. 2005, ApJ, 621, 673, doi: 10.1086/426932 van der Wel, A., Franx, M., van Dokkum, P. G., et al. 2005, ApJ, 631, 145, doi: 10.1086/430464
-
[30]
Verro, K., Trager, S. C., Peletier, R. F., et al. 2022, A&A, 661, A50, doi: 10.1051/0004-6361/202142387
-
[31]
Whitaker, K. E., Labb´ e, I., van Dokkum, P. G., et al. 2011, ApJ, 735, 86, doi: 10.1088/0004-637X/735/2/86
-
[32]
Zibetti, S., Gallazzi, A., Charlot, S., Pierini, D., & Pasquali, A. 2013, MNRAS, 428, 1479, doi: 10.1093/mnras/sts126 15 T able D2.The best-fit physical parameters of 27 QG sample derived by the M13 model No. ID R.A.( ◦, J2000) Decl.( ◦, J2000) SNR mean zspec logM ∗/M⊙ Aget[Gyr]Z/Z⊙A v Programz adopted spec 1 8502 214.974477 52.879579 92.4 2.415 +0.001 −0...
discussion (0)
Sign in with ORCID, Apple, or X to comment. Anyone can read and Pith papers without signing in.