Recognition: unknown
Gauging the Impact of Cosmic Ray Feedback on the Stellar Initial Mass Function
Pith reviewed 2026-05-09 20:41 UTC · model grok-4.3
The pith
Cosmic ray transport raises star formation efficiency by 43% and produces a top-heavier initial mass function
A machine-rendered reading of the paper's core claim, the machinery that carries it, and where it could break.
Core claim
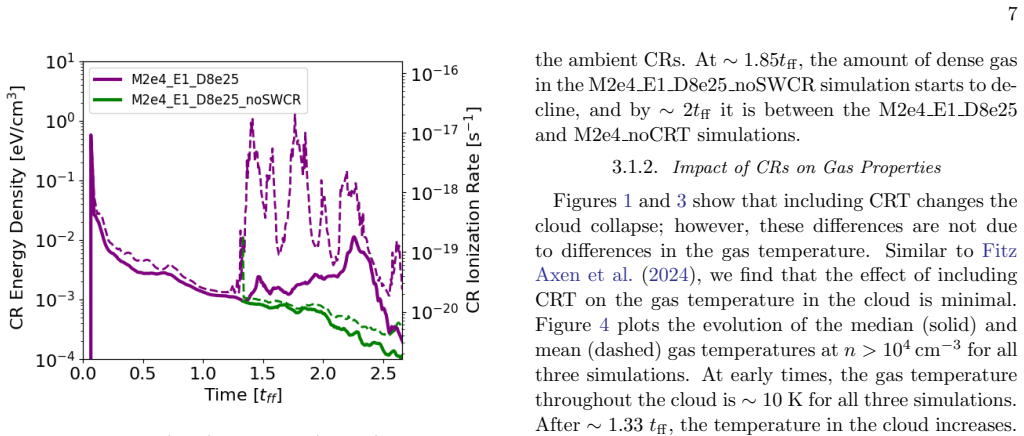
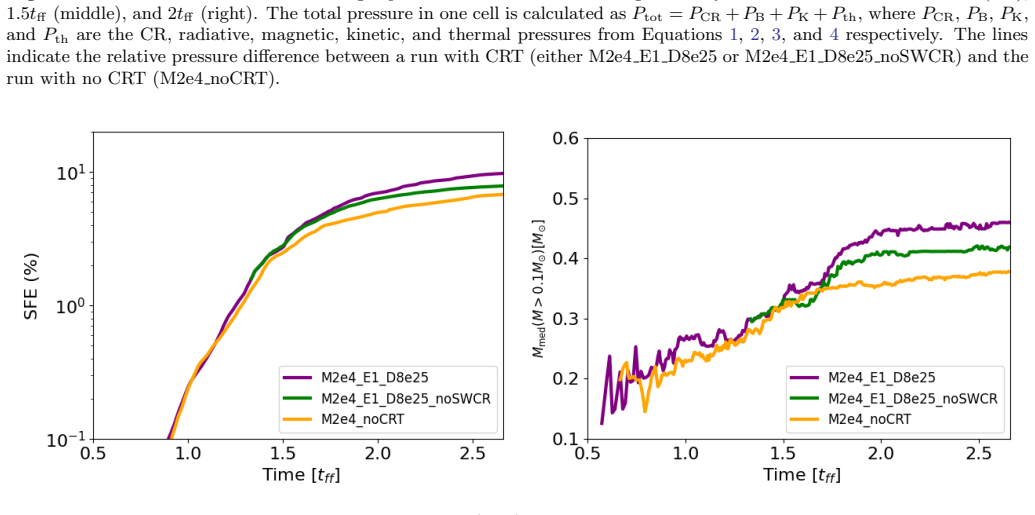
Cosmic ray transport lets external cosmic rays propagate into the cloud interior, amplifying the compressive effect of stellar feedback cavities and thereby increasing the amount of gas that reaches the densities needed for further star formation. When stellar-wind cosmic rays are also accelerated, the final star formation efficiency is 43% higher than in the non-cosmic-ray-transport case and the initial mass function slope above one solar mass is shallower by about 20%. Both effects persist, at reduced strength, when cosmic ray transport is retained but wind acceleration is omitted.
What carries the argument
Cosmic ray transport that permits external cosmic rays to propagate inward and compress gas into higher-density structures after the first massive stars form
If this is right
- Star formation efficiency ends 43% higher when both cosmic ray transport and wind-accelerated cosmic rays are included.
- The initial mass function slope above one solar mass becomes approximately 20% shallower, producing a top-heavier distribution.
- The same trends occur at lower amplitude (16% higher efficiency, 10% shallower slope) when cosmic ray transport is retained but wind cosmic rays are omitted.
- The mechanism supplies one route to explaining why some observed initial mass functions are top-heavy in galactic center-like environments.
Where Pith is reading between the lines
- Models of star formation that omit cosmic ray transport may systematically underpredict efficiency and overpredict the high-mass cutoff of the initial mass function in cosmic ray rich regions.
- The reported differences imply that cosmic ray intensity could serve as an additional environmental parameter when predicting initial mass function variations across galaxies.
- Targeted observations that measure both cosmic ray flux and initial mass function slope within the same molecular cloud complexes could provide a direct test of the compression mechanism.
Load-bearing premise
The cosmic ray transport implementation and stellar wind acceleration model accurately represent real physics at the simulation resolution without dominant numerical artifacts or resolution-dependent biases in the reported SFE and IMF differences.
What would settle it
A direct comparison of star formation efficiency and initial mass function slopes between molecular clouds in high cosmic ray flux regions such as the galactic center and otherwise similar clouds in low cosmic ray flux disk environments would test whether the predicted 43% efficiency increase and 20% slope change are observed.
Figures


read the original abstract
Cosmic rays (CRs) drive ionization and influence gas dynamics in molecular clouds (MCs), potentially impacting the resulting star formation outcomes. Although previous simulations of individual star formation have included methods for cosmic ray transport (CRT), none have been large enough to resolve the stellar initial mass function (IMF). We conduct numerical simulations following the collapse of a $20000 M_{\odot}$ MC and the subsequent star formation including CRT, both with and without CRs accelerated by winds from the young massive stars, and compare against a non-CRT simulation. We show that after the first massive stars form, the cavity produced by feedback is more pronounced in the CRT simulations because the external CRs are able to propagate inwards and compress the gas into higher density structures. This increases the subsequent star formation in the cloud; by the end of the simulation, the SFE in the CRT simulation including stellar wind CRs is 43 \% higher than the non-CRT simulation. The IMF is also top heavy in comparison, with a slope above 1 $M_{\odot}$ that is shallower by $\sim 20$ \%. These effects are also present in the simulation without wind-accelerated CRs, but they are not as pronounced; the SFE is only 16 \% higher than the non-CRT simulation, and the IMF high-mass slope is shallower by $\sim 10$ \%. These results may explain some of the observed top-heavy IMFs, which typically occur in high-CR environments such as the galactic center.
Editorial analysis
A structured set of objections, weighed in public.
Referee Report
Summary. The paper reports hydrodynamical simulations of the collapse of a 20,000 M⊙ molecular cloud that include cosmic-ray transport (CRT) both with and without CRs accelerated by stellar winds from young massive stars. These are compared to a control run without CRT. The central result is that external CRs propagate inward, produce more pronounced feedback cavities, and compress gas into denser structures, yielding a 43% higher star-formation efficiency (SFE) and a ~20% shallower high-mass IMF slope (above 1 M⊙) when wind CRs are included; the effects are weaker (16% higher SFE, ~10% shallower slope) without wind CRs. The authors suggest this mechanism may explain observed top-heavy IMFs in high-CR regions such as the Galactic center.
Significance. If the reported SFE and IMF differences prove robust, the work supplies a concrete physical pathway connecting cosmic-ray pressure gradients to variations in the stellar initial mass function, with direct relevance to star formation in high-CR environments. The three-run comparison (non-CRT, CRT without wind CRs, CRT with wind CRs) is a clear strength that isolates the incremental role of wind-accelerated CRs.
major comments (3)
- [Abstract and Results] Abstract and Results section: the headline quantitative claims (43% higher SFE and ~20% shallower high-mass IMF slope in the CRT+wind-CR run) are stated without any reported grid resolution, convergence tests, error bars on the SFE or IMF slope, or details of the IMF fitting procedure (mass range, binning, or functional form). Because the proposed mechanism relies on CR pressure gradients compressing gas at unresolved scales, these omissions make it impossible to judge whether the differences are physical or numerical artifacts.
- [Methods] Methods section: the cosmic-ray diffusion coefficient and the stellar-wind CR acceleration efficiency are free parameters whose specific values and sensitivity are not reported. The central claim that external CRs drive the cavity and subsequent SFE/IMF changes therefore rests on an untested choice of these parameters; a modest change in either could alter the reported 16% and 43% SFE increments.
- [Results] Results section: the progressive trend across the three runs is presented as evidence that wind CRs amplify the effect, yet no additional resolution or parameter-variation experiments are shown. Without such tests, it remains possible that the reported differences arise from resolution-dependent numerical diffusion or under-resolved CR-gas coupling rather than the intended physical mechanism.
minor comments (2)
- [Abstract] The abstract states the SFE comparison is made “by the end of the simulation” but does not specify the exact simulation time or the precise definition of SFE (e.g., total stellar mass over initial cloud mass).
- [Figures and Results] Figure captions and text should explicitly state the mass range and fitting method used to obtain the high-mass IMF slope so that the ~10% and ~20% differences can be reproduced.
Simulated Author's Rebuttal
We thank the referee for their constructive and detailed report. We address each major comment below and will revise the manuscript to improve clarity and robustness where possible.
read point-by-point responses
-
Referee: [Abstract and Results] Abstract and Results section: the headline quantitative claims (43% higher SFE and ~20% shallower high-mass IMF slope in the CRT+wind-CR run) are stated without any reported grid resolution, convergence tests, error bars on the SFE or IMF slope, or details of the IMF fitting procedure (mass range, binning, or functional form). Because the proposed mechanism relies on CR pressure gradients compressing gas at unresolved scales, these omissions make it impossible to judge whether the differences are physical or numerical artifacts.
Authors: We agree that these details are necessary to assess the results. In the revised manuscript we will explicitly state the grid resolution used for all runs, report any convergence tests performed (including comparisons at lower resolution), add uncertainty estimates or error bars on the SFE values based on the time evolution of the simulations, and fully describe the IMF fitting procedure, including the mass range (above 1 M⊙), binning method, and functional form (power-law slope) employed. These additions will allow readers to evaluate whether the reported differences are physical. revision: yes
-
Referee: [Methods] Methods section: the cosmic-ray diffusion coefficient and the stellar-wind CR acceleration efficiency are free parameters whose specific values and sensitivity are not reported. The central claim that external CRs drive the cavity and subsequent SFE/IMF changes therefore rests on an untested choice of these parameters; a modest change in either could alter the reported 16% and 43% SFE increments.
Authors: We acknowledge that the specific values and sensitivity of these parameters must be documented. We will revise the Methods section to state the exact values adopted for the cosmic-ray diffusion coefficient and the stellar-wind CR acceleration efficiency, together with the literature references that motivated these choices. We will also add a discussion of parameter sensitivity, showing how the SFE and IMF trends respond to modest variations within physically plausible ranges. revision: yes
-
Referee: [Results] Results section: the progressive trend across the three runs is presented as evidence that wind CRs amplify the effect, yet no additional resolution or parameter-variation experiments are shown. Without such tests, it remains possible that the reported differences arise from resolution-dependent numerical diffusion or under-resolved CR-gas coupling rather than the intended physical mechanism.
Authors: The three-run sequence (no CRT, CRT without wind CRs, CRT with wind CRs) is intended to isolate the incremental role of wind-accelerated CRs, and the monotonic trend supports a physical origin. We will expand the Results section with additional discussion of the adopted resolution, the scale at which CR-gas coupling is modeled, and estimates of numerical diffusion effects. We will also report any resolution or parameter-variation tests that were performed. A full suite of new high-resolution simulations is computationally prohibitive for this revision, but the existing comparison and physical consistency of the mechanism provide supporting evidence. revision: partial
Circularity Check
No circularity: results are direct simulation outputs
full rationale
The paper reports comparative results from three separate numerical simulations (non-CRT, CRT without wind CRs, CRT with wind CRs) of a 20000 M⊙ molecular cloud collapse. The claimed 43% SFE increase and ~20% shallower high-mass IMF slope are direct outputs of these runs, not quantities derived from equations that reduce to the inputs by construction. No self-definitional steps, fitted-input predictions, or load-bearing self-citations appear in the derivation chain; the simulation physics (advection, diffusion, streaming, feedback) is independent of the final reported differences.
Axiom & Free-Parameter Ledger
free parameters (2)
- cosmic ray diffusion coefficient
- stellar wind CR acceleration efficiency
axioms (2)
- domain assumption Cosmic ray transport can be approximated by diffusion or streaming in magnetohydrodynamic simulations of molecular clouds
- domain assumption The initial 20,000 solar mass cloud setup and star formation subgrid model produce representative collapse and feedback behavior
Reference graph
Works this paper leans on
-
[1]
Ackermann, M., Ajello, M., Allafort, A., et al. 2011, Science, 334, 1103, doi: 10.1126/science.1210311
-
[2]
Aharonian, F., Yang, R., & de O˜ na Wilhelmi, E. 2019, Nature Astronomy, 3, 561, doi: 10.1038/s41550-019-0724-0 14 Figure 9.Left: Time evolution of the median CR energy density (left axis) and the corresponding CRIR (right axis) for CRs in the indicated gas density range or lower limit for the M2e3 LowRes Fid (solid) and M2e3 LowRes HighBack (dashed) simu...
-
[3]
2010, ApJ, 708, 834, doi: 10.1088/0004-637X/708/1/834
Bartko, H., Martins, F., Trippe, S., et al. 2010, ApJ, 708, 834, doi: 10.1088/0004-637X/708/1/834
-
[4]
Bastian, N., Covey, K. R., & Meyer, M. R. 2010, ARA&A, 48, 339, doi: 10.1146/annurev-astro-082708-101642
-
[5]
Bate, M. R., & Keto, E. R. 2015, MNRAS, 449, 2643, doi: 10.1093/mnras/stv451
-
[6]
Bertoldi, F., & McKee, C. F. 1992, ApJ, 395, 140, doi: 10.1086/171638
-
[7]
2022, A&A, 658, L13, doi: 10.1051/0004-6361/202142619
Bialy, S., Belli, S., & Padovani, M. 2022, A&A, 658, L13, doi: 10.1051/0004-6361/202142619
-
[8]
2013, A&A Rv, 21, 70, doi: 10.1007/s00159-013-0070-7
Blasi, P. 2013, A&A Rv, 21, 70, doi: 10.1007/s00159-013-0070-7
-
[9]
Bonnell, I. A., Bate, M. R., Clarke, C. J., & Pringle, J. E. 1997, MNRAS, 285, 201, doi: 10.1093/mnras/285.1.201 —. 2001, MNRAS, 323, 785, doi: 10.1046/j.1365-8711.2001.04270.x
-
[10]
Booth, C. M., Agertz, O., Kravtsov, A. V., & Gnedin, N. Y. 2013, ApJL, 777, L16, doi: 10.1088/2041-8205/777/1/L16
-
[11]
Bustard, C., & Zweibel, E. G. 2021, ApJ, 913, 106, doi: 10.3847/1538-4357/abf64c
-
[12]
doi:10.3847/1538-4357/aaeac2 , eid =
Butsky, I. S., & Quinn, T. R. 2018, ApJ, 868, 108, doi: 10.3847/1538-4357/aaeac2
-
[13]
M., Marcowith, A., Amato, E., et al
Bykov, A. M., Marcowith, A., Amato, E., et al. 2020, SSRv, 216, 42, doi: 10.1007/s11214-020-00663-0
-
[14]
Cabedo, V., Maury, A., Girart, J. M., et al. 2023, A&A, 669, A90, doi: 10.1051/0004-6361/202243813
-
[15]
Cameron, A. J., Katz, H., Witten, C., et al. 2024, MNRAS, 534, 523, doi: 10.1093/mnras/stae1547
-
[16]
Caselli, P., Walmsley, C. M., Terzieva, R., & Herbst, E. 1998, ApJ, 499, 234, doi: 10.1086/305624
-
[17]
2014, ApJL, 790, L1, doi: 10.1088/2041-8205/790/1/L1
Ceccarelli, C., Dominik, C., L´ opez-Sepulcre, A., et al. 2014, ApJL, 790, L1, doi: 10.1088/2041-8205/790/1/L1
-
[18]
2011, , 740, L4, 10.1088/2041-8205/740/1/L4
Ceccarelli, C., Hily-Blant, P., Montmerle, T., et al. 2011, ApJL, 740, L4, doi: 10.1088/2041-8205/740/1/L4
-
[19]
J., & Volk, H
Cesarsky, C. J., & Volk, H. J. 1978, A&A, 70, 367
1978
-
[20]
2005, in Astrophysics and Space Science
Chabrier, G. 2005, in Astrophysics and Space Science
2005
-
[21]
327, The Initial Mass Function 50 Years Later, ed
Library, Vol. 327, The Initial Mass Function 50 Years Later, ed. E. Corbelli, F. Palla, & H. Zinnecker, 41, doi: 10.1007/978-1-4020-3407-7 5
-
[22]
Chan, T. K., Kereˇ s, D., Hopkins, P. F., et al. 2019, MNRAS, 488, 3716, doi: 10.1093/mnras/stz1895
-
[23]
R., McLeod, A
Chevance, M., Krumholz, M. R., McLeod, A. F., et al. 2023, in Astronomical Society of the Pacific Conference
2023
-
[24]
534, Protostars and Planets VII, ed
Series, Vol. 534, Protostars and Planets VII, ed. S. Inutsuka, Y. Aikawa, T. Muto, K. Tomida, & M. Tamura, 1, doi: 10.48550/arXiv.2203.09570 Commer¸ con, B., Marcowith, A., & Dubois, Y. 2019, A&A, 622, A143, doi: 10.1051/0004-6361/201833809
-
[25]
Cummings, A. C., Stone, E. C., Heikkila, B. C., et al. 2016, ApJ, 831, 18, doi: 10.3847/0004-637X/831/1/18
-
[26]
2006, Proceedings of the National Academy of Science, 103, 12269, doi: 10.1073/pnas.0602117103
Dalgarno, A. 2006, Proceedings of the National Academy of Science, 103, 12269, doi: 10.1073/pnas.0602117103
-
[27]
Dashyan, G., & Dubois, Y. 2020, A&A, 638, A123, doi: 10.1051/0004-6361/201936339
-
[28]
Ensslin, T. A., Biermann, P. L., Kronberg, P. P., & Wu, X.-P. 1997, ApJ, 477, 560, doi: 10.1086/303722 15
-
[29]
Everett, J. E., & Zweibel, E. G. 2011, ApJ, 739, 60, doi: 10.1088/0004-637X/739/2/60
-
[30]
2019, PhRvD, 99, 103023, doi: 10.1103/PhysRevD.99.103023
Evoli, C., Aloisio, R., & Blasi, P. 2019, PhRvD, 99, 103023, doi: 10.1103/PhysRevD.99.103023
-
[31]
Farber, R., Ruszkowski, M., Yang, H. Y. K., & Zweibel, E. G. 2018, ApJ, 856, 112, doi: 10.3847/1538-4357/aab26d
-
[32]
Martin-Alvarez, S. 2022, MNRAS, 513, 5000, doi: 10.1093/mnras/stac1196
-
[33]
Federrath, C., & Klessen, R. S. 2012, ApJ, 761, 156, doi: 10.1088/0004-637X/761/2/156 Fitz Axen, M., Offner, S., Hopkins, P. F., Krumholz, M. R., & Grudi´ c, M. Y. 2024, ApJ, 973, 16, doi: 10.3847/1538-4357/ad675a Fitz Axen, M., Offner, S. S. S., Gaches, B. A. L., et al. 2021, ApJ, 915, 43, doi: 10.3847/1538-4357/abfc55
-
[34]
Gaches, B. A. L., & Offner, S. S. R. 2018, ApJ, 861, 87, doi: 10.3847/1538-4357/aac94d
-
[35]
2017, MNRAS, 466, 1903, doi: 10.1093/mnras/stw3209
Gatto, A., Walch, S., Naab, T., et al. 2017, MNRAS, 466, 1903, doi: 10.1093/mnras/stw3209
-
[36]
2022, MNRAS, 510, 3917, doi: 10.1093/mnras/stab3462
Girichidis, P., Pfrommer, C., Pakmor, R., & Springel, V. 2022, MNRAS, 510, 3917, doi: 10.1093/mnras/stab3462
-
[37]
2023, arXiv e-prints, arXiv:2303.03417, doi: 10.48550/arXiv.2303.03417
Springel, V. 2023, arXiv e-prints, arXiv:2303.03417, doi: 10.48550/arXiv.2303.03417
-
[38]
Girichidis, P., Naab, T., Walch, S., et al. 2016, ApJL, 816, L19, doi: 10.3847/2041-8205/816/2/L19
-
[39]
Glover, S. C. O., & Clark, P. C. 2012, MNRAS, 426, 377, doi: 10.1111/j.1365-2966.2012.21737.x Grudi´ c, M. Y. in prep. Grudi´ c, M. Y., Guszejnov, D., Hopkins, P. F., Offner, S. S. R., & Faucher-Gigu` ere, C.-A. 2021, MNRAS, 506, 2199, doi: 10.1093/mnras/stab1347 Grudi´ c, M. Y., Guszejnov, D., Offner, S. S. R., et al. 2022, MNRAS, 512, 216, doi: 10.1093/...
-
[40]
Guo, F., & Oh, S. P. 2008, MNRAS, 384, 251, doi: 10.1111/j.1365-2966.2007.12692.x
-
[41]
2024, ApJ, 970, 136, doi: 10.3847/1538-4357/ad4da2
Guo, Z., Zhang, Z.-Y., Yan, Z., et al. 2024, ApJ, 970, 136, doi: 10.3847/1538-4357/ad4da2
-
[42]
Guszejnov, D., Grudi´ c, M. Y., Hopkins, P. F., Offner, S. S. R., & Faucher-Gigu` ere, C.-A. 2021, MNRAS, 502, 3646, doi: 10.1093/mnras/stab278
-
[43]
doi:10.1093/mnras/stac2060 , eprint =
Guszejnov, D., Grudi´ c, M. Y., Offner, S. S. R., et al. 2022, MNRAS, 515, 4929, doi: 10.1093/mnras/stac2060
-
[44]
Habegger, R., Ruszkowski, M., & Zweibel, E. G. 2025, arXiv e-prints, arXiv:2510.24622, doi: 10.48550/arXiv.2510.24622
-
[45]
Hanasz, M., Lesch, H., Naab, T., et al. 2013, ApJL, 777, L38, doi: 10.1088/2041-8205/777/2/L38
-
[46]
2011, A&A, 533, A94, doi: 10.1051/0004-6361/201117315
Hill, T., Motte, F., Didelon, P., et al. 2011, A&A, 533, A94, doi: 10.1051/0004-6361/201117315
-
[47]
Yang, H. Y. K. 2019, MNRAS, 490, 1271, doi: 10.1093/mnras/stz2568
-
[48]
Hopkins, P. F. 2015, MNRAS, 450, 53, doi: 10.1093/mnras/stv195 —. 2016, MNRAS, 462, 576, doi: 10.1093/mnras/stw1578
-
[49]
doi:10.1093/mnras/stv2180 , eprint =
Hopkins, P. F., & Raives, M. J. 2016, MNRAS, 455, 51, doi: 10.1093/mnras/stv2180
-
[50]
doi:10.1093/mnras/stab2635 , eprint =
Hopkins, P. F., Squire, J., & Butsky, I. S. 2022a, MNRAS, 509, 3779, doi: 10.1093/mnras/stab2635
-
[51]
doi:10.1093/mnras/stac2909 , eprint =
Hopkins, P. F., Squire, J., Butsky, I. S., & Ji, S. 2022b, MNRAS, 517, 5413, doi: 10.1093/mnras/stac2909
-
[52]
F., Wetzel, A., Kereˇ s, D., et al
Hopkins, P. F., Wetzel, A., Kereˇ s, D., et al. 2018, MNRAS, 477, 1578, doi: 10.1093/mnras/sty674
-
[53]
Hopkins, P. F., Chan, T. K., Garrison-Kimmel, S., et al. 2020, MNRAS, 492, 3465, doi: 10.1093/mnras/stz3321
-
[54]
doi:10.1093/mnras/stac3489 , eprint =
Hopkins, P. F., Wetzel, A., Wheeler, C., et al. 2023, MNRAS, 519, 3154, doi: 10.1093/mnras/stac3489
-
[55]
Hosek, Matthew W., J., Lu, J. R., Anderson, J., et al. 2019, ApJ, 870, 44, doi: 10.3847/1538-4357/aaef90
-
[56]
Indriolo, N., Ivlev, A. V., Pellegrin, T., et al. 2026, ApJ, 997, 123, doi: 10.3847/1538-4357/ae21ba
-
[57]
Pfrommer, C. 2018, MNRAS, 475, 570, doi: 10.1093/mnras/stx3221
-
[58]
doi:10.1093/mnras/staa1849 , eprint =
Ji, S., Chan, T. K., Hummels, C. B., et al. 2020, MNRAS, 496, 4221, doi: 10.1093/mnras/staa1849
-
[59]
Cosmic ray feedback in hydrodynamical simulations of galaxy formation
Jubelgas, M., Springel, V., Enßlin, T., & Pfrommer, C. 2008, A&A, 481, 33, doi: 10.1051/0004-6361:20065295
-
[60]
Kroupa, P. 2002, Science, 295, 82, doi: 10.1126/science.1067524
-
[61]
2021, arXiv e-prints, arXiv:2112.10788, doi: 10.48550/arXiv.2112.10788
Kroupa, P., & Jerabkova, T. 2021, arXiv e-prints, arXiv:2112.10788, doi: 10.48550/arXiv.2112.10788
-
[62]
Krumholz, M. R., Crocker, R. M., & Offner, S. S. R. 2023, MNRAS, 520, 5126, doi: 10.1093/mnras/stad459
-
[63]
Krumholz, M. R., Crocker, R. M., & Sampson, M. L. 2022, MNRAS, 517, 1355, doi: 10.1093/mnras/stac2712
-
[64]
Krumholz, M. R., Crocker, R. M., Xu, S., et al. 2020, MNRAS, 493, 2817, doi: 10.1093/mnras/staa493
-
[65]
Krumholz, M. R., & McKee, C. F. 2008, Nature, 451, 1082, doi: 10.1038/nature06620
-
[66]
Kulsrud, R., & Pearce, W. P. 1969, ApJ, 156, 445, doi: 10.1086/149981 16
-
[67]
Levermore, C. D. 1984, JQSRT, 31, 149, doi: 10.1016/0022-4073(84)90112-2
-
[68]
2023, Nature, 613, 460, doi: 10.1038/s41586-022-05488-1
Li, J., Liu, C., Zhang, Z.-Y., et al. 2023, Nature, 613, 460, doi: 10.1038/s41586-022-05488-1
-
[69]
2013, AJ, 145, 46, doi: 10.1088/0004-6256/145/2/46
Lim, B., Chun, M.-Y., Sung, H., et al. 2013, AJ, 145, 46, doi: 10.1088/0004-6256/145/2/46
-
[70]
Liu, B., Yang, R.-z., & Chen, Z. 2022, MNRAS, 513, 4747, doi: 10.1093/mnras/stac1252
-
[71]
Lu, J. R., Do, T., Ghez, A. M., et al. 2013, ApJ, 764, 155, doi: 10.1088/0004-637X/764/2/155
-
[72]
Luhman, K. L. 2018, AJ, 156, 271, doi: 10.3847/1538-3881/aae831
-
[73]
Mannheim, K., & Schlickeiser, R. 1994, A&A, 286, 983, doi: 10.48550/arXiv.astro-ph/9402042
work page internal anchor Pith review doi:10.48550/arxiv.astro-ph/9402042 1994
-
[74]
McKee, C. F., & Offner, S. S. R. 2010, ApJ, 716, 167, doi: 10.1088/0004-637X/716/1/167
-
[75]
McKee, C. F., & Tan, J. C. 2002, Nature, 416, 59, doi: 10.1038/416059a —. 2003, ApJ, 585, 850, doi: 10.1086/346149
-
[76]
2019, A&A, 624, L1, doi: 10.1051/0004-6361/201935105
Luri, X. 2019, A&A, 624, L1, doi: 10.1051/0004-6361/201935105
-
[77]
2018, ARA&A, 56, 41, doi: 10.1146/annurev-astro-091916-055235
Motte, F., Bontemps, S., & Louvet, F. 2018, ARA&A, 56, 41, doi: 10.1146/annurev-astro-091916-055235
-
[78]
Mouschovias, T. C., & Spitzer, L., J. 1976, ApJ, 210, 326, doi: 10.1086/154835 Nguyen Luong, Q., Motte, F., Hennemann, M., et al. 2011, A&A, 535, A76, doi: 10.1051/0004-6361/201117831
-
[79]
Obolentseva, M., Ivlev, A. V., Silsbee, K., et al. 2024, ApJ, 973, 142, doi: 10.3847/1538-4357/ad71ce
-
[80]
Offner, S. S. R., Clark, P. C., Hennebelle, P., et al. 2014, in Protostars and Planets VI, ed. H. Beuther, R. S. Klessen, C. P. Dullemond, & T. Henning, 53–75, doi: 10.2458/azu uapress 9780816531240-ch003
work page doi:10.2458/azu 2014
discussion (0)
Sign in with ORCID, Apple, or X to comment. Anyone can read and Pith papers without signing in.