Recognition: unknown
Optimal Stopping in Sequential Clinical Prediction
Pith reviewed 2026-05-08 11:05 UTC · model grok-4.3
The pith
In sequential clinical prediction, the stage with the best model is not always the optimal time to stop testing and decide.
A machine-rendered reading of the paper's core claim, the machinery that carries it, and where it could break.
Core claim
Sequential clinical prediction is formulated as an optimal-stopping problem under staged information. The central mechanism is the patient-specific conditional risk trajectory, where forward martingales track coherent risk updates and reverse martingales model information loss from richer to simpler predictors. Across four retrospective datasets, the preferred stopping stage varied by setting, showing that the best-performing model is not always the best stage for clinical decision-making.
What carries the argument
Patient-specific conditional risk trajectory using forward and reverse martingale structures to represent risk updating and information loss across stages.
If this is right
- Preferred stopping stages differ by clinical setting, sometimes favoring early action.
- Fuller information does not always justify added delay or invasiveness.
- Optimal decisions require balancing model accuracy with timing costs.
- Martingale structures allow coherent modeling of risk changes over stages.
Where Pith is reading between the lines
- This could be extended to other sequential decision domains like legal evidence gathering or investment timing.
- Prospective studies in live clinical environments would be needed to validate the retrospective findings.
- Integrating test costs explicitly into the stopping rule could make the framework more actionable.
- The approach highlights limitations in standard retrospective model evaluation for real-time use.
Load-bearing premise
Retrospective cohorts accurately capture the real-time sequential arrival of information and patient-specific conditional risk trajectories can be reliably modeled with forward and reverse martingale structures.
What would settle it
Comparing outcomes in a setting where clinicians follow the paper's optimal stopping recommendations versus standard full-information practice would falsify the claim if no improvement is seen.
Figures


read the original abstract
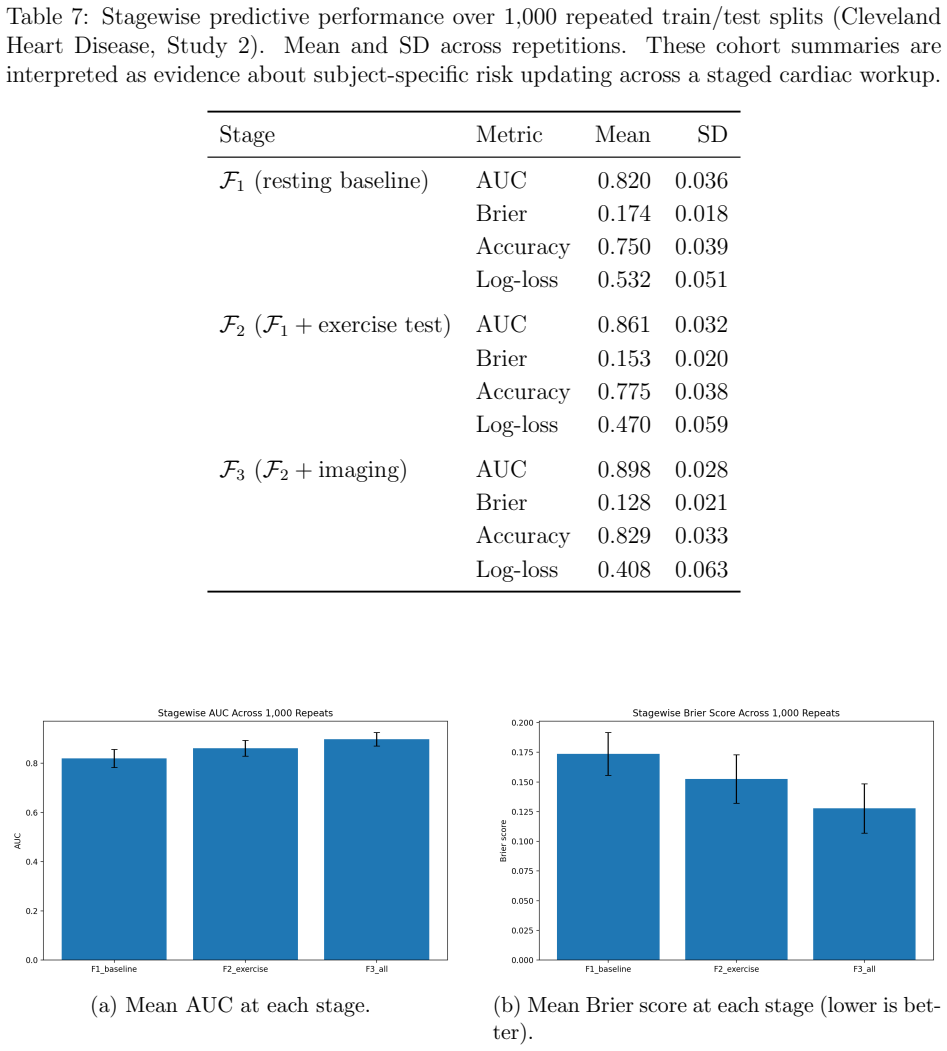
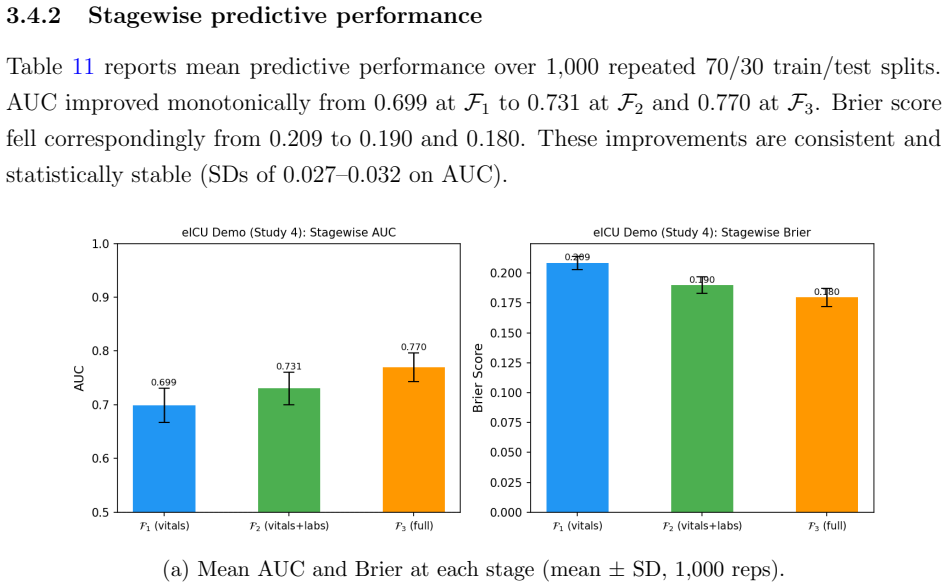
Most clinical prediction studies are developed from retrospective cohorts and reported as if all patient information were observed at once. In practice, clinicians face a more consequential question: \emph{when is there already enough information to stop testing and act?} A later stage can produce a better-looking model and still fail to justify the added delay, burden, or invasiveness of further workup. We formulate sequential clinical prediction as an \emph{optimal-stopping} problem under staged information, and illustrate the framework across four retrospective clinical datasets. The preferred stopping stage differed substantially by setting: sometimes fuller information justified waiting, whereas in other cases early or intermediate action was preferable. The key object is the patient-specific conditional risk trajectory: forward martingale structure represents coherent risk updating across stages, while reverse-martingale ideas describe information loss when a richer predictor is replaced by a simpler score. The results demonstrate that the best-performing model is not always the best stage for clinical decision-making.
Editorial analysis
A structured set of objections, weighed in public.
Referee Report
Summary. The manuscript formulates sequential clinical prediction as an optimal-stopping problem under staged information. It models patient-specific conditional risk trajectories via forward martingales for coherent risk updating across stages and reverse-martingale structures for information loss when richer predictors are replaced by simpler scores. Illustrated on four retrospective clinical datasets, the results indicate that the preferred stopping stage varies substantially by setting and that the best-performing predictive model is not necessarily the optimal stage for clinical decision-making.
Significance. If the central claims hold after addressing data and estimation issues, the work offers a principled framework for incorporating timing, burden, and information costs into clinical prediction evaluation, moving beyond static accuracy metrics. The martingale approach supplies a coherent mathematical structure for sequential risk trajectories. The cross-dataset illustration is a strength, as is the explicit contrast between model performance and decision-stage optimality. However, the retrospective design limits immediate applicability without further validation of the trajectories under prospective sequential observation.
major comments (3)
- Methods (trajectory estimation): The patient-specific conditional risk trajectories are constructed from fully observed retrospective records, yet the manuscript provides no explicit treatment of selection bias or altered filtrations that would arise when stopping decisions prospectively determine which future tests occur and which patients remain in the cohort. This assumption is load-bearing for the optimality claims and the conclusion that best model ≠ best stage.
- Results (four datasets): The reported differences in preferred stopping stages lack visible derivation details, error quantification, confidence intervals, or sensitivity analyses for the martingale-based stopping rules, as well as explicit handling of post-hoc stage selection. Without these, it is difficult to assess whether the variation supports the central claim or reflects sampling variability in the retrospective cohorts.
- Methods (martingale construction): It remains unclear whether the forward and reverse martingale trajectories are derived from first principles independent of the evaluation data or fitted to the same retrospective records used to assess stopping performance; the latter would introduce circularity that undermines the optimality guarantees.
minor comments (2)
- Abstract: A brief statement of the specific clinical outcomes or dataset characteristics would help readers assess the scope of the four settings.
- Notation: The precise definition of the staged filtration and the exact functional form of the reverse martingale (information loss) should be stated explicitly to permit replication and verification.
Simulated Author's Rebuttal
We thank the referee for the detailed and constructive report. We address each major comment below, indicating where revisions will be made to strengthen the manuscript.
read point-by-point responses
-
Referee: Methods (trajectory estimation): The patient-specific conditional risk trajectories are constructed from fully observed retrospective records, yet the manuscript provides no explicit treatment of selection bias or altered filtrations that would arise when stopping decisions prospectively determine which future tests occur and which patients remain in the cohort. This assumption is load-bearing for the optimality claims and the conclusion that best model ≠ best stage.
Authors: We agree that the retrospective design assumes complete observation of all stages, which does not capture the selection bias or filtration changes that would arise prospectively when stopping decisions censor future data. The martingale properties are defined conditionally on the observed filtration in the data at hand. We will add an explicit limitations subsection discussing this point, clarifying that the current results provide a benchmark under full observation and that prospective validation with adaptive data collection is required to confirm the optimality claims in practice. revision: partial
-
Referee: Results (four datasets): The reported differences in preferred stopping stages lack visible derivation details, error quantification, confidence intervals, or sensitivity analyses for the martingale-based stopping rules, as well as explicit handling of post-hoc stage selection. Without these, it is difficult to assess whether the variation supports the central claim or reflects sampling variability in the retrospective cohorts.
Authors: We will revise the results section to include the full dynamic-programming derivation of the optimal stopping times from the estimated value functions. Bootstrap confidence intervals will be added for the patient-level stopping stages and expected costs, together with sensitivity analyses over cost parameters, discount factors, and model specifications. We will also clarify that stage selection follows directly from the optimal-stopping recursion rather than post-hoc comparison, and report the empirical distribution of stopping times across patients in each dataset. revision: yes
-
Referee: Methods (martingale construction): It remains unclear whether the forward and reverse martingale trajectories are derived from first principles independent of the evaluation data or fitted to the same retrospective records used to assess stopping performance; the latter would introduce circularity that undermines the optimality guarantees.
Authors: The forward-martingale property follows from the tower property of conditional expectation and holds for any coherent risk process by construction, independent of any particular dataset. The reverse-martingale structure for information loss under reduced filtrations is likewise a general consequence of conditional-expectation projections. While the numerical trajectories are estimated from the retrospective records, the optimality guarantees apply to the estimated process itself. We will add a clarifying paragraph in the methods section making this distinction explicit and note that out-of-sample or cross-validated estimation can be used in extensions to reduce in-sample effects. revision: yes
Circularity Check
No significant circularity; standard optimal stopping applied to staged data
full rationale
The paper formulates sequential prediction as an optimal-stopping problem and invokes forward/reverse martingale properties to represent risk trajectories. These are standard stochastic-process tools applied to the clinical setting rather than derived from or fitted to the target conclusions. The empirical illustrations on four retrospective cohorts compare stopping stages to model performance without any quoted step reducing a prediction to its own inputs by construction, self-defining a quantity, or relying on a load-bearing self-citation chain. The central claim therefore remains an independent modeling result rather than a tautology.
Axiom & Free-Parameter Ledger
axioms (2)
- domain assumption Patient information arrives in discrete stages and conditional risk estimates update coherently across stages.
- domain assumption Information loss when moving from a richer predictor to a simpler score can be described by reverse-martingale properties.
Forward citations
Cited by 1 Pith paper
-
Practical Boundary Degeneracy and Reverse-Martingale Limits in Sequential Binary Models
Finite sequential binary data support practical boundary probabilities via reverse-martingale limits rather than exact degeneracy, with a three-condition stopping rule that separates transient from genuine cases.
Reference graph
Works this paper leans on
-
[1]
Doob, J. L. (1953).Stochastic Processes. Wiley, New York
1953
-
[2]
(1991).Probability with Martingales
Williams, D. (1991).Probability with Martingales. Cambridge University Press
1991
-
[3]
Wald, A. (1945). Sequential tests of statistical hypotheses.Annals of Mathematical Statistics, 16(2), 117–186
1945
-
[4]
(1985).Sequential Analysis: Tests and Confidence Intervals
Siegmund, D. (1985).Sequential Analysis: Tests and Confidence Intervals. Springer, New York
1985
-
[5]
S., Robbins, H., and Siegmund, D
Chow, Y. S., Robbins, H., and Siegmund, D. (1971).Great Expectations: The Theory of Optimal Stopping. Houghton Mifflin, Boston
1971
-
[6]
and Shiryaev, A
Peskir, G. and Shiryaev, A. (2006).Optimal Stopping and Free-Boundary Problems. Birkh¨ auser, Basel
2006
-
[7]
Berger, J. O. (1985).Statistical Decision Theory and Bayesian Analysis, 2nd ed. Springer, New York
1985
-
[8]
Berry, D. A. and Fristedt, B. (1985).Bandit Problems: Sequential Allocation of Exper- iments. Chapman and Hall, London
1985
-
[9]
J., Freedman, L
Spiegelhalter, D. J., Freedman, L. S., and Parmar, M. K. B. (1994). Bayesian approaches to randomized trials.Journal of the Royal Statistical Society, Series A, 157(3), 357–416
1994
-
[10]
(1975).Sequential Medical Trials, 2nd ed
Armitage, P. (1975).Sequential Medical Trials, 2nd ed. Blackwell, Oxford. 29
1975
-
[11]
Vickers, A. J. and Elkin, E. B. (2006). Decision curve analysis: a novel method for evaluating prediction models.Medical Decision Making, 26(6), 565–574
2006
-
[12]
and Raftery, A
Gneiting, T. and Raftery, A. E. (2007). Strictly proper scoring rules, prediction, and estimation.Journal of the American Statistical Association, 102(477), 359–378
2007
-
[13]
H., Street, W
Wolberg, W. H., Street, W. N., and Mangasarian, O. L. (1994). Machine learning tech- niques to diagnose breast cancer from image-processed nuclear features of fine needle aspirates.Cancer Letters, 77, 163–171
1994
-
[14]
Detrano, R., Janosi, A., Steinbrunn, W., et al. (1989). International application of a new probability algorithm for the diagnosis of coronary artery disease.American Journal of Cardiology, 64(5), 304–310
1989
-
[15]
W., Everhart, J
Smith, J. W., Everhart, J. E., Dickson, W. C., Knowler, W. C., and Johannes, R. S. (1988). Using the ADAP learning algorithm to forecast the onset of diabetes mellitus. Proceedings of the Annual Symposium on Computer Application in Medical Care, 261– 265
1988
-
[16]
J., Johnson, A
Pollard, T. J., Johnson, A. E. W., Raffa, J. D., Celi, L. A., Mark, R. G., and Badawi, O. (2018). The eICU Collaborative Research Database, a freely available multi-center database for critical care research.Scientific Data, 5, 180178. A Proofs of Main Results Throughout, (Ω,F,P) is a fixed probability space. All conditional expectations are versions of t...
2018
discussion (0)
Sign in with ORCID, Apple, or X to comment. Anyone can read and Pith papers without signing in.