Recognition: unknown
Probable Detection of a Cooler Gas Component in the Perseus Cluster with XRISM
Pith reviewed 2026-05-08 09:54 UTC · model grok-4.3
The pith
XRISM observations detect a cooler gas component with high velocity dispersion in the inner Perseus cluster.
A machine-rendered reading of the paper's core claim, the machinery that carries it, and where it could break.
Core claim
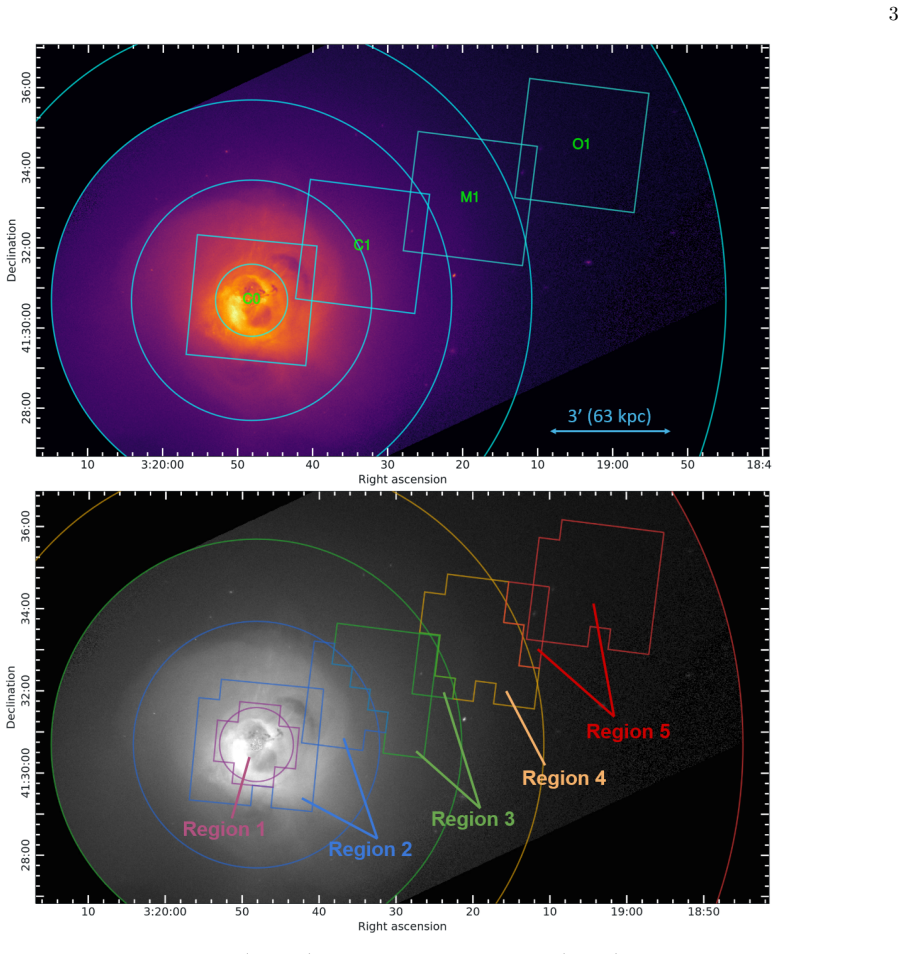
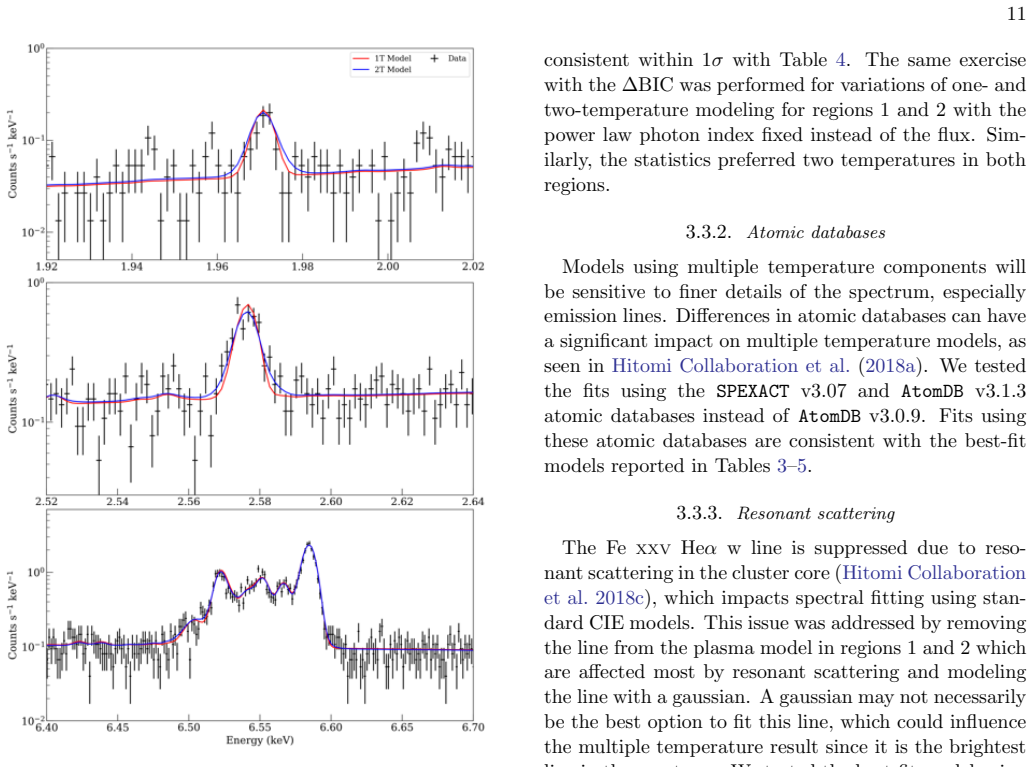
Beyond roughly 60 kpc the intracluster gas is well described by a single-temperature plasma, while the inner 60 kpc requires two phases. The hotter phase traced by Fe He alpha has velocity dispersion at most 140 km/s. The cooler phase, 1.87 to 2.43 keV, shows velocity dispersion 300 to 400 km/s and bulk velocity offset 21 to 213 km/s relative to the central galaxy. These properties are recovered from the broad wings on S Ly alpha and Fe He alpha lines after correction for spatial-spectral mixing and the bright central point source.
What carries the argument
High-resolution X-ray line-profile spectroscopy from the XRISM Resolve spectrometer, which isolates broad wings in emission lines to separate the cooler, higher-dispersion gas from the hotter phase.
If this is right
- The inner region contains multiphase gas while the outer atmosphere does not.
- The cooler phase carries a Mach number near unity and supplies 23 to 34 percent of the non-thermal pressure support.
- The velocity offsets and dispersion link the cooler gas to the known sloshing spiral or to disturbance by radio jets.
- Bulk motions in the cooler gas are consistent with line-of-sight merging halos that helped build the cool core.
Where Pith is reading between the lines
- Similar multiphase signatures may appear in other cool-core clusters once comparable spectral resolution is applied.
- Refined modeling of gain variations and point-source contamination would either confirm or weaken the detection.
- The elevated turbulence in the cooler gas may help regulate how rapidly the core can cool.
Load-bearing premise
Correct identification of the cooler component requires accurate subtraction of spatial-spectral mixing and the central point source without large errors from low-energy gain variations.
What would settle it
An independent high-resolution spectrum of the same inner region that shows no excess broad wings in S Ly alpha or Fe He alpha after identical modeling would rule out the cooler component.
Figures


read the original abstract
We present an analysis of the temperature structure of the Perseus cluster atmosphere using XRISM Resolve observations. The average temperature rises from 3.3 keV near the nucleus of NGC 1275 to 8 keV at 10 arcmin (210 kpc), which is consistent with Chandra and XMM measurements. The velocity and velocity dispersion profiles are broadly consistent with those in arXiv:2509.04421. While the gas at altitudes beyond $\sim60$ kpc can be modeled as a single temperature plasma, we find evidence for more than one gas phase in the inner $\sim60$ kpc. The hotter gas component, traced primarily by the Fe He$\alpha$ line, has a velocity dispersion of $\lesssim140$ km s$^{-1}$. We detect a cooler, $\sim1.87-2.43$ keV, gas component with a velocity dispersion of $\sim300-400$ km s$^{-1}$ and a bulk velocity of $\sim 21-213$ km s$^{-1}$ with respect to the central galaxy. These ranges reflect large systematic uncertainties associated with modeling spatial-spectral mixing and the bright central point source. Potential low energy gain variations may add additional uncertainties. The cooler component is identified by broad wings in prominent emission lines, most notably S Ly$\alpha$ and Fe He$\alpha$. This cooler component's Mach number $\sim0.73-0.96$ and non-thermal pressure fraction of $\sim22.9-33.7\%$ are much higher than found for the hotter gas. The cooler gas may be associated with merging halos along the line of sight which formed the cool, sloshing spiral and/or cooling gas being disturbed by the radio jets and lobes.
Editorial analysis
A structured set of objections, weighed in public.
Referee Report
Summary. The manuscript analyzes XRISM Resolve spectra of the Perseus cluster, reporting a radially increasing temperature profile from 3.3 keV near NGC 1275 to 8 keV at 210 kpc that matches prior Chandra/XMM results. Beyond ~60 kpc the ICM is consistent with a single-temperature plasma, while the inner ~60 kpc requires at least two phases: a hotter component (traced by Fe Heα) with velocity dispersion ≲140 km s^{-1} and a cooler ~1.87–2.43 keV component with velocity dispersion ~300–400 km s^{-1} and bulk velocity ~21–213 km s^{-1} relative to the central galaxy. The cooler phase is identified via broad wings on S Lyα and Fe Heα; the authors explicitly flag large systematic uncertainties from spatial-spectral mixing and the bright central point source, and suggest possible links to sloshing or AGN feedback.
Significance. If the two-phase detection survives detailed systematic tests, the work supplies new kinematic constraints on the multi-temperature ICM in a cool-core cluster using XRISM’s high-resolution spectroscopy. The derived Mach number (~0.73–0.96) and non-thermal pressure fraction (~23–34 %) for the cooler phase would be useful benchmarks for simulations of turbulence, sloshing, and feedback. The explicit acknowledgment of modeling uncertainties is a strength, though it limits the immediate impact of the claimed detection.
major comments (2)
- [Abstract and inner ~60 kpc spectral modeling] Abstract and inner-region analysis: the claim that the inner ~60 kpc requires a distinct cooler component rests on broad line wings that cannot be reproduced by the hotter component alone. However, no controlled variations of the spatial-spectral mixing kernel or NGC 1275 point-source spectrum are shown to demonstrate that the two-component preference (e.g., via Δχ² or Bayesian evidence) survives these systematics; the reported velocity ranges already incorporate large uncertainties, but the impact on model selection is not quantified.
- [Discussion of derived quantities] The Mach number (~0.73–0.96) and non-thermal pressure fraction (~22.9–33.7 %) quoted for the cooler component are derived directly from its velocity dispersion; because the dispersion range itself is dominated by systematic uncertainties in mixing and point-source subtraction, these derived quantities inherit the same unquantified systematics and cannot yet be used as robust physical constraints.
minor comments (2)
- [Observations and data reduction] The exact radial boundaries and binning used to separate the inner (~60 kpc) and outer regions should be stated explicitly, together with the number of spectra or extraction regions involved.
- [Results] A brief table or figure summarizing the best-fit parameters and their statistical versus systematic error budgets for both components would improve clarity.
Simulated Author's Rebuttal
We are grateful to the referee for their thorough review and valuable feedback on our manuscript. We have carefully considered the major comments and provide point-by-point responses below. Where appropriate, we have made revisions to strengthen the presentation of our results and the discussion of uncertainties.
read point-by-point responses
-
Referee: [Abstract and inner ~60 kpc spectral modeling] Abstract and inner-region analysis: the claim that the inner ~60 kpc requires a distinct cooler component rests on broad line wings that cannot be reproduced by the hotter component alone. However, no controlled variations of the spatial-spectral mixing kernel or NGC 1275 point-source spectrum are shown to demonstrate that the two-component preference (e.g., via Δχ² or Bayesian evidence) survives these systematics; the reported velocity ranges already incorporate large uncertainties, but the impact on model selection is not quantified.
Authors: We thank the referee for pointing this out. The manuscript does note the large systematic uncertainties in the reported velocity ranges for the cooler component. However, we agree that we have not quantified how variations in the spatial-spectral mixing kernel and the modeling of the NGC 1275 point source affect the statistical preference for the two-temperature model over a single-temperature one. In the revised manuscript, we will add a section or appendix presenting controlled tests where we vary these components and report the resulting changes in fit statistics (Δχ² and/or Bayesian evidence) to demonstrate the robustness of the two-component detection. This will address the concern directly. revision: yes
-
Referee: [Discussion of derived quantities] The Mach number (~0.73–0.96) and non-thermal pressure fraction (~22.9–33.7 %) quoted for the cooler component are derived directly from its velocity dispersion; because the dispersion range itself is dominated by systematic uncertainties in mixing and point-source subtraction, these derived quantities inherit the same unquantified systematics and cannot yet be used as robust physical constraints.
Authors: We concur with the referee that the Mach number and non-thermal pressure fraction for the cooler phase are subject to the same systematic uncertainties as the velocity dispersion measurements. These quantities were presented to provide context and potential benchmarks for simulations, but we acknowledge that they should not be regarded as definitive constraints at this stage. In the revised manuscript, we will modify the discussion section to more strongly emphasize the limitations due to systematics and clarify that these values are preliminary, pending further validation of the cooler component detection. We will also update the abstract if necessary to reflect this caution. revision: yes
Circularity Check
Direct observational spectral analysis exhibits no circularity
full rationale
The paper performs model fitting directly to XRISM Resolve spectra to derive temperature profiles, velocity dispersions, and evidence for a multi-phase inner gas component. The cooler ~1.87-2.43 keV phase is identified via residual broad wings on S Lyα and Fe Heα lines after single-temperature modeling, with all reported ranges and Mach numbers incorporating explicit systematic uncertainties from spatial-spectral mixing, central point-source subtraction, and gain variations. No derivation step reduces by construction to its own inputs; the cited consistency with arXiv:2509.04421 is a non-load-bearing external check, and the central claims rest on the new data rather than self-citation chains or ansatzes. The analysis is self-contained against external benchmarks such as Chandra and XMM measurements.
Axiom & Free-Parameter Ledger
free parameters (2)
- cooler gas temperature
- cooler gas velocity dispersion
axioms (1)
- domain assumption X-ray emission lines from multi-temperature plasma can be decomposed into distinct components using current atomic databases and response matrices
Reference graph
Works this paper leans on
-
[1]
Allen, S. W., Ettori, S., & Fabian, A. C. 2001, MNRAS, 324, 877, doi: 10.1046/j.1365-8711.2001.04318.x
-
[2]
Arnaud, K. A. 1996, in Astronomical Society of the Pacific Conference Series, Vol. 101, Astronomical Data Analysis Software and Systems V, ed. G. H. Jacoby & J. Barnes, 17
1996
-
[3]
Cash, W. 1979, ApJ, 228, 939, doi: 10.1086/156922
-
[4]
2001, ApJ, 554, 261, doi: 10.1086/321357
Forman, W. 2001, ApJ, 554, 261, doi: 10.1086/321357
-
[5]
Churazov, E., Forman, W., Jones, C., & B¨ ohringer, H. 2003, The Astrophysical Journal, 590, 225, doi: 10.1086/374923
-
[6]
Fabian, A. C., Johnstone, R. M., Sanders, J. S., et al. 2008, Nature, 454, 968, doi: 10.1038/nature07169
-
[7]
2003, MNRAS, 339, 937, doi: 10.1046/j.1365-8711.2003.06241.x G¨ otberg, Y., de Mink, S
Fabian, A. C., Sanders, J. S., Allen, S. W., et al. 2003, MNRAS, 344, L43, doi: 10.1046/j.1365-8711.2003.06902.x
-
[8]
Fabian, A. C., Sanders, J. S., Taylor, G. B., et al. 2006, MNRAS, 366, 417, doi: 10.1111/j.1365-2966.2005.09896.x
-
[9]
Fabian, A. C., Sanders, J. S., Ettori, S., et al. 2000, MNRAS, 318, L65, doi: 10.1046/j.1365-8711.2000.03904.x
-
[10]
2012, MNRAS, 420, 1825, doi: 10.1111/j.1365-2966.2011.19805.x
Fabian, A. C., Sanders, J. S., Allen, S. W., et al. 2011, MNRAS, 418, 2154, doi: 10.1111/j.1365-2966.2011.19402.x
-
[11]
arXiv , author =:1207.0576 , journal =
Foster, A. R., Ji, L., Smith, R. K., & Brickhouse, N. S. 2012, The Astrophysical Journal, 756, 128, doi: 10.1088/0004-637X/756/2/128
-
[12]
Fruscione, A., McDowell, J. C., Allen, G. E., et al. 2006, in Society of Photo-Optical Instrumentation Engineers (SPIE) Conference Series, Vol. 6270, Observatory Operations: Strategies, Processes, and Systems, ed. D. R. Silva & R. E. Doxsey, 62701V, doi: 10.1117/12.671760
-
[13]
2025, arXiv e-prints, arXiv:2507.00126, doi: 10.48550/arXiv.2507.00126
Kondo, M. 2025, arXiv e-prints, arXiv:2507.00126, doi: 10.48550/arXiv.2507.00126
-
[14]
Gendron-Marsolais, M., Hlavacek-Larrondo, J., Martin, T. B., et al. 2018, MNRAS, 479, L28, doi: 10.1093/mnrasl/sly084
-
[15]
Harris, C. R., Millman, K. J., van der Walt, S. J., et al. 2020, Nature, 585, 357, doi: 10.1038/s41586-020-2649-2 Hitomi Collaboration, Aharonian, F., Akamatsu, H., et al. 2016, Nature, 535, 117, doi: 10.1038/nature18627 Hitomi Collaboration, Aharonian, F., Akamatsu, H., et al. 2018a, Publications of the Astronomical Society of Japan, 70, 11, doi: 10.1093...
-
[16]
Hogan, M. T., McNamara, B. R., Pulido, F., et al. 2017, ApJ, 837, 51, doi: 10.3847/1538-4357/aa5f56
-
[17]
Hunter, J. D. 2007, Computing in Science & Engineering, 9, 90, doi: 10.1109/MCSE.2007.55
-
[18]
Kirkpatrick, C. C., McNamara, B. R., & Cavagnolo, K. W. 2011, ApJL, 731, L23, doi: 10.1088/2041-8205/731/2/L23
-
[19]
Lodders, K., Palme, H., & Gail, H. P. 2009, Landolt B¨ ornstein, 4B, 712, doi: 10.1007/978-3-540-88055-434
-
[20]
2025, arXiv e-prints, arXiv:2512.10167, doi: 10.48550/arXiv.2512.10167
Majumder, A., Heckman, T., Meunier, J., et al. 2025, arXiv e-prints, arXiv:2512.10167, doi: 10.48550/arXiv.2512.10167 19
-
[21]
McNamara, B. R., & Nulsen, P. E. J. 2007, ARA&A, 45, 117, doi: 10.1146/annurev.astro.45.051806.110625 —. 2012, New Journal of Physics, 14, 055023, doi: 10.1088/1367-2630/14/5/055023
-
[22]
Porter, F. S., Kilbourne, C. A., Chiao, M. P., et al. 2025, Journal of Astronomical Telescopes, Instruments, and Systems, 11, 042016, doi: 10.1117/1.JATIS.11.4.042016
-
[23]
L., Hlavacek-Larrondo, J., Gendron-Marsolais, M.-L., et al
Rhea, C. L., Hlavacek-Larrondo, J., Gendron-Marsolais, M.-L., et al. 2025, AJ, 169, 203, doi: 10.3847/1538-3881/adb732
-
[24]
Rose, T., McNamara, B. R., Meunier, J., et al. 2025, arXiv e-prints, arXiv:2505.01494, doi: 10.48550/arXiv.2505.01494
-
[25]
2007, MNRAS, 378, 910, doi: 10.1111/j.1365-2966.2007.11817.x
Sanders, J. S., & Fabian, A. C. 2007, MNRAS, 381, 1381, doi: 10.1111/j.1365-2966.2007.12347.x
-
[26]
2012, ApJ, 757, 182, doi: 10.1088/0004-637X/757/2/182
Simionescu, A., Werner, N., Urban, O., et al. 2012, ApJ, 757, 182, doi: 10.1088/0004-637X/757/2/182
-
[27]
Simionescu, A., Kilbourne, C., Russell, H. R., et al. 2026, arXiv e-prints, arXiv:2601.16901, doi: 10.48550/arXiv.2601.16901
-
[28]
Sutherland, R. S., & Dopita, M. A. 1993, ApJS, 88, 253, doi: 10.1086/191823
-
[29]
2017, MNRAS, 468, 3516, doi: 10.1093/mnras/stx590
Tang, X., & Churazov, E. 2017, MNRAS, 468, 3516, doi: 10.1093/mnras/stx590 The Astropy Collaboration, Robitaille, Thomas P.,
-
[30]
Tollerud, Erik J., et al. 2013, A&A, 558, A33, doi: 10.1051/0004-6361/201322068 van der Walt, S., Colbert, S. C., & Varoquaux, G. 2011, Comput. Sci. Eng., 13, 22, doi: 10.1109/MCSE.2011.37 Van Rossum, G., & Drake, F. L. 2009, Python 3 Reference Manual (Scotts Valley, CA: CreateSpace)
-
[31]
Voit, G. M., & Donahue, M. 2005, ApJ, 634, 955, doi: 10.1086/497063
-
[32]
On the Absorption of X-rays in the Interstellar Medium
Wilms, J., Allen, A., & McCray, R. 2000, ApJ, 542, 914, doi: 10.1086/317016 XRISM Collaboration, Audard, M., Awaki, H., et al. 2025a, arXiv e-prints, arXiv:2509.04421, doi: 10.48550/arXiv.2509.04421 —. 2025b, ApJL, 982, L5, doi: 10.3847/2041-8213/ada7cd —. 2025c, Nature, 638, 365, doi: 10.1038/s41586-024-08561-z —. 2025d, arXiv e-prints, arXiv:2504.20928....
-
[33]
2022, MNRAS, 517, 616, doi: 10.1093/mnras/stac2282 Zhoolideh Haghighi, M
Zhang, C., Zhuravleva, I., Gendron-Marsolais, M.-L., et al. 2022, Monthly Notices of the Royal Astronomical Society, 517, 616, doi: 10.1093/mnras/stac2282
-
[34]
Zhuravleva, I., Churazov, E., Schekochihin, A. A., et al. 2014, Nature, 515, 85, doi: 10.1038/nature13830
-
[35]
ZuHone, J. A., Markevitch, M., & Lee, D. 2011, ApJ, 743, 16, doi: 10.1088/0004-637X/743/1/16
-
[36]
ZuHone, J. A., Miller, E. D., Simionescu, A., & Bautz, M. W. 2016, ApJ, 821, 6, doi: 10.3847/0004-637X/821/1/6
discussion (0)
Sign in with ORCID, Apple, or X to comment. Anyone can read and Pith papers without signing in.