Recognition: unknown
A Dynamic Learning Observatory Reveals the Rapid Salinization of Satkhira, Bangladesh
Pith reviewed 2026-05-08 07:00 UTC · model grok-4.3
The pith
Machine learning on field samples and Landsat data maps expanding soil salinity across Satkhira, Bangladesh.
A machine-rendered reading of the paper's core claim, the machinery that carries it, and where it could break.
Core claim
Integrating 205 field observations with Landsat-derived vegetation and salinity indices through an XGBoost model refined by a generalized additive model yields maps that reveal recurrent high-salinity zones and a persistent, expanding footprint of moderate-to-high salinity exposure in central Satkhira between 2014 and 2023.
What carries the argument
An XGBoost regression model trained on 205 field samples and Landsat spectral indices, improved by a generalized additive model, with spatial cross-validation and bootstrap uncertainty estimation.
Load-bearing premise
The learned statistical relationship between the selected Landsat spectral indices and measured soil salinity remains stable across years, seasons, and locations beyond the 205 sampled points.
What would settle it
New soil salinity measurements collected in 2026 from previously unsampled sites in Satkhira that fall systematically outside the model's bootstrap uncertainty ranges would falsify the stability of the spectral-to-salinity relationship.
Figures


read the original abstract
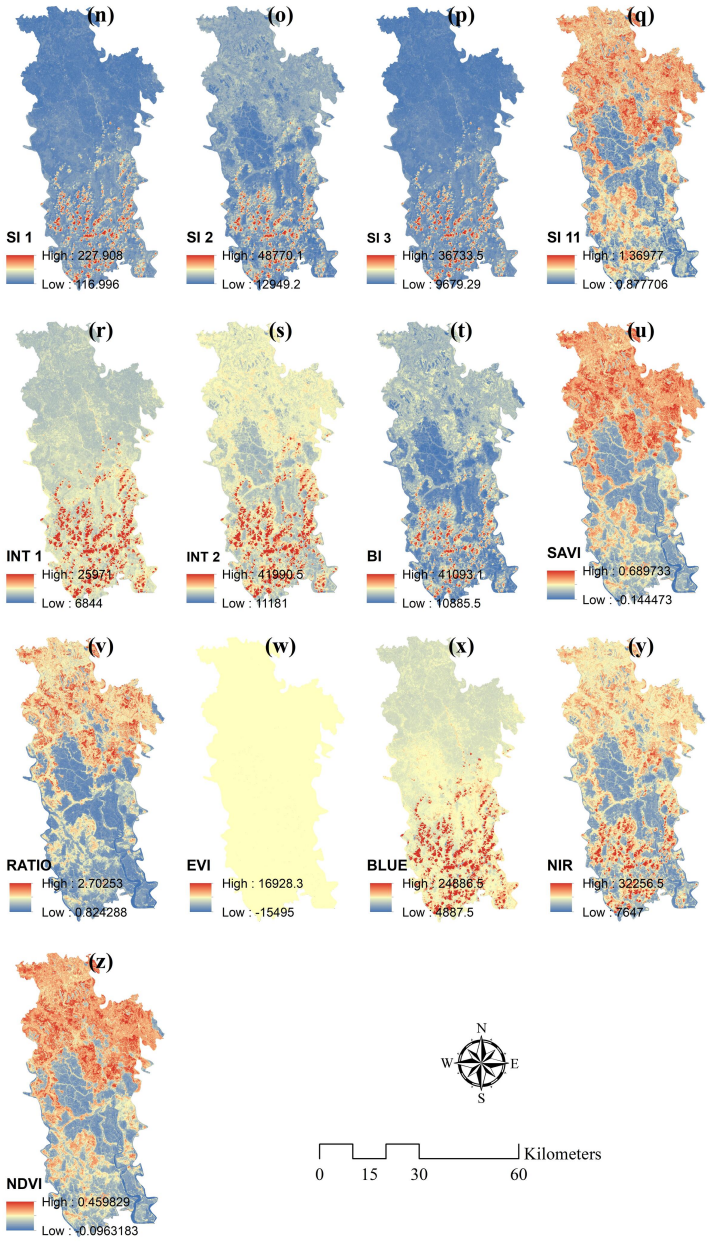
Soil salinity is a major environmental challenge in coastal Bangladesh, threatening agricultural productivity and local livelihoods. This study develops a machine-learning-based framework to predict and map soil salinity in Satkhira district by integrating field observations with Landsat-derived spectral indices. A total of 205 soil samples collected during 2024-2025 were used to train an Extreme Gradient Boosting (XGBoost) model, and predictions were further improved using a Generalized Additive Model (GAM). Spatial cross-validation was applied to reduce autocorrelation bias, and bootstrap resampling was used to quantify prediction uncertainty. The results show strong spatial variability of soil salinity, with higher concentrations in the southern and central coastal regions and lower levels in the northern inland areas. Vegetation indices, particularly NDVI, along with salinity-related spectral indicators, were identified as key predictors. 10-year-window peak-exposure maps generated for 2014-2023 reveal recurrent high-salinity zones and a persistent, expanding footprint of moderate-to-high salinity exposure across the central parts of the district. Uncertainty analysis indicates higher variability in coastal zones and improved prediction stability when multi-year datasets are combined. The proposed framework provides a robust and scalable approach for long-term monitoring of soil salinity. It supports climate-resilient agriculture, land-use planning, and evidence-based decision-making in coastal Bangladesh.
Editorial analysis
A structured set of objections, weighed in public.
Referee Report
Summary. The paper develops a machine-learning framework integrating 205 field soil samples (2024-2025) with Landsat spectral indices to train an XGBoost model refined by a GAM for predicting soil salinity in Satkhira district, Bangladesh. Spatial cross-validation and bootstrap resampling quantify uncertainty and reduce autocorrelation bias. The model is applied to generate 10-year peak-exposure maps (2014-2023) that identify recurrent high-salinity zones, a persistent expanding footprint of moderate-to-high salinity in central areas, and higher uncertainty in coastal zones. The framework is presented as a robust, scalable tool for long-term monitoring supporting climate-resilient agriculture and land-use planning.
Significance. If the spectral-salinity relationship holds over time, the integration of field data with multi-year Landsat imagery and the use of spatial cross-validation plus bootstrap uncertainty quantification would provide a practical, reproducible approach for monitoring salinization in data-sparse coastal regions. The emphasis on NDVI and salinity indices as key predictors aligns with established remote-sensing practices and could inform evidence-based decisions if temporal stability is demonstrated.
major comments (1)
- [the section describing the 10-year-window peak-exposure maps] The central claim of a 'persistent, expanding footprint' of salinity and 'rapid salinization' over 2014-2023 rests on applying the XGBoost+GAM model trained solely on 2024-2025 field samples to earlier Landsat indices without temporal hold-out validation, multi-year ground-truth comparison, or explicit test for non-stationarity (e.g., due to vegetation changes, land-use shifts, or tidal regime variations). This assumption is load-bearing for the long-term monitoring conclusion yet is not addressed in the temporal mapping description.
minor comments (2)
- [Abstract] The abstract states 'strong spatial variability' and 'improved prediction stability' but provides no quantitative metrics (e.g., R², RMSE, or cross-validation scores) to support these descriptions; including such values would strengthen the results summary.
- [the uncertainty analysis section] The manuscript mentions 'multi-year datasets are combined' for improved stability but does not specify how the 10-year maps aggregate annual predictions or handle inter-annual variability in Landsat data quality.
Simulated Author's Rebuttal
We thank the referee for the constructive feedback and positive evaluation of the framework's potential. We address the major comment on the temporal mapping below, offering clarification on our assumptions while proposing targeted revisions to improve transparency.
read point-by-point responses
-
Referee: The central claim of a 'persistent, expanding footprint' of salinity and 'rapid salinization' over 2014-2023 rests on applying the XGBoost+GAM model trained solely on 2024-2025 field samples to earlier Landsat indices without temporal hold-out validation, multi-year ground-truth comparison, or explicit test for non-stationarity (e.g., due to vegetation changes, land-use shifts, or tidal regime variations). This assumption is load-bearing for the long-term monitoring conclusion yet is not addressed in the temporal mapping description.
Authors: We agree that direct temporal validation would strengthen the claims and that the current manuscript does not explicitly discuss non-stationarity risks in the temporal mapping section. Our approach relies on the physical basis of the selected spectral indices (NDVI and salinity indices), which are tied to soil reflectance and vegetation response properties that are expected to be relatively stable over a decade in this region. Spatial cross-validation and bootstrap uncertainty quantification were used to assess robustness within the available data, but these do not substitute for temporal checks. We cannot provide multi-year ground-truth comparisons because no such historical field samples exist in our dataset. In revision, we will add a new subsection in the Methods and a dedicated paragraph in the Discussion explicitly stating the temporal extrapolation assumption, listing potential sources of non-stationarity (land-use, tidal, vegetation), and qualifying the 'expanding footprint' language as model-inferred rather than directly observed. We will also include a forward-looking statement on the value of future repeated field campaigns for validation. revision: partial
Circularity Check
No circularity; standard ML training on independent field samples with extrapolation to historical imagery
full rationale
The paper trains an XGBoost model (followed by GAM refinement) on 205 field-collected soil salinity samples from 2024-2025, applies spatial cross-validation and bootstrap resampling, then uses the fitted model to generate maps from Landsat spectral indices for 2014-2023. This is a conventional supervised prediction pipeline in which the historical outputs are not equivalent to the training inputs by construction, nor are any parameters defined in terms of the target quantities. No self-definitional steps, fitted-input-as-prediction reductions, or load-bearing self-citations appear in the derivation chain. The framework remains self-contained against external benchmarks (field data) and does not reduce the central claims to tautology.
Axiom & Free-Parameter Ledger
free parameters (2)
- XGBoost hyperparameters
- GAM smoothing parameters
axioms (2)
- domain assumption Landsat spectral indices are linearly or monotonically related to soil salinity after atmospheric correction
- domain assumption Spatial cross-validation fully removes autocorrelation bias in the 205-point dataset
Reference graph
Works this paper leans on
-
[1]
S. H. Akash, S. K. Sarkar, A. A. Bindajam, R. Kumari, S. Talukdar, and J. Mallick. “Assess- ment of coastal vulnerability using integrated fuzzy analytical hierarchy process and geospa- tial technology for effective coastal management”. In:Environmental Science and Pollution Research(2023).doi:10.1007/s11356-023-28317-y. 14
-
[2]
Current and Future Salinity Intrusion in the South-Western Coastal Region of Bangladesh
M. Ashrafuzzaman, C. Artemi, F. D. Santos, and L. Schmidt. “Current and Future Salinity Intrusion in the South-Western Coastal Region of Bangladesh”. In:Spanish Journal of Soil Science12 (2022), pp. 1–20.doi:10.3389/sjss.2022.10017
-
[3]
2024.url:https://bbs.portal.gov.bd
Bangladesh Bureau of Statistics.Population and Housing Census 2022: National Report (Vol- ume I). 2024.url:https://bbs.portal.gov.bd
2022
-
[4]
Spatio-temporal variability in soil and water salinity in the south-central coast of Bangladesh
M. I. Bhuyan, S. Mia, I. Supit, and F. Ludwig. “Spatio-temporal variability in soil and water salinity in the south-central coast of Bangladesh”. In:Catena222 (2023), p. 106786.doi: 10.1016/j.catena.2022.106786
-
[5]
Soil salinity: A threat to global food security
K. Butcher, A. F. Wick, T. Desutter, A. Chatterjee, and J. Harmon. “Soil salinity: A threat to global food security”. In:Agronomy Journal108.6 (2016), pp. 2189–2200.doi:10.2134/ agronj2016.06.0368
2016
-
[6]
Climate Change-induced Salinity Intrusion and Livelihood Nexus
T. C. Fahim and S. Arefin. “Climate Change-induced Salinity Intrusion and Livelihood Nexus”. In:International Journal of Rural Management(2023).doi:10.1177/09730052231176915
-
[7]
2021.url:https://hal
FAO.Standard operating procedure for soil electrical conductivity. 2021.url:https://hal. archives-ouvertes.fr/hal-03159848/
2021
-
[8]
Coping strategy for rice farming in Aila affected South-West region of Bangladesh
P. K. Haldar, S. K. Saha, M. F. Ahmed, and S. N. Islam. “Coping strategy for rice farming in Aila affected South-West region of Bangladesh”. In:Journal of Science Technology and Environment Informatics4.2 (2017), pp. 313–326.doi:10.18801/jstei.040217.34
-
[9]
Soil salinity hazard assessment in Bangladesh coastal zone
M. H. Hasan, M. R. Rahman, and A. Haque. “Soil salinity hazard assessment in Bangladesh coastal zone”. In:Risk Management(2019)
2019
-
[10]
Impact of soil salinity on livelihood strategies
M. Z. Hossain, M. Z. Haider, and B. R. Mojumder. “Impact of soil salinity on livelihood strategies”. In:SESB(2010), pp. 43–48
2010
-
[11]
Remote sensing monitoring of changes in soil salinity
W. Jingwei, B. Vincent, Y. Jinzhong, S. Bouarfa, and A. Vidal. “Remote sensing monitoring of changes in soil salinity”. In:Sensors8.11 (2008), pp. 7035–7049.doi:10.3390/s8117035
-
[12]
Salinity level analysis of coastal soil at Satkhira District
T. I. Khan, S. Biswas, and C. M. Mehrun. “Salinity level analysis of coastal soil at Satkhira District”. In:Journal8.4 (2020), pp. 1006–1017
2020
-
[13]
Seasonal study on soil salinity and its relation to other proper- ties
U. Kumar and J. R. Mitra. “Seasonal study on soil salinity and its relation to other proper- ties”. In:Journal(2019).doi:10.3329/pa.v30i2.42488
-
[14]
Soil salinity detection from satellite image analysis
M. M. Morshed, M. T. Islam, and R. Jamil. “Soil salinity detection from satellite image analysis”. In:Environmental Monitoring and Assessment188 (2016).doi:10.1007/s10661- 015-5045-x
-
[15]
Application of remote sensing for salinity-based coastal land use zoning
M. M. Morshed, S. K. Sarkar, M. R. U. Zzaman, and M. M. Islam. “Application of remote sensing for salinity-based coastal land use zoning”. In:Spatial Information Research29.3 (2021), pp. 353–364.doi:10.1007/s41324-020-00357-3
-
[16]
K. Negacz, ˇZ. Malek, A. de Vos, and P. Vellinga. “Saline soils worldwide”. In:Journal of Arid Environments203 (2022).doi:10.1016/j.jaridenv.2022.104775. 15
-
[17]
Impact of salinity in Satkhira
U. Rezoyana, M. K. Tusar, and M. A. Islam. “Impact of salinity in Satkhira”. In:Open Journal of Social Sciences11.5 (2023), pp. 288–305.doi:10.4236/jss.2023.115020
-
[18]
S. K. Sarkar, M. Haydar, T. Mazumder, S. M. Sany, T. Al Noor, S. Ahmed, N. R. Utsho, and S. Ravela.A Topsoil Salinity Observatory for Arable Lands in Coastal Southwest Bangladesh (2025). [data set]. 2026.doi:10.5281/zenodo.19711551.url:https://doi.org/10.5281/ zenodo.19711551
work page doi:10.5281/zenodo.19711551.url:https://doi.org/10.5281/ 2025
-
[19]
S. K. Sarkar, M. Haydar, R. R. Rudra, T. Mazumder, M. S. Nur, M. S. Islam, S. M. Sany, T. Al Noor, S. Ahmed, M. Ahmad, A. Sakib, and S. Ravela.A Topsoil Salinity Observatory for Arable Lands in Coastal Southwest Bangladesh. [data set]. 2024.doi:10.5281/zenodo. 14560019.url:https://doi.org/10.5281/zenodo.14560019
-
[20]
Simulation-based mod- eling of urban waterlogging in Khulna city
S. K. Sarkar, M. A. Rahman, M. Esraz-Ul-zannat, and M. F. Islam. “Simulation-based mod- eling of urban waterlogging in Khulna city”. In:Journal of Water and Climate Change12.2 (2021), pp. 566–579.doi:10.2166/wcc.2020.256
-
[21]
Partial least-squares regression for soil salinity mapping
S. K. Sarkar, R. R. Rudra, M. S. Nur, and P. C. Das. “Partial least-squares regression for soil salinity mapping”. In:Ecological Indicators154 (2023).doi:10.1016/j.ecolind.2023. 110825
-
[22]
Estimating the intrinsic dimension of datasets by a minimal neighborhood information
S. K. Sarkar, R. R. Rudra, A. R. Sohan, et al. “Coupling of machine learning and remote sensing for soil salinity mapping”. In:Scientific Reports13 (2023).doi:10.1038/s41598- 023-44132-4
-
[23]
Showmitra Kumar Sarkar, Mafrid Haydar, Rhyme Rubayet Rudra, Tanmoy Mazumder, Md. Sadmin Nur, Md. Shahriar Islam, Shakib Mohammad Sany, Tanzim Al Noor, Myisha Ah- mad, Annajmus Sakib, and Sai Ravela. “A Topsoil Salinity Observatory for Arable Lands in Coastal Southwest Bangladesh”. In:Scientific Data12 (2025), p. 1204.doi:10.1038/s41597- 025-05447-1.url:ht...
-
[24]
Should shrimp farmers pay paddy farmers?
L. Umamaheswari, K. O. Hattab, P. Nasurudeen, and P. Selvaraj. “Should shrimp farmers pay paddy farmers?” In:Environmental Valuation in South Asia. 2009, pp. 79–98.doi:10. 1017/CBO9780511843938.005
2009
-
[25]
Cropland soil salinization and associated hydrology
N. Uri. “Cropland soil salinization and associated hydrology”. In:Water10.8 (2018).doi: 10.3390/w10081030
-
[26]
Salinity and crop yield
C. Zeorb et al. “Salinity and crop yield”. In:Plant Biology21 (2019), pp. 31–38.doi:10. 1111/plb.12884. 16 Figure 1: Location of the study area17 Figure 2: Modeling framework of soil salinity mapping 18 Figure 3: Spatial distribution of soil salinity (EC, mS/cm) samples in Satkhira District 19 Figure 4: Spatial distribution of Landsat-derived soil salinit...
2019
discussion (0)
Sign in with ORCID, Apple, or X to comment. Anyone can read and Pith papers without signing in.