Recognition: unknown
Proteus: Shapeshifting Desktop Visualizations for Mobile via Multi-level Intelligent Adaptation
Pith reviewed 2026-05-08 07:30 UTC · model grok-4.3
The pith
Proteus uses LLM agents and a multi-level design space to automatically convert desktop visualizations into equivalent mobile versions.
A machine-rendered reading of the paper's core claim, the machinery that carries it, and where it could break.
Core claim
The paper claims that categorizing adaptation operations into a multi-level design space enables an LLM-driven multi-agent system to parse desktop visualizations, select optimal strategies, and produce equivalent mobile versions that preserve information and improve readability over simple scaling.
What carries the argument
A multi-level design space with evolution rules at global topology, reference frame, and visual elements levels, executed by an LLM multi-agent system that parses input charts and applies predicted transformations.
If this is right
- Existing desktop visualizations become usable on mobile without manual recreation or significant information loss.
- Visualization authors can focus on desktop designs while still reaching mobile audiences through automated conversion.
- The multi-agent system scales to many chart types by predicting strategies within the defined design space.
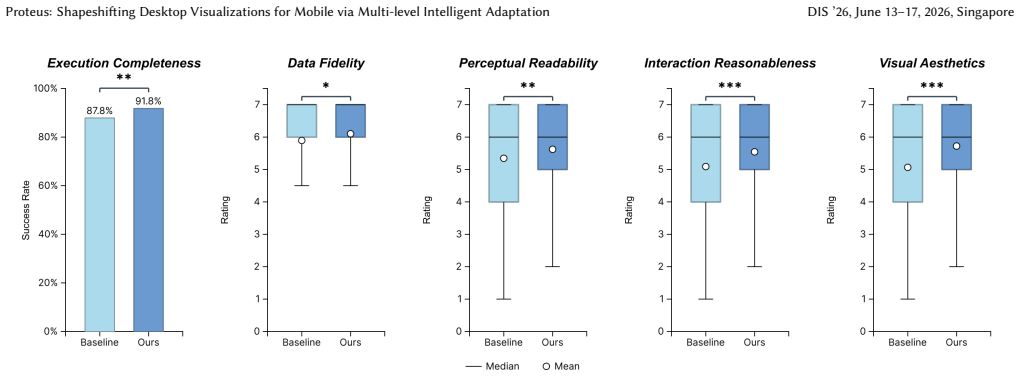
- User studies confirm higher perceived usability compared to direct scaling approaches.
Where Pith is reading between the lines
- Tools that generate visualizations could incorporate the design space from the start to make mobile adaptation automatic.
- The method might extend to other device form factors like tablets or wearables by adding levels to the space.
- If agents sometimes err, hybrid human-in-the-loop checks could catch issues before final output.
Load-bearing premise
The design space covers every necessary adaptation and the LLM agents reliably select transformations that preserve equivalence and readability without errors or data loss.
What would settle it
User testing where Proteus outputs are rated lower in readability or information accuracy than manually scaled desktop charts, or where agents produce inconsistent transformations across repeated runs on the same input.
Figures


read the original abstract
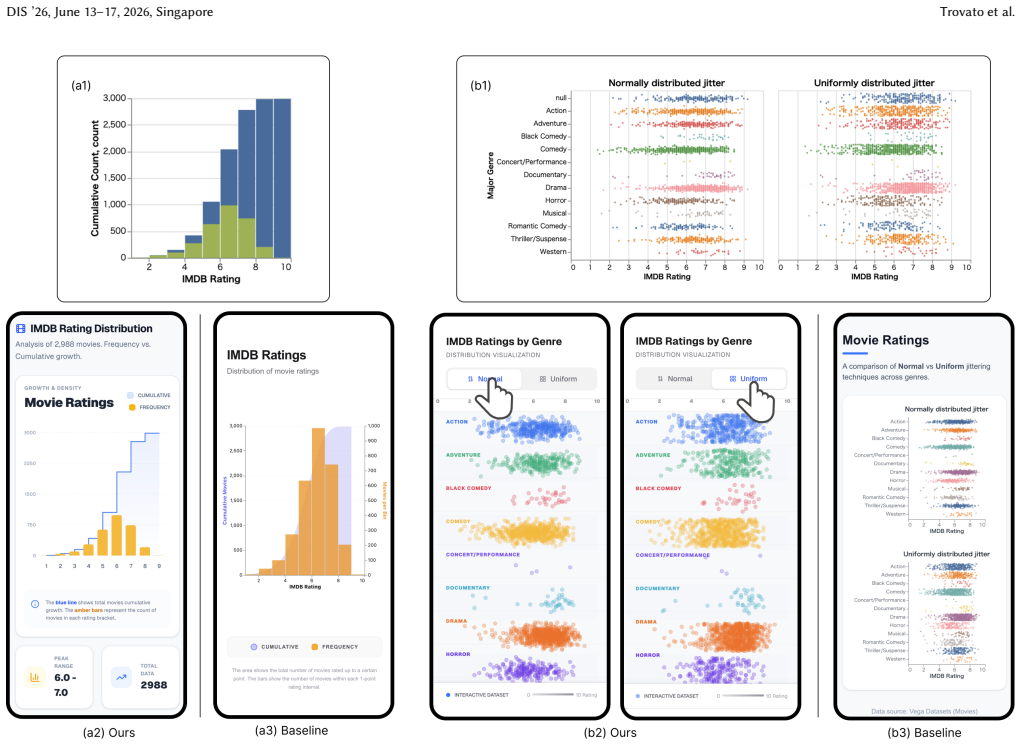
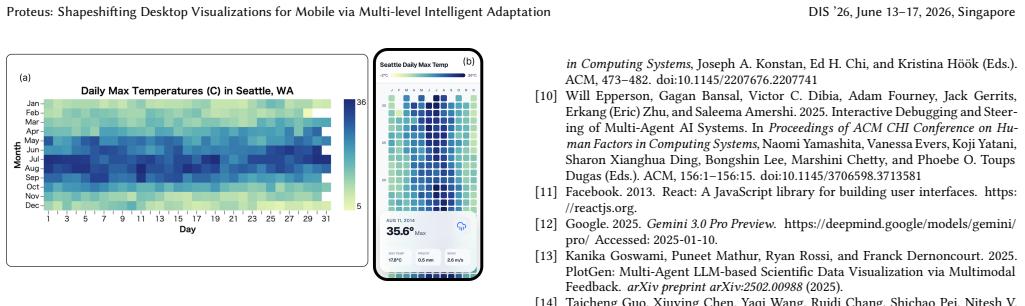
With the rise of mobile-first consumption, users increasingly engage with data visualizations on mobile devices. However, the vast majority of existing visualizations are originally authored for desktop environments. Due to significant differences in viewport size and interaction paradigms, directly scaling desktop charts often results in illegible text, information loss, and interaction failures. To bridge this gap, we propose an automated framework to adapt desktop-based visualizations for mobile screens. By systematically categorizing the operations involved in the adaptation process, we establish a multi-level design space. This space defines evolution rules spanning from the global topology level, through the reference frame level, down to the visual elements level. Guided by this theoretical framework, we developed Proteus, a large language model-driven multi-agent system that automatically parses online visualizations, predicts optimal transformation strategies within the design space, and generates equivalent, highly readable visualizations for mobile devices. Case studies and an in-depth user study with 12 participants demonstrate the effectiveness and usability of Proteus.
Editorial analysis
A structured set of objections, weighed in public.
Referee Report
Summary. The paper introduces a multi-level design space for adapting desktop visualizations to mobile (spanning global topology, reference frame, and visual elements levels) and presents Proteus, an LLM-driven multi-agent system that parses online visualizations, selects transformations within this space, and generates equivalent mobile versions. Effectiveness is supported by case studies and a 12-participant user study claiming high usability and readability.
Significance. If the transformations reliably preserve data equivalence and improve readability without manual intervention, this could meaningfully advance mobile-first visualization consumption by automating a common pain point. The structured design space offers a reusable framework for future adaptation systems, and the LLM multi-agent approach aligns with current trends in intelligent interfaces.
major comments (3)
- [User Study] User study section: the 12-participant evaluation reports only perceived usability without quantitative measures of information fidelity (e.g., data-value accuracy rates, task error counts, or comparison against expert manual adaptations or direct scaling baselines), leaving the central claims of 'equivalent' and 'highly readable' visualizations unverified.
- [Multi-level Design Space] Design space and framework section: no completeness argument, coverage analysis, or enumeration of edge cases (dense scatterplots, nested charts, non-standard encodings) is provided for the three-level space, yet the central claim that Proteus produces complete and equivalence-preserving transformations depends on this coverage.
- [Proteus System] Proteus system description: the multi-agent pipeline lacks any automated verification step, error analysis, or robustness testing for LLM parsing failures and transformation selection; without this, the reliability of the 'predicts optimal transformation strategies' step remains untested.
minor comments (2)
- [Abstract] Abstract and introduction use 'highly readable' and 'equivalent' without defining the criteria or metrics used to assess these properties.
- [Case Studies] Case studies would benefit from side-by-side before/after figures with explicit annotations of changes at each design-space level.
Simulated Author's Rebuttal
We thank the referee for the constructive feedback on our manuscript. We address each major comment below, indicating the revisions we will incorporate to strengthen the evaluation, framework, and system sections.
read point-by-point responses
-
Referee: [User Study] User study section: the 12-participant evaluation reports only perceived usability without quantitative measures of information fidelity (e.g., data-value accuracy rates, task error counts, or comparison against expert manual adaptations or direct scaling baselines), leaving the central claims of 'equivalent' and 'highly readable' visualizations unverified.
Authors: We agree that the reported user study emphasizes subjective ratings of usability and readability. The case studies offer qualitative support for equivalence in selected examples, but quantitative verification is limited. In the revision, we will expand the evaluation to include quantitative metrics such as data-value accuracy rates and task error counts from controlled reading tasks, plus direct comparisons against scaling baselines and expert manual adaptations where feasible. revision: yes
-
Referee: [Multi-level Design Space] Design space and framework section: no completeness argument, coverage analysis, or enumeration of edge cases (dense scatterplots, nested charts, non-standard encodings) is provided for the three-level space, yet the central claim that Proteus produces complete and equivalence-preserving transformations depends on this coverage.
Authors: The multi-level design space was derived from a systematic categorization of adaptation operations across global topology, reference frame, and visual elements. We acknowledge the absence of an explicit completeness argument or edge-case enumeration in the submitted version. The revision will add a subsection providing coverage analysis, including discussion of edge cases such as dense scatterplots, nested charts, and non-standard encodings, to better substantiate the claim of complete, equivalence-preserving transformations. revision: yes
-
Referee: [Proteus System] Proteus system description: the multi-agent pipeline lacks any automated verification step, error analysis, or robustness testing for LLM parsing failures and transformation selection; without this, the reliability of the 'predicts optimal transformation strategies' step remains untested.
Authors: We recognize that the system description does not detail verification or robustness measures. The multi-agent pipeline relies on LLM-driven parsing and strategy selection, with internal testing performed but not reported. The revised manuscript will include an error analysis subsection reporting observed rates of parsing failures and transformation selection issues, along with any robustness steps taken during development. revision: yes
Circularity Check
No circularity: framework definition and system implementation remain independent
full rationale
The paper defines its multi-level design space by categorizing adaptation operations (global topology, reference frame, visual elements) and then builds Proteus as an LLM multi-agent system that applies rules from that space. No equations, fitted parameters presented as predictions, self-citation load-bearing uniqueness claims, or ansatzes smuggled via prior work appear in the provided text. The central claims rest on the explicit categorization step plus empirical case studies and a 12-participant user study rather than reducing to self-referential inputs by construction.
Axiom & Free-Parameter Ledger
Reference graph
Works this paper leans on
-
[1]
Altair Developers. 2026. Altair Example Gallery . https://altair-viz.github.io/ gallery/index.html Accessed: 2026-01-20
2026
-
[2]
Bennett, Kori Inkpen, Jaime Teevan, Ruth Kikin-Gil, and Eric Horvitz
Saleema Amershi, Daniel S. Weld, Mihaela Vorvoreanu, Adam Fourney, Besmira Nushi, Penny Collisson, Jina Suh, Shamsi T. Iqbal, Paul N. Bennett, Kori Inkpen, Jaime Teevan, Ruth Kikin-Gil, and Eric Horvitz. 2019. Guidelines for Human-AI Interaction. In Proceedings of ACM CHI Conference on Human Factors in Com- puting Systems , Stephen A. Brewster, Geraldine ...
-
[3]
Keith Andrews, David Egger, and Peter Oberrauner. 2023. RespVis: A D3 Exten- sion for Responsive SVG Charts. In 2023 27th International Conference Informa- tion Visualisation (IV) . IEEE, 19–22
2023
-
[4]
Benjamin B Bederson. 2000. Fisheye menus. Proceedings of the 13th annual ACM symposium on User interface software and technology (2000), 217–225
2000
-
[5]
Bond and Les Gasser (Eds.)
Alan H. Bond and Les Gasser (Eds.). 1988. Readings in Distributed Artificial Intel- ligence. Morgan Kaufmann, San Mateo, CA
1988
-
[6]
D3.js Community. 2026. D3.js Gallery and Examples. https://d3js.org/ Accessed: 2026-01-20
2026
-
[7]
Haas, Srinivasan Parthasarathy, and Tejaswini Peda- pati
Çagatay Demiralp, Peter J. Haas, Srinivasan Parthasarathy, and Tejaswini Peda- pati. 2017. Foresight: Recommending Visual Insights. Proc. VLDB Endow. 10, 12 (2017), 1937–1940. doi:10.14778/3137765.3137813
-
[8]
Victor Dibia and Çagatay Demiralp. 2019. Data2Vis: Automatic Generation of Data Visualizations Using Sequence-to-Sequence Recurrent Neural Networks. IEEE Computer Graphics and Applications 39, 5 (2019), 33–46. doi:10.1109/MCG. 2019.2924636
work page doi:10.1109/mcg 2019
-
[9]
Alex Endert, Patrick Fiaux, and Chris North. 2012. Semantic interaction for visual text analytics. In Proceedings of ACM CHI Conference on Human Factors in Computing Systems , Joseph A. Konstan, Ed H. Chi, and Kristina Höök (Eds.). ACM, 473–482. doi:10.1145/2207676.2207741
-
[10]
Dibia, Adam Fourney, Jack Gerrits, Erkang (Eric) Zhu, and Saleema Amershi
Will Epperson, Gagan Bansal, Victor C. Dibia, Adam Fourney, Jack Gerrits, Erkang (Eric) Zhu, and Saleema Amershi. 2025. Interactive Debugging and Steer- ing of Multi-Agent AI Systems. In Proceedings of ACM CHI Conference on Hu- man Factors in Computing Systems, Naomi Yamashita, Vanessa Evers, Koji Yatani, Sharon Xianghua Ding, Bongshin Lee, Marshini Chett...
-
[11]
Facebook. 2013. React: A JavaScript library for building user interfaces. https: //reactjs.org
2013
-
[12]
Google. 2025. Gemini 3.0 Pro Preview. https://deepmind.google/models/gemini/ pro/ Accessed: 2025-01-10
2025
- [13]
-
[14]
Chawla, Olaf Wiest, and Xiangliang Zhang
Taicheng Guo, Xiuying Chen, Yaqi Wang, Ruidi Chang, Shichao Pei, Nitesh V. Chawla, Olaf Wiest, and Xiangliang Zhang. 2024. Large Language Model Based Multi-agents: A Survey of Progress and Challenges. In Proceedings of the Thirty- Third International Joint Conference on Artificial Intelligence, IJCAI 2024, Jeju, South Korea, August 3-9, 2024 . ijcai.org, ...
2024
-
[15]
Jeffrey Heer and Ben Shneiderman. 2012. Interactive dynamics for visual analy- sis. Commun. ACM 55, 4 (2012), 45–54. doi:10.1145/2133806.2133821
-
[16]
Jeffrey Heer, Fernanda B. Viégas, and Martin Wattenberg. 2007. Voyagers and voyeurs: supporting asynchronous collaborative information visualization. In Proceedings of ACM CHI Conference on Human Factors in Computing Systems , Mary Beth Rosson and David J. Gilmore (Eds.). ACM, 1029–1038. doi:10.1145/ 1240624.1240781
-
[17]
Jane Hoffswell, Wilmot Li, and Zhicheng Liu. 2020. Techniques for flexible re- sponsive visualization design. IEEE Transactions on Visualization and Computer Graphics 27, 2 (2020), 1336–1346
2020
-
[18]
Eric Horvitz. 1999. Principles of Mixed-Initiative User Interfaces. In Proceed- ings of ACM CHI Conference on Human Factors in Computing Systems , Marian G. Williams and Mark W. Altom (Eds.). ACM, 159–166. doi:10.1145/302979.303030
-
[19]
Bakker, Stephen Li, Tim Kraska, and César A
Kevin Zeng Hu, Michiel A. Bakker, Stephen Li, Tim Kraska, and César A. Hidalgo
-
[20]
In Proceedings of ACM CHI Conference on Human Factors in Computing Systems , Stephen A
VizML: A Machine Learning Approach to Visualization Recommendation. In Proceedings of ACM CHI Conference on Human Factors in Computing Systems , Stephen A. Brewster, Geraldine Fitzpatrick, Anna L. Cox, and Vassilis Kostakos (Eds.). ACM, 128. doi:10.1145/3290605.3300358
-
[21]
Nicholas R. Jennings, Katia P. Sycara, and Michael J. Wooldridge. 1998. A Roadmap of Agent Research and Development. Auton. Agents Multi Agent Syst. 1, 1 (1998), 7–38. doi:10.1023/A:1010090405266
-
[22]
Hyeok Kim, Ryan Rossi, Fan Du, Eunyee Koh, Shunan Guo, Jessica Hullman, and Jane Hoffswell. 2022. Cicero: A Declarative Grammar for Responsive Visu- alization. In Proceedings of ACM CHI Conference on Human Factors in Computing Systems (New Orleans, LA, USA) (CHI ’22). Association for Computing Machin- ery, New York, NY, USA, Article 600, 15 pages. doi:10....
-
[23]
Chufan Lai, Zhixian Lin, Ruike Jiang, Yun Han, Can Liu, and Xiaoru Yuan. 2020. Automatic Annotation Synchronizing with Textual Description for Visualiza- tion. In Proceedings of the ACM CHI Conference on Human Factors in Computing Systems (Honolulu, HI, USA) (CHI ’20). Association for Computing Machinery, New York, NY, USA, 1–13. doi:10.1145/3313831.3376443
-
[24]
Guohao Li, Hasan Hammoud, Hani Itani, Dmitrii Khizbullin, and Bernard Ghanem. 2023. CAMEL:Communicative Agents for ”Mind” Exploration of Large Language Model Society. In Advances in Neural Information Process- ing Systems 36: Annual Conference on Neural Information Processing Sys- tems 2023, NeurIPS 2023, New Orleans, LA, USA, December 10 - 16, 2023 , Ali...
2023
-
[25]
Shufan Li, Congxi Lu, Linkai Li, and Haoshuai Zhou. 2022. Chart-RCNN: Ef- ficient Line Chart Data Extraction from Camera Images. CoRR abs/2211.14362 (2022). arXiv: 2211.14362 doi:10.48550/ARXIV.2211.14362
-
[26]
Can Liu, Chunlin Da, Xiaoxiao Long, Yuxiao Yang, Yu Zhang, and Yong Wang
-
[27]
In 2025 IEEE Visualization and Visual Analytics (VIS)
SimVecVis: A Dataset for Enhancing MLLMs in Visualization Understand- ing. In 2025 IEEE Visualization and Visual Analytics (VIS) . 26–30. doi:10.1109/ VIS60296.2025.00010
-
[28]
Can Liu, Yun Han, Ruike Jiang, and Xiaoru Yuan. 2021. ADVISor: Automatic Visualization Answer for Natural-Language Question on Tabular Data. In Pro- ceedings of IEEE Pacific Visualization Symposium . 6–15
2021
-
[29]
Can Liu, Jaeuk Lee, Tianhe Chen, Zhibang Jiang, Xiaolin Wen, and Yong Wang
-
[30]
From Static to Interactive: Authoring Interactive Visualizations via Natural Language
From Static to Interactive: Authoring Interactive Visualizations via Natural Language. arXiv: 2601.17736 [cs.HC] https://arxiv.org/abs/2601.17736
work page internal anchor Pith review Pith/arXiv arXiv
-
[31]
Can Liu, Liwenhan Xie, Yun Han, Xiaoru Yuan, et al. 2020. AutoCaption: An Approach to Generate Natural Language Description From Visualization Auto- matically. In Proceedings of IEEE Pacific Visualization Symposium . 191–195
2020
-
[32]
Yuyu Luo, Nan Tang, Guoliang Li, Chengliang Chai, Wenbo Li, and Xuedi Qin
-
[33]
From NL2SQL Benchmarks
Synthesizing Natural Language to Visualization (NL2VIS) Benchmarks DIS ’26, June 13–17, 2026, Singapore Trovato et al. From NL2SQL Benchmarks. In Proceedings of the International Conference on Management of Data . 1235–1247
2026
-
[34]
Jock Mackinlay. 1986. Automating the Design of Graphical Presentations of Relational Information. ACM Transactions on Graphics 5, 2 (1986), 110–141
1986
-
[35]
Jock D. Mackinlay, Pat Hanrahan, and Chris Stolte. 2007. Show Me: Automatic Presentation for Visual Analysis. IEEE Transactions on Visualization and Com- puter Graphics 13, 6 (2007), 1137–1144. doi:10.1109/TVCG.2007.70594
-
[36]
Malone and Michael S
Thomas W. Malone and Michael S. Bernstein (Eds.). 2015. Handbook of Collective Intelligence. The MIT Press, Cambridge, MA
2015
-
[37]
Microsoft. 2012. TypeScript: JavaScript with syntax for types. https://www. typescriptlang.org
2012
-
[38]
Effectiveness of Animation in Trend Visualization
Dominik Moritz, Chenglong Wang, Greg L. Nelson, Halden Lin, Adam M. Smith, Bill Howe, and Jeffrey Heer. 2019. Formalizing Visualization Design Knowledge as Constraints: Actionable and Extensible Models in Draco. IEEE Transactions on Visualization and Computer Graphics 25, 1 (2019), 438–448. doi:10.1109/TVCG. 2018.2865240
-
[39]
Arpit Narechania, Arjun Srinivasan, and John T. Stasko. 2021. NL4DV: A Toolkit for Generating Analytic Specifications for Data Visualization from Natural Lan- guage Queries. IEEE Transactions on Visualization and Computer Graphics 27, 2 (2021), 369–379. doi:10.1109/TVCG.2020.3030378
- [40]
-
[41]
Jorge Poco and Jeffrey Heer. 2017. Reverse-Engineering Visualizations: Recover- ing Visual Encodings from Chart Images. Computer Graphics Forum 36, 3 (2017), 353–363. doi:10.1111/CGF.13193
-
[42]
Xuedi Qin, Yuyu Luo, Nan Tang, and Guoliang Li. 2020. Making data visualiza- tion more efficient and effective: a survey. The VLDB Journal 29, 1 (Jan. 2020), 93–117. doi:10.1007/s00778-019-00588-3
-
[43]
Manolis Savva, Nicholas Kong, Arti Chhajta, Li Fei-Fei, Maneesh Agrawala, and Jeffrey Heer. 2011. ReVision: automated classification, analysis and redesign of chart images. In Proceedings of ACM Symposium on User Interface Software and Technology, Jeffrey S. Pierce, Maneesh Agrawala, and Scott R. Klemmer (Eds.). ACM, 393–402. doi:10.1145/2047196.2047247
-
[44]
Sarah Schöttler, Jason Dykes, Jo Wood, Uta Hinrichs, and Benjamin Bach. 2024. Constraint-based breakpoints for responsive visualization design and develop- ment. IEEE Transactions on Visualization and Computer Graphics (2024)
2024
-
[45]
Yongliang Shen, Kaitao Song, Xu Tan, Dongsheng Li, Weiming Lu, and Yueting Zhuang. 2023. HuggingGPT: Solving AI Tasks with ChatGPT and its Friends in Hugging Face. In Advances in Neural Information Pro- cessing Systems 36: Annual Conference on Neural Information Processing Sys- tems 2023, NeurIPS 2023, New Orleans, LA, USA, December 10 - 16, 2023 , Alice ...
2023
-
[46]
Noah Shinn, Federico Cassano, Ashwin Gopinath, Karthik Narasimhan, and Shunyu Yao. 2023. Reflexion: language agents with verbal re- inforcement learning. In Advances in Neural Information Processing Sys- tems 36: Annual Conference on Neural Information Processing Systems 2023, NeurIPS 2023, New Orleans, LA, USA, December 10 - 16, 2023 , Alice Oh, Tristan ...
2023
-
[47]
Ben Shneiderman. 1996. The eyes have it: A task by data type taxonomy for information visualizations. In Proceedings of the 1996 IEEE Symposium on Visual Languages. IEEE, 336–343
1996
-
[48]
Significant Gravitas. 2023. AutoGPT. https://github.com/Significant-Gravitas/ AutoGPT
2023
-
[49]
Parameswaran, and Neoklis Polyzotis
Manasi Vartak, Sajjadur Rahman, Samuel Madden, Aditya G. Parameswaran, and Neoklis Polyzotis. 2015. SEEDB: Efficient Data-Driven Visualization Recommen- dations to Support Visual Analytics. Proc. VLDB Endow. 8, 13 (2015), 2182–2193. doi:10.14778/2831360.2831371
-
[50]
Vega-Lite Project. 2026. Vega-Lite Example Gallery. https://vega.github.io/vega- lite/examples/ Accessed: 2026-01-20
2026
-
[51]
Vega Project. 2026. Vega Example Gallery . https://vega.github.io/vega/ examples/ Accessed: 2026-01-20
2026
-
[52]
Viégas, Martin Wattenberg, Frank van Ham, Jesse Kriss, and Matthew M
Fernanda B. Viégas, Martin Wattenberg, Frank van Ham, Jesse Kriss, and Matthew M. McKeon. 2007. ManyEyes: a Site for Visualization at Internet Scale. IEEE Transactions on Visualization and Computer Graphics 13, 6 (2007), 1121–
2007
-
[53]
doi:10.1109/TVCG.2007.70577
-
[54]
Guanzhi Wang, Yuqi Xie, Yunfan Jiang, Ajay Mandlekar, Chaowei Xiao, Yuke Zhu, Linxi Fan, and Anima Anandkumar. 2024. Voyager: An Open-Ended Em- bodied Agent with Large Language Models. Trans. Mach. Learn. Res. 2024 (2024). https://openreview.net/forum?id=ehfRiF0R3a
2024
- [55]
-
[56]
Mackinlay, Bill Howe, and Jeffrey Heer
Kanit Wongsuphasawat, Dominik Moritz, Anushka Anand, Jock D. Mackinlay, Bill Howe, and Jeffrey Heer. 2016. Voyager: Exploratory Analysis via Faceted Browsing of Visualization Recommendations. IEEE Transactions on Visualization and Computer Graphics 22, 1 (2016), 649–658. doi:10.1109/TVCG.2015.2467191
-
[57]
Michael Wooldridge. 2009. An Introduction to MultiAgent Systems (2nd ed.). John Wiley & Sons
2009
-
[58]
Aoyu Wu, Wai Tong, Tim Dwyer, Bongshin Lee, Petra Isenberg, and Huamin Qu. 2020. MobileVisFixer: Tailoring web visualizations for mobile phones lever- aging an explainable reinforcement learning framework. IEEE Transactions on Visualization and Computer Graphics 27, 2 (2020), 464–474
2020
-
[59]
Aoyu Wu, Liwenhan Xie, Bongshin Lee, Yun Wang, Weiwei Cui, and Huamin Qu. 2021. Learning to automate chart layout configurations using crowdsourced paired comparison. In Proceedings of the 2021 CHI Conference on Human Factors in Computing Systems . 1–13
2021
-
[60]
Liwenhan Xie, Yanna Lin, Can Liu, Huamin Qu, and Xinhuan Shu. 2025. DataWink: Reusing and Adapting SVG-based Visualization Examples with Large Multimodal Models. IEEE Transactions on Visualization and Computer Graphics (2025)
2025
-
[61]
Wei Zeng, Xi Chen, Yihan Hou, Lingdan Shao, Zhe Chu, and Remco Chang. 2023. Semi-Automatic Layout Adaptation for Responsive Multiple-View Visualization Design. IEEE Transactions on Visualization and Computer Graphics 30, 7 (2023), 3798–3812
2023
-
[62]
Yu Zhang, Bob Coecke, and Min Chen. 2021. MI3: Machine-initiated Intelligent Interaction for Interactive Classification and Data Reconstruction. ACM Trans. Interact. Intell. Syst. 11, 3-4 (2021), 18:1–18:34. doi:10.1145/3412848 Received 20 February 2007; revised 12 March 2009; accepted 5 June 2009
discussion (0)
Sign in with ORCID, Apple, or X to comment. Anyone can read and Pith papers without signing in.