Recognition: unknown
Knee-xRAI: An Explainable AI Framework for Automatic Kellgren-Lawrence Grading of Knee Osteoarthritis
Pith reviewed 2026-05-08 08:27 UTC · model grok-4.3
The pith
Knee-xRAI quantifies joint space narrowing, osteophytes, and sclerosis separately before combining them into an auditable Kellgren-Lawrence grade.
A machine-rendered reading of the paper's core claim, the machinery that carries it, and where it could break.
Core claim
Knee-xRAI explicitly quantifies the three KL-defining radiographic features within a single auditable pipeline by running independent modules for joint space narrowing, per-site osteophyte grading, and binary sclerosis detection, then feeding the structured 50-dimensional vector into complementary classification paths that preserve both predictive performance and feature-level transparency.
What carries the argument
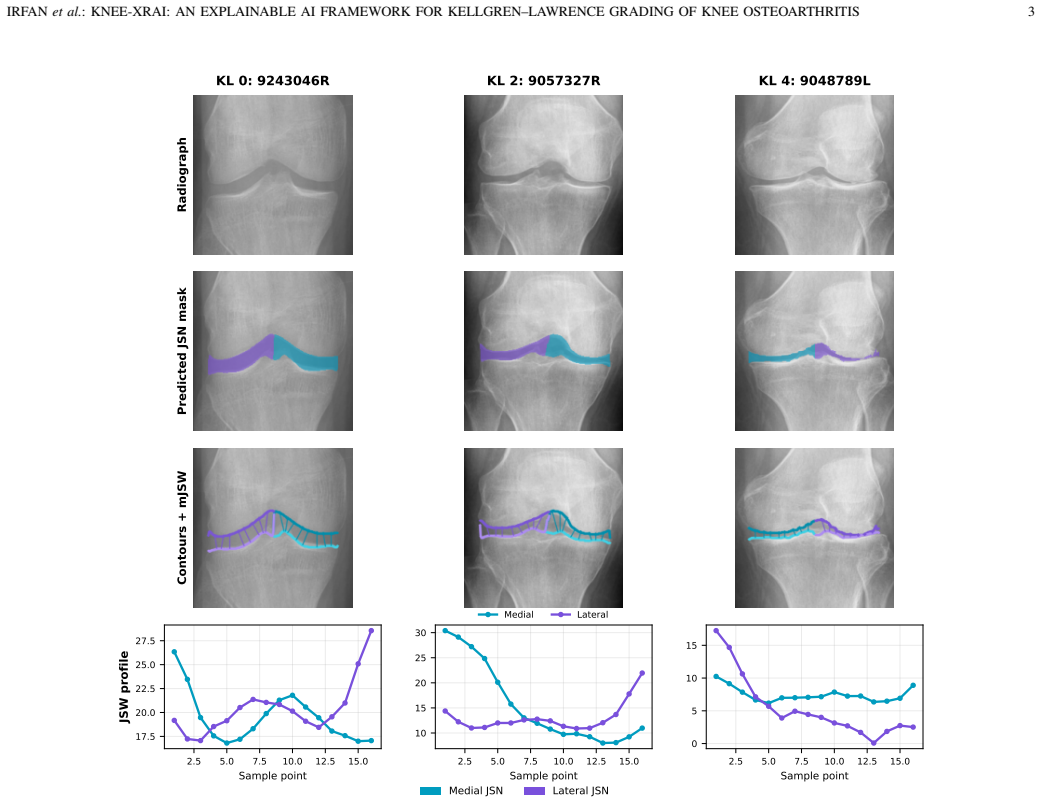
A 50-dimensional structured feature vector assembled from independent quantification of joint space narrowing (via U-Net++), osteophytes (via SE-ResNet-50 on the OARSI scale), and subchondral sclerosis (via hybrid texture-CNN), which is then classified by both an XGBoost path with SHAP attribution and a ConvNeXt hybrid path.
If this is right
- Joint space narrowing alone produces a quadratic weighted kappa of 0.6103, establishing it as the dominant single predictor.
- Adding the osteophyte features yields a consistent incremental gain of 0.0183 in quadratic weighted kappa.
- The transparent XGBoost path supplies complete feature-level audit capability for every grade decision.
- Zeroing or permuting the structured features causes measurable drops in the hybrid path's performance, confirming that the explicit measurements contribute information beyond the raw image encoder.
Where Pith is reading between the lines
- The same modular decomposition could be reused to generate training examples that highlight which feature combination corresponds to each grade, potentially accelerating radiologist education.
- Longitudinal sequences of radiographs could be tracked by monitoring changes in the individual feature scores rather than only the composite grade.
- The 50-dimensional vector might serve as a compact, standardized input for future multimodal models that also incorporate clinical symptoms or laboratory data.
Load-bearing premise
Measurements of the three radiographic features taken in isolation can be recombined to reproduce the same overall Kellgren-Lawrence grade that a human reader would assign after considering the image holistically.
What would settle it
A large set of radiographs in which the three features appear in conflicting combinations (severe narrowing with minimal osteophytes, for example) where the framework's integrated grade systematically differs from the majority vote of expert readers.
Figures


read the original abstract
Radiographic grading of knee osteoarthritis (KOA) with the Kellgren-Lawrence (KL) system is limited by inter-reader variability and the opacity of current deep learning approaches, which predict KL grades directly from images without decomposing structural features. We present Knee-xRAI, a modular framework that independently quantifies the three cardinal radiographic features of KOA (joint space narrowing [JSN], osteophytes, and subchondral sclerosis) and integrates them into an explainable KL grade classification. The pipeline combines U-Net++ segmentation for contour-based JSN measurement, an SE-ResNet-50 network for per-site osteophyte grading (OARSI scale), and a hybrid texture-CNN classifier for binary sclerosis quantification. The resulting 50-dimensional structured feature vector feeds two complementary classification paths. An XGBoost path supports SHAP-based feature attribution. A ConvNeXt hybrid path combines the structured vector with a full-image encoder for enhanced predictive performance. Evaluated on 8,260 radiographs from an OAI-derived dataset, the JSN module achieved a Dice coefficient of 0.8909 and an mJSW intraclass correlation of 0.8674 against manual annotations. The ConvNeXt hybrid path reached a test quadratic weighted kappa (QWK) of 0.8436 and AUC of 0.9017. The transparent XGBoost path achieved a test QWK of 0.6294 with full feature-level audit capability. Ablation confirmed JSN as the dominant predictor (QWK = 0.6103 alone), with osteophyte features providing consistent incremental gain (+0.0183) and sclerosis contributing marginally. Inference-time ablation of Path B confirmed the structured pathway contributes materially beyond the image encoder, with QWK drops of 0.098 (feature zeroing) and 0.284 (feature-image permutation). Knee-xRAI explicitly quantifies all three KL-defining radiographic features within a single auditable pipeline.
Editorial analysis
A structured set of objections, weighed in public.
Referee Report
Summary. The manuscript presents Knee-xRAI, a modular explainable AI framework for automatic Kellgren-Lawrence (KL) grading of knee osteoarthritis radiographs. It independently quantifies the three defining features—joint space narrowing (JSN) via U-Net++ segmentation, osteophytes via SE-ResNet-50 on OARSI scale, and subchondral sclerosis via texture-CNN—producing a 50-dimensional structured feature vector. This vector feeds an XGBoost classifier for SHAP-based auditability and a hybrid ConvNeXt path that fuses the vector with a full-image encoder. On 8,260 OAI-derived radiographs, the JSN module reports Dice 0.8909 and mJSW ICC 0.8674; the hybrid achieves test QWK 0.8436 and AUC 0.9017 while the XGBoost path reaches QWK 0.6294, with ablations confirming JSN dominance and incremental value from other features.
Significance. If the modular decomposition and integration hold, the work offers a concrete advance in explainable medical AI by decomposing KL grading into auditable radiographic features rather than end-to-end black-box prediction. The dual-path design, ablation results showing structured features add value beyond the image encoder, and explicit quantification of JSN/osteophytes/sclerosis provide a template for trustworthy AI in osteoarthritis assessment that could support clinical review and feature-level debugging.
major comments (2)
- [Abstract] Abstract: The 0.214 QWK gap between the transparent XGBoost path (0.6294) and the ConvNeXt hybrid (0.8436), together with the ablation drops of 0.098 (feature zeroing) and 0.284 (permutation), indicates that the 50-dimensional structured vector alone does not reproduce the full information used in holistic KL grading. This directly challenges the central claim that independent quantification of JSN, osteophytes, and sclerosis can be integrated without material loss relative to radiologist assessment.
- [Abstract] Abstract: Reported performance metrics (QWK, AUC, Dice, ICC) are given without error bars, confidence intervals, exact train/test split ratios, or full cross-validation protocol details, which prevents rigorous evaluation of statistical reliability and reproducibility of the claimed superiority of the hybrid path and the feature contributions.
minor comments (1)
- [Abstract] The abstract states a '50-dimensional structured feature vector' but does not break down the exact dimensionality contributed by each module (JSN measurements, osteophyte grades, sclerosis scores), which would aid reproducibility and interpretation of the SHAP attributions.
Simulated Author's Rebuttal
We thank the referee for the constructive and detailed feedback on our manuscript. We address each major comment point by point below, providing clarifications and indicating where revisions will be made to improve the paper.
read point-by-point responses
-
Referee: [Abstract] Abstract: The 0.214 QWK gap between the transparent XGBoost path (0.6294) and the ConvNeXt hybrid (0.8436), together with the ablation drops of 0.098 (feature zeroing) and 0.284 (permutation), indicates that the 50-dimensional structured vector alone does not reproduce the full information used in holistic KL grading. This directly challenges the central claim that independent quantification of JSN, osteophytes, and sclerosis can be integrated without material loss relative to radiologist assessment.
Authors: We acknowledge the observed performance gap and agree that the 50-dimensional structured feature vector does not capture every nuance present in a holistic radiologist assessment. However, this does not contradict the manuscript's central claim. The framework's primary contribution is the explicit, independent quantification of JSN, osteophytes, and sclerosis into an auditable pipeline, with the XGBoost path providing full feature-level transparency (QWK 0.6294). The hybrid ConvNeXt path is presented as a complementary option that fuses these structured features with image encoding to improve performance, and the ablations explicitly demonstrate the structured features' incremental value beyond the image encoder alone. We do not claim zero information loss in the transparent path; rather, we highlight the trade-off between interpretability and peak accuracy. We will revise the abstract to more clearly distinguish the two paths and avoid any implication of lossless integration. revision: partial
-
Referee: [Abstract] Abstract: Reported performance metrics (QWK, AUC, Dice, ICC) are given without error bars, confidence intervals, exact train/test split ratios, or full cross-validation protocol details, which prevents rigorous evaluation of statistical reliability and reproducibility of the claimed superiority of the hybrid path and the feature contributions.
Authors: We agree that reporting uncertainty estimates and full experimental protocol details is necessary for rigorous evaluation and reproducibility. The current version provides only point estimates. In the revised manuscript, we will add 95% confidence intervals (via bootstrapping) for all reported metrics in the abstract, results, and tables. We will also specify the exact train/validation/test split ratios (including subject-level partitioning to avoid leakage), the total number of images/subjects per split, and the cross-validation strategy used for hyperparameter tuning and model selection in the Methods section, with additional details in supplementary material. revision: yes
Circularity Check
No significant circularity; modular training and test-set evaluation are independent of target labels.
full rationale
The paper trains independent modules (U-Net++ segmentation for JSN, SE-ResNet-50 for OARSI osteophyte grading, texture-CNN for sclerosis) on separate annotations, extracts a 50-dimensional feature vector, and then trains XGBoost or a hybrid ConvNeXt path to predict KL grades on held-out test radiographs from an OAI-derived split. Reported metrics (Dice 0.8909, mJSW ICC 0.8674, QWK 0.6294/0.8436, ablation drops) are computed against external manual labels and do not reduce to any quantity defined solely by the fitted parameters. No self-definitional equations, fitted inputs renamed as predictions, load-bearing self-citations, or ansatz smuggling appear in the derivation. The central claim rests on empirical performance rather than tautological construction.
Axiom & Free-Parameter Ledger
free parameters (1)
- network hyperparameters
axioms (1)
- domain assumption OAI-derived radiographs are representative of clinical knee X-rays
Reference graph
Works this paper leans on
-
[1]
Global, regional prevalence, incidence and risk factors of knee osteoarthritis in population- based studies,
A. Cui, H. Li, D. Wang, J. Zhong, Y . Chen, and H. Lu, “Global, regional prevalence, incidence and risk factors of knee osteoarthritis in population- based studies,”EClinicalMedicine, vol. 29–30, p. 100587, 2020
2020
-
[2]
Global, regional, and national burden of osteoarthritis, 1990–2020 and projections to 2050: a systematic analysis for the Global Burden of Disease Study 2021,
J. D. Steinmetz, G. T. Culbreth, L. M. Haile, Q. Rafferty, J. Lo, K. G. Fukutaki, J. A. Cruz, A. E. Smith, S. E. V ollset, P. M. Brooks,et al., “Global, regional, and national burden of osteoarthritis, 1990–2020 and projections to 2050: a systematic analysis for the Global Burden of Disease Study 2021,”The Lancet Rheumatology, vol. 5, no. 9, pp. e508– e522, 2023
1990
-
[3]
Jakarta, Indonesia: Badan Pusat Statistik, 2019
Badan Pusat Statistik,Statistik Indonesia 2019: Statistical Yearbook of Indonesia 2019. Jakarta, Indonesia: Badan Pusat Statistik, 2019. [Online]. Available: https://www.bps.go.id/
2019
-
[4]
Radiology loading and coverage hours in Indonesia,
R. E. Yunus, “Radiology loading and coverage hours in Indonesia,” Korean Journal of Radiology, vol. 25, no. 7, pp. 597–599, 2024
2024
-
[5]
Applying deep learning based super- resolution to knee imaging,
A. Rey-Blanes and E. Dominguez, “Applying deep learning based super- resolution to knee imaging,” inArtificial Intelligence in Healthcare: First International Conference, AIiH 2024, Swansea, UK, September 4–6, 2024, Proceedings, Part II, ser. Lecture Notes in Computer Science, vol. 14976. Springer, 2024, pp. 77–88
2024
-
[6]
Radiological assessment of osteo- arthrosis,
J. H. Kellgren and J. S. Lawrence, “Radiological assessment of osteo- arthrosis,”Annals of the Rheumatic Diseases, vol. 16, no. 4, pp. 494–502, 1957. 8 PREPRINT VERSION. APRIL, 2026
1957
-
[7]
Differences in descriptions of Kellgren and Lawrence grades of knee osteoarthritis,
D. Schiphof, M. Boers, and S. M. Bierma-Zeinstra, “Differences in descriptions of Kellgren and Lawrence grades of knee osteoarthritis,” Annals of the Rheumatic Diseases, vol. 67, no. 7, pp. 1034–1036, 2008
2008
-
[8]
Defining the presence of radiographic knee osteoarthritis: a comparison between the Kellgren and Lawrence system and OARSI atlas criteria,
A. G. Culvenor, C. N. Engen, B. E. Øiestad, L. Engebretsen, and M. A. Risberg, “Defining the presence of radiographic knee osteoarthritis: a comparison between the Kellgren and Lawrence system and OARSI atlas criteria,”Knee Surgery, Sports Traumatology, Arthroscopy, vol. 23, no. 12, pp. 3532–3539, 2015
2015
-
[9]
Automatic grading of individual knee osteoarthritis features in plain radiographs using deep convolutional neural networks,
A. Tiulpin and S. Saarakkala, “Automatic grading of individual knee osteoarthritis features in plain radiographs using deep convolutional neural networks,”Diagnostics, vol. 10, no. 11, p. 932, 2020
2020
-
[10]
XAI is in trouble,
R. O. Weber, A. J. Johs, P. Goel, and J. M. Silva, “XAI is in trouble,” AI Magazine, vol. 45, no. 3, pp. 300–316, 2024
2024
-
[11]
Assessment of a novel deep learning-based software developed for automatic feature extraction and grading of radiographic knee osteoarthritis,
J. S. Yoon, C.-J. Yon, D. Lee, J. J. Lee, C. H. Kang, S.-B. Kang, N.-K. Lee, and C. B. Chang, “Assessment of a novel deep learning-based software developed for automatic feature extraction and grading of radiographic knee osteoarthritis,”BMC Musculoskeletal Disorders, vol. 24, no. 1, p. 869, 2023
2023
-
[12]
Fully automatic knee osteoarthritis severity grading using deep neural networks with a novel ordinal loss,
P. Chen, L. Gao, X. Shi, K. Allen, and L. Yang, “Fully automatic knee osteoarthritis severity grading using deep neural networks with a novel ordinal loss,”Computerized Medical Imaging and Graphics, vol. 75, pp. 84–92, 2019
2019
-
[13]
Ensemble deep-learning networks for automated osteoarthritis grading in knee X-ray images,
S.-W. Pi, B.-D. Lee, M. S. Lee, and H. J. Lee, “Ensemble deep-learning networks for automated osteoarthritis grading in knee X-ray images,” Scientific Reports, vol. 13, no. 1, p. 22887, 2023
2023
-
[14]
Classification of grades of subchondral sclerosis from knee radiographic images using artificial intelligence,
S.-B. Kim, Y . J. Kim, J.-Y . Jung, and K. G. Kim, “Classification of grades of subchondral sclerosis from knee radiographic images using artificial intelligence,”Sensors, vol. 25, no. 8, p. 2535, 2025
2025
-
[15]
VL-OrdinalFormer: Vision–Language-guided ordinal transformers for interpretable knee osteoarthritis grading,
Z. Ullah and J. Kim, “VL-OrdinalFormer: Vision–Language-guided ordinal transformers for interpretable knee osteoarthritis grading,”Math- ematics, vol. 14, no. 6, p. 963, 2026
2026
-
[16]
Automatic knee osteoarthritis severity grading based on X-ray images using a hierarchical classification method,
J. Pan, Y . Wu, Z. Tang, K. Sun, M. Li, J. M. Sun, J. Liu, J. Tian, and B. Shen, “Automatic knee osteoarthritis severity grading based on X-ray images using a hierarchical classification method,”Arthritis Research & Therapy, vol. 26, no. 1, p. 203, 2024
2024
-
[17]
Predicting joint space changes in knee osteoarthritis over 6 years: a combined model of TransUNet and XGBoost,
J. Guo, P. Yan, H. Luo, Y . Ma, Y . Jiang, C. Ju, W. Chen, M. Liu, S. Lv, and Y . Qin, “Predicting joint space changes in knee osteoarthritis over 6 years: a combined model of TransUNet and XGBoost,”Quantitative Imaging in Medicine and Surgery, vol. 15, no. 2, pp. 1396–1410, 2025
2025
-
[18]
Atlas of individual radiographic features in osteoarthritis, revised,
R. D. Altman and G. E. Gold, “Atlas of individual radiographic features in osteoarthritis, revised,”Osteoarthritis and Cartilage, vol. 15, no. Suppl A, pp. A1–A56, 2007
2007
-
[19]
Adaptive segmentation of knee radiographs for selecting the optimal ROI in texture analysis,
N. Bayramoglu, A. Tiulpin, J. Hirvasniemi, M. T. Nieminen, and S. Saarakkala, “Adaptive segmentation of knee radiographs for selecting the optimal ROI in texture analysis,”Osteoarthritis and Cartilage, vol. 28, no. 7, pp. 941–952, 2020
2020
-
[20]
Grad-CAM: Visual explanations from deep networks via gradient-based localization,
R. R. Selvaraju, M. Cogswell, A. Das, R. Vedantam, D. Parikh, and D. Batra, “Grad-CAM: Visual explanations from deep networks via gradient-based localization,”International Journal of Computer Vision, vol. 128, no. 2, pp. 336–359, 2020
2020
-
[21]
DeepKneeExplainer: Explainable knee osteoarthritis diagnosis from radiographs and magnetic resonance imag- ing,
M. R. Karim, J. Jiao, T. Doehmen, M. Cochez, O. Beyan, D. Rebholz- Schuhmann, and S. Decker, “DeepKneeExplainer: Explainable knee osteoarthritis diagnosis from radiographs and magnetic resonance imag- ing,”IEEE Access, vol. 9, pp. 39 757–39 780, 2021
2021
-
[22]
Beyond Explainable AI (XAI): An Overdue Paradigm Shift and Post-XAI Research Directions
S. Afroogh, S. I. Ahmed, P. Ahrweiler, D. Alvarez-Melis, M. M. Arief, E. Barakova, F. J. Bargagli-Stoffi, E. Biyik, H. Chen, X. A. Chen,et al., “Beyond explainable AI (XAI): An overdue paradigm shift and post-XAI research directions,”arXiv preprint arXiv:2602.24176, 2026
work page internal anchor Pith review Pith/arXiv arXiv 2026
-
[23]
Knee osteoarthritis severity grading dataset,
P. Chen, “Knee osteoarthritis severity grading dataset,”Mendeley Data, vol. 1, no. 10.17632, p. 30784984, 2018
2018
-
[24]
UNet++: A nested U-Net architecture for medical image segmentation,
Z. Zhou, M. M. R. Siddiquee, N. Tajbakhsh, and J. Liang, “UNet++: A nested U-Net architecture for medical image segmentation,” inDeep Learning in Medical Image Analysis and Multimodal Learning for Clinical Decision Support. Springer, 2018, pp. 3–11
2018
-
[25]
EfficientNet: Rethinking model scaling for convolutional neural networks,
M. Tan and Q. V . Le, “EfficientNet: Rethinking model scaling for convolutional neural networks,” 2020
2020
-
[26]
Squeeze-and-Excitation Networks,
J. Hu, L. Shen, S. Albanie, G. Sun, and E. Wu, “Squeeze-and-Excitation Networks,” 2019
2019
-
[27]
XGBoost: A scalable tree boosting system,
T. Chen and C. Guestrin, “XGBoost: A scalable tree boosting system,” inProceedings of the 22nd ACM SIGKDD International Conference on Knowledge Discovery and Data Mining, 2016, pp. 785–794
2016
-
[28]
A unified approach to interpreting model predictions,
S. M. Lundberg and S.-I. Lee, “A unified approach to interpreting model predictions,” inAdvances in Neural Information Processing Systems, I. Guyon, U. V . Luxburg, S. Bengio, H. Wallach, R. Fergus, S. Vishwanathan, and R. Garnett, Eds., vol. 30. Curran Associates, Inc., 2017, pp. 4765–4774
2017
-
[29]
A ConvNet for the 2020s,
Z. Liu, H. Mao, C.-Y . Wu, C. Feichtenhofer, T. Darrell, and S. Xie, “A ConvNet for the 2020s,” inProceedings of the IEEE/CVF Conference on Computer Vision and Pattern Recognition, 2022, pp. 11 976–11 986
2022
-
[30]
A guideline of selecting and reporting intraclass correlation coefficients for reliability research,
T. K. Koo and M. Y . Li, “A guideline of selecting and reporting intraclass correlation coefficients for reliability research,”Journal of Chiropractic Medicine, vol. 15, no. 2, pp. 155–163, 2016
2016
discussion (0)
Sign in with ORCID, Apple, or X to comment. Anyone can read and Pith papers without signing in.