Recognition: unknown
Aligned Multi-View Scripts for Universal Chart-to-Code Generation
Pith reviewed 2026-05-08 03:25 UTC · model grok-4.3
The pith
Paired chart images with equivalent scripts in Python, R and LaTeX let one model generate executable code in any of those languages.
A machine-rendered reading of the paper's core claim, the machinery that carries it, and where it could break.
Core claim
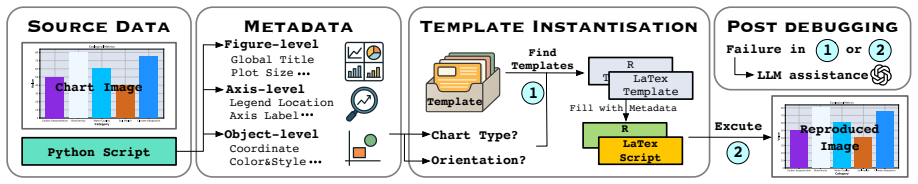
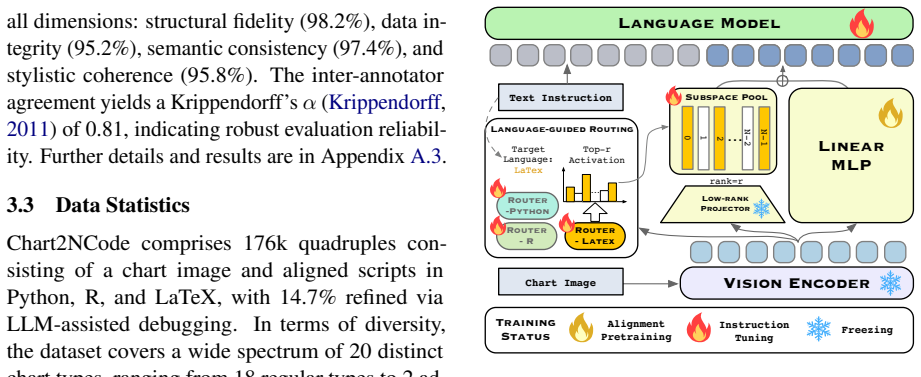
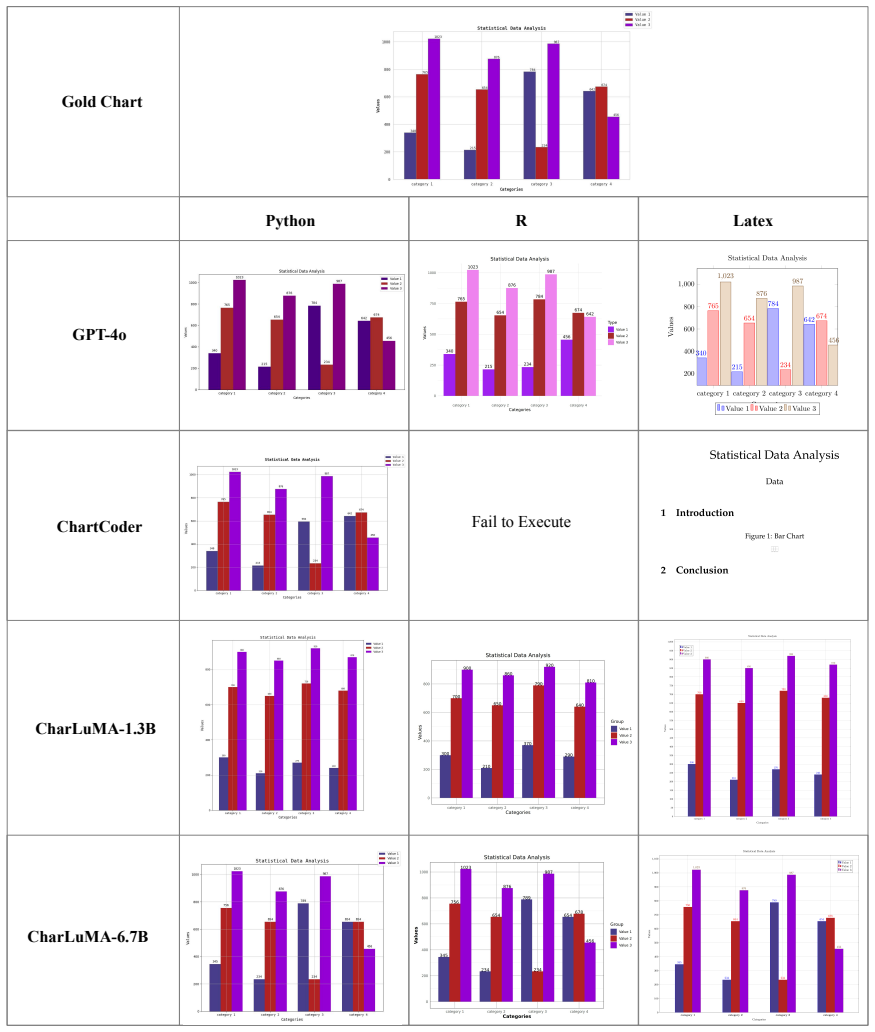
Chart2NCode supplies 176K chart images each paired with semantically equivalent scripts in Python, R and LaTeX, built by converting metadata into language templates and verifying the rendered outputs. CharLuMA augments a LLaVA-style multimodal projector with a language-conditioned mixture of low-rank subspaces that shares core chart comprehension while allowing lightweight language-specific specialization in code generation.
What carries the argument
The language-conditioned mixture of low-rank subspaces added to the multimodal projector, which routes adaptation so the model shares visual chart understanding while producing language-specific plotting code.
If this is right
- Balanced multi-language supervision improves executability and visual fidelity for every language, not just the dominant one.
- The adapter allocates a compact shared core of chart understanding plus compact language-specific capacity.
- The resulting model outperforms strong open-source baselines and stays competitive with proprietary systems across all three languages.
- Analyses confirm that the shared visual features transfer effectively once language-specific routing is added.
Where Pith is reading between the lines
- The same alignment and routing approach could be tested on additional plotting languages or on other visual-to-code tasks such as diagram or UI generation.
- Users could generate a chart in one language and then request an editable version in another language from the same model without retraining.
- The verification step used to build the dataset could be applied to create similar multi-language resources for other domains where code produces visual output.
Load-bearing premise
The metadata-to-template pipeline with rendering verification produces scripts in different languages that are semantically equivalent and render to truly identical visual results.
What would settle it
Take a held-out chart, run the model to produce Python, R and LaTeX scripts, render each output, and check whether the images match the original and each other; any visible mismatch or execution failure would refute the claim of successful aligned multi-language generation.
Figures


read the original abstract
Chart-to-code generation converts a chart image into an executable plotting script, enabling faithful reproduction and editable visualizations. Existing methods are largely Python-centric, limiting practical use and overlooking a critical source of supervision: the same chart can be expressed by semantically equivalent scripts in different plotting languages. To fill this gap, we introduce Chart2NCode, a dataset of 176K charts paired with aligned scripts in Python, R, and LaTeX that render visually equivalent outputs, constructed via a metadata-to-template pipeline with rendering verification and human quality checks. Building on a LLaVA-style architecture, we further propose CharLuMA, a parameter-efficient adaptation module that augments the multimodal projector with a language-conditioned mixture of low-rank subspaces, allowing the model to share core chart understanding while specializing code generation to the target language through lightweight routing. Extensive experiments show consistent gains in executability and visual fidelity across all languages, outperforming strong open-source baselines and remaining competitive with proprietary systems. Further analyses reveal that balanced multi-language supervision benefits all languages and that the adapter allocates a compact shared core plus language-specific capacity. Codes and data are available at https://github.com/Zhihan72/CharLuMA.
Editorial analysis
A structured set of objections, weighed in public.
Referee Report
Summary. The paper introduces Chart2NCode, a dataset of 176K chart images paired with aligned executable scripts in Python, R, and LaTeX constructed via a metadata-to-template pipeline with rendering verification and human quality checks. It proposes CharLuMA, a LLaVA-style multimodal model augmented with a language-conditioned mixture of low-rank subspaces (MoLoRA) adapter that shares core chart understanding while enabling language-specific code specialization. Experiments report consistent gains in executability and visual fidelity across languages, outperforming open-source baselines and competing with proprietary systems, with further analyses on multi-language supervision benefits and adapter capacity allocation.
Significance. If the cross-language alignments prove high-quality and the reported gains are robustly supported by detailed metrics, this work could meaningfully advance universal chart-to-code generation by exploiting multi-view supervision beyond Python-centric approaches. The parameter-efficient MoLoRA design and public release of data/code are clear strengths that facilitate reproducibility and extension.
major comments (2)
- [§3] §3 (Dataset Construction): The central claim that the 176K triples provide semantically equivalent supervision across languages rests on the metadata-to-template pipeline plus rendering verification, yet no quantitative metrics are given on alignment fidelity (e.g., percentage of human corrections, rates of discrepancies in axis scaling/legend placement/color mapping, or inter-language render similarity scores). This is load-bearing for attributing performance gains to multi-view learning rather than easier or noisier targets.
- [§5] §5 (Experiments and Ablations): The headline gains in executability and visual fidelity are presented without the specific numerical values, baseline details, dataset splits, or error bars referenced in the abstract; the ablation on balanced multi-language supervision therefore cannot be fully interpreted without these numbers to rule out data-volume confounds.
minor comments (3)
- [§4.2] The MoLoRA formulation in §4.2 uses notation for the language-conditioned routing weights that is not fully defined in the main text (refer to the appendix for the full equations).
- [Figure 3] Figure 3 (adapter visualization) would benefit from an explicit legend explaining the shared vs. language-specific subspace allocation percentages.
- [Related Work] A few citations to prior chart-to-code works (e.g., on Python-only methods) appear in the related-work section but lack direct comparison tables; expanding Table 1 with those references would improve context.
Simulated Author's Rebuttal
We thank the referee for their constructive comments on our work. We address the major comments point by point below, and we plan to incorporate revisions to provide the requested quantitative details and clarifications.
read point-by-point responses
-
Referee: [§3] §3 (Dataset Construction): The central claim that the 176K triples provide semantically equivalent supervision across languages rests on the metadata-to-template pipeline plus rendering verification, yet no quantitative metrics are given on alignment fidelity (e.g., percentage of human corrections, rates of discrepancies in axis scaling/legend placement/color mapping, or inter-language render similarity scores). This is load-bearing for attributing performance gains to multi-view learning rather than easier or noisier targets.
Authors: We agree with the referee that quantitative metrics on alignment fidelity are important for validating the quality of the multi-language alignments and for attributing gains to multi-view learning. Although the manuscript outlines the metadata-to-template pipeline, rendering verification, and human quality checks, specific numerical metrics were not reported. In the revised version, we will add these details in Section 3, including the percentage of human corrections made, observed discrepancy rates for elements such as axis scaling, legend placement, and color mapping, as well as inter-language render similarity scores (e.g., using SSIM on paired renders). This will provide stronger evidence for the semantic equivalence across languages. revision: yes
-
Referee: [§5] §5 (Experiments and Ablations): The headline gains in executability and visual fidelity are presented without the specific numerical values, baseline details, dataset splits, or error bars referenced in the abstract; the ablation on balanced multi-language supervision therefore cannot be fully interpreted without these numbers to rule out data-volume confounds.
Authors: We thank the referee for pointing this out. While the abstract summarizes the gains and the detailed results appear in tables and figures, we recognize that explicit numerical values, baseline specifications, dataset split information, and error bars should be highlighted in the text for better readability. In the revision, we will insert a concise summary in Section 5 with key numerical results for executability and visual fidelity across languages, details on the baselines and dataset splits (e.g., the proportions used for training and evaluation), and any available error bars. Additionally, for the ablation on balanced multi-language supervision, we will include the exact data volumes per language in the compared conditions to allow readers to assess potential volume-related confounds. revision: yes
Circularity Check
No circularity detected in derivation or claims
full rationale
The paper constructs a new dataset (Chart2NCode) via an explicit metadata-to-template pipeline plus rendering verification, then trains a LLaVA-style model augmented with a language-conditioned MoLoRA adapter. Performance claims rest on external metrics (executability, visual fidelity) evaluated on held-out data rather than any fitted parameter being renamed as a prediction. No equations, self-definitional loops, load-bearing self-citations, or uniqueness theorems appear in the text. The central pipeline and adapter are presented as engineering choices justified by ablation results, not derived from the target metrics by construction.
Axiom & Free-Parameter Ledger
axioms (1)
- domain assumption A LLaVA-style multimodal projector can be effectively augmented with a language-conditioned mixture of low-rank subspaces to share core understanding while specializing per language.
Reference graph
Works this paper leans on
-
[1]
DeepSeek-Coder: When the Large Language Model Meets Programming -- The Rise of Code Intelligence
Dreamsim: Learning new dimensions of hu- man visual similarity using synthetic data. InAd- vances in Neural Information Processing Systems, volume 36, pages 50742–50768. Kanika Goswami, Puneet Mathur, Ryan Rossi, and Franck Dernoncourt. 2025. Plotgen: Multi-agent llm-based scientific data visualization via multimodal retrieval feedback. InCompanion Procee...
work page internal anchor Pith review arXiv 2025
-
[2]
Sphinx: The joint mixing of weights, tasks, and visual embeddings for multi-modal large lan- guage models.Preprint, arXiv:2311.07575. Haotian Liu, Chunyuan Li, Yuheng Li, and Yong Jae Lee. 2024. Improved baselines with visual instruc- tion tuning. In2024 IEEE/CVF Conference on Com- puter Vision and Pattern Recognition (CVPR), pages 26286–26296. Haotian Li...
-
[3]
Sigmoid loss for language image pre-training, 2023
Mixture-of-subspaces in low-rank adaptation. InProceedings of the 2024 Conference on Empiri- cal Methods in Natural Language Processing, pages 7880–7899, Miami, Florida, USA. Association for Computational Linguistics. Zhengzhuo Xu, Bowen Qu, Yiyan Qi, SiNan Du, Chengjin Xu, Chun Yuan, and Jian Guo. 2025. Chart- moe: Mixture of diversely aligned expert con...
-
[4]
to calculate token counts. The resulting statistics show a mean length of 384.1 tokens for Python (σ= 189.7 , median 348.0), 591.8 tokens for R (σ= 242.0 , median 545.0), and 637.1 tokens for LaTeX (σ= 247.1, median 595.0). Type Area Bar Box Bubble Percent 5.5% 11.6% 5.3% 2.0% Type Density Donut ErrorBar ErrorPoint Percent 1.9% 3.2% 2.9% 4.8% Type Heatmap...
2024
-
[5]
Generate the <language> code to reproduce the chart in this image
and InternVL3.5-8B (Wang et al., 2025). Us- ing the same subset of 100 examples and identical scoring criteria (Figure 11), we observe high Pear- son correlations between the open-source judges and GPT-4o (0.8728 for Qwen3-VL-8B and 0.8540 for InternVL3.5-8B). Furthermore, both models demonstrate high alignment with human annota- tors (achieving correlati...
2025
-
[6]
Chart Types (20 points): Does the AI-generated image include all chart types present in the reference image (e.g., line charts, bar charts, etc.)?
-
[7]
Layout (10 points): Does the arrangement of subplots in the AI-generated image match the reference image (e.g., number of rows and columns)?
-
[8]
Text Content (20 points): Does the AI-generated image include all text from the reference image (e.g., titles, annotations, axis labels), excluding axis tick labels?
-
[9]
Data (20 points): How accurately do the data trends in the AI-generated image resemble those in the original image and is the number of data groups the same as in the reference image?
-
[10]
Style (20 points): Does the AI-generated image match the original in terms of colors (line colors, fill colors, etc.), marker types (point shapes, line styles, etc.), legends, grids, and other stylistic details?
-
[11]
object": {
Clarity (10 points): Is the AI-generated image clear and free of overlapping elements? ### Evaluation: Compare the two images head to head and provide a detailed assessment. Use the following format for your response: — Comments: - Chart Types: ${your comment and subscore} - Layout: ${your comment and subscore} - Text Content: $your comment and subscore -...
2025
-
[12]
Verify that the subplot arrangement, axis orientation, and overall spatial layout strictly adhere to the reference structure
Structural Fidelity Assess the preservation of the chart's geometric configuration. Verify that the subplot arrangement, axis orientation, and overall spatial layout strictly adhere to the reference structure. 1 Severe Mismatch Moderate Deviation Perfect Alignment
-
[13]
Ensure the reconstructed visualization precisely reflects the original data values, trends, and distributions without distortion
Data Integrity Evaluate the accuracy of the underlying quantitative data. Ensure the reconstructed visualization precisely reflects the original data values, trends, and distributions without distortion. 1 Severe Mismatch Moderate Deviation Perfect Alignment
-
[14]
Confirm that titles, labels, legends, and annotations are textually accurate, free from omissions, substitutions, or hallucinations
Semantic Consistency Verify the correctness of all textual and categorical information. Confirm that titles, labels, legends, and annotations are textually accurate, free from omissions, substitutions, or hallucinations. 1 Severe Mismatch Moderate Deviation Perfect Alignment
-
[15]
Check for strict alignment in color palettes, font specifications, marker styles, and gridline visibility relative to the reference chart
Stylistic Coherence Examine the fidelity of non-semantic visual attributes. Check for strict alignment in color palettes, font specifications, marker styles, and gridline visibility relative to the reference chart. 1 Severe Mismatch Moderate Deviation Perfect Alignment Submit Evaluation Total Score: 12 / 20 Figure 14: Screenshot of the human quality check...
-
[16]
Type Max 20 Does the AI-generated image include all chart types present in the reference image (e.g., line charts, bar charts, etc.)? 0 Entirely different (0) Partly the same (10) Exactly the same (20)
-
[17]
Layout Max 10 Does the arrangement of subplots in the AI-generated image match the reference image (e.g., number of rows and columns)? 0 Entirely different (0) Partly the same (5) Exactly the same (10)
-
[18]
Text Content Max 20 Does the AI-generated image include all text from the reference image (e.g., titles, annotations, axis labels), excluding axis tick labels? 0 Entirely different (0) Partly the same (10) Exactly the same (20)
-
[19]
Data Max 20 How accurately do the data trends in the AI-generated image resemble those in the original image and is the number of data groups the same as in the reference image? 0 Entirely different (0) Partly the same (10) Exactly the same (20)
-
[20]
Style Max 20 Does the AI-generated image match the original in terms of colors (line colors, fill colors, etc.), marker types (point shapes, line styles, etc.), legends, grids, and other stylistic details? 0 Entirely different (0) Partly the same (10) Exactly the same (20)
-
[21]
") ax2.plot(categories_2, v2, marker='s', linestyle='--', label='Method 2' if i == 0 else
Clarity Max 10 Is the AI-generated image clear and free of overlapping elements? 0 Entirely different (0) Partly the same (5) Exactly the same (10) Submit Total Score: 50 / 100 Figure 15: Screenshot of the human evaluation questionnaire for MLLM-as-judge metrics. 22 import matplotlib.pyplot as plt import numpy as np categories_1 = ['Cost Reduction', 'Eco F...
2018
discussion (0)
Sign in with ORCID, Apple, or X to comment. Anyone can read and Pith papers without signing in.