Recognition: unknown
A Volume-Price-Adjusted MACD Trading Strategy with Sensitivity Calibration for U.S. Equity Indices
Pith reviewed 2026-05-07 13:55 UTC · model grok-4.3
The pith
A volume-price-adjusted MACD with sensitivity calibration outperforms standard MACD on U.S. equity indices in profitability, risk-adjusted returns, and downside protection.
A machine-rendered reading of the paper's core claim, the machinery that carries it, and where it could break.
Core claim
The VP-MACD framework modifies the standard moving average convergence divergence indicator by incorporating volume, volatility, and intraday price information and adds a calibrated sensitivity parameter to enable earlier and more responsive entries, resulting in superior profitability, risk-adjusted performance, and downside-risk control on major U.S. equity indices compared with the unadjusted MACD while generating fewer but more selective signals.
What carries the argument
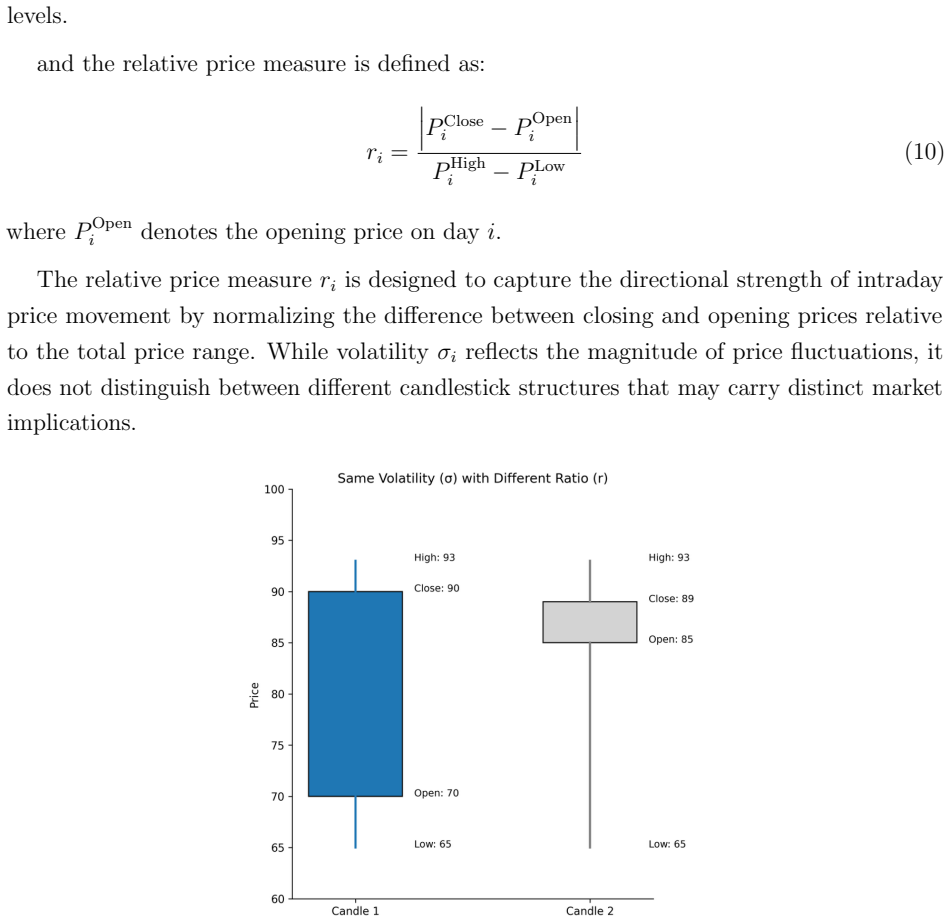
The volume-price-adjusted MACD (VP-MACD) indicator augmented with volume, volatility, and intraday price adjustments plus a tunable sensitivity parameter that shifts entry timing.
Load-bearing premise
The volume, volatility, and intraday price adjustments combined with the sensitivity calibration capture persistent tradable patterns rather than overfitting to the 2018-2022 calibration window.
What would settle it
Showing that the VP-MACD strategy no longer outperforms the baseline MACD in profitability or risk metrics when applied to market data after February 2026 or to a fresh set of equity indices would falsify the central claim.
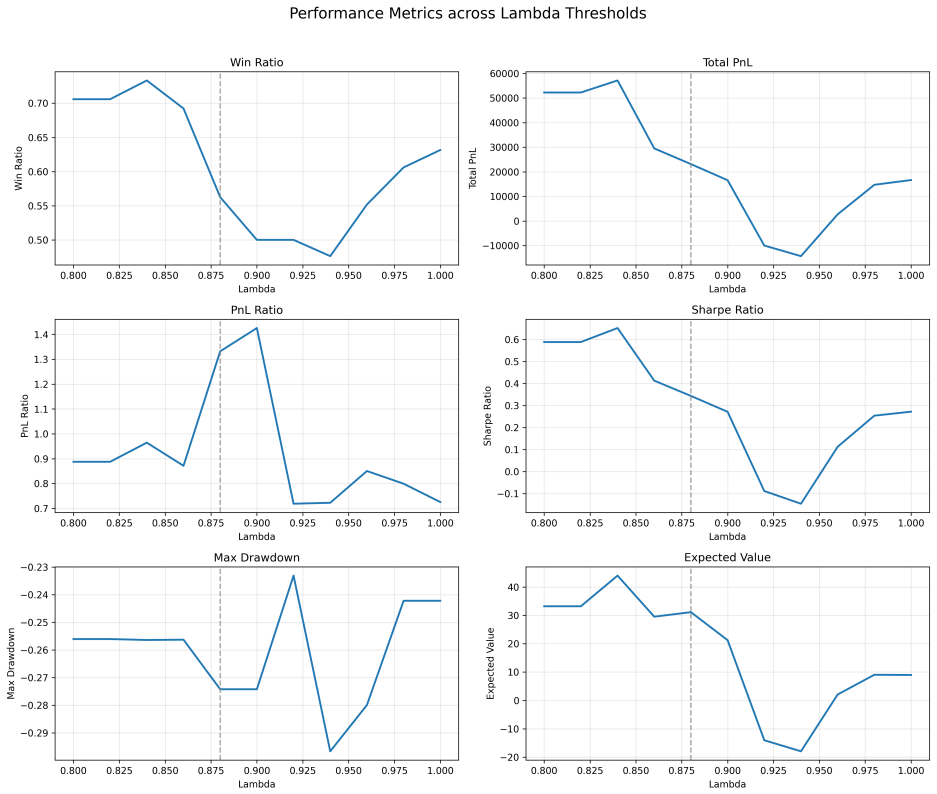
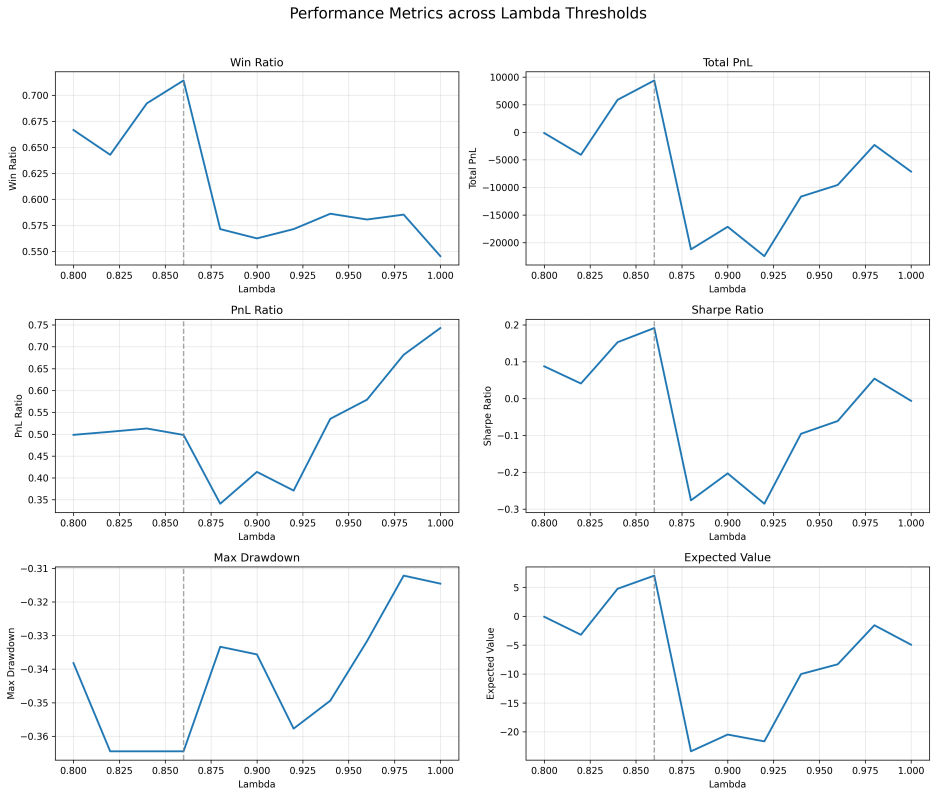
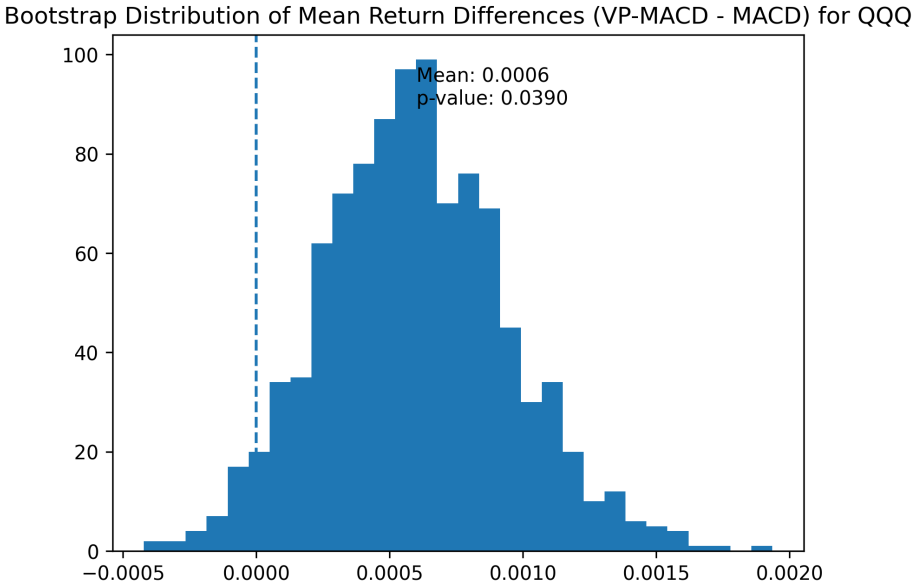
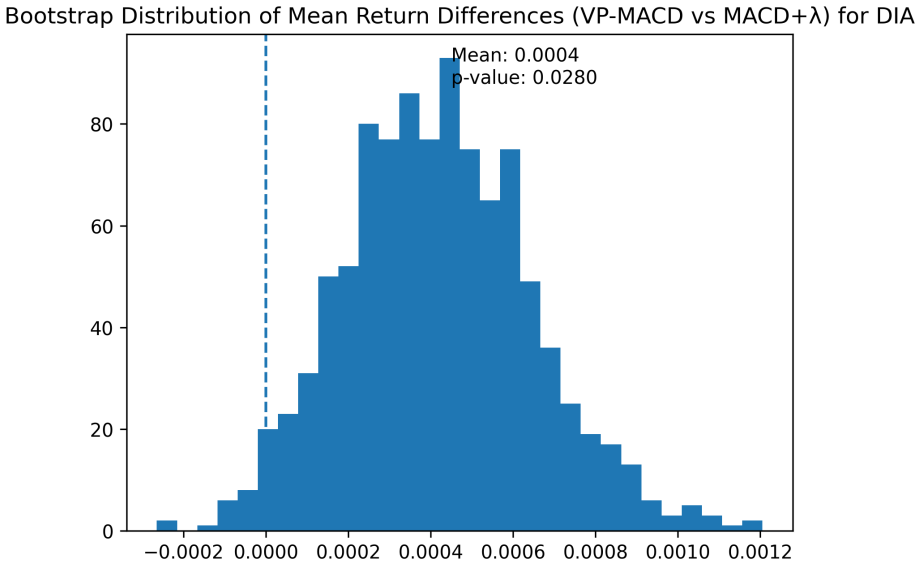
Figures


read the original abstract
Traditional moving average convergence divergence (MACD) trading rules are often constrained by signal lag and susceptibility to false signals. To address these limitations, this study develops a volume-price-adjusted MACD (VP-MACD) framework that incorporates volume, volatility, and intraday price structure into the conventional indicator, and introduces a sensitivity parameter to allow earlier trade entry and improve responsiveness to market movements. Using the S&P 500, Nasdaq-100, and Dow Jones Industrial Average as representative U.S. equity indices, the model is calibrated over historical records from 2018 to 2022 and evaluated out of sample over 2023 to February 2026. The results indicate that the proposed framework generally delivers better economic performance than the baseline MACD strategy in terms of profitability, risk-adjusted return, and downside-risk control, while generating fewer but more selective trading signals. These findings suggest that incorporating additional market information into technical trading rules may enhance signal quality in U.S. equity index markets.
Editorial analysis
A structured set of objections, weighed in public.
Referee Report
Summary. The paper proposes a volume-price-adjusted MACD (VP-MACD) framework that augments the standard MACD indicator with volume, volatility, and intraday price adjustments plus a calibrated sensitivity parameter to reduce lag and false signals. Using S&P 500, Nasdaq-100, and Dow Jones indices, the model is calibrated on 2018-2022 data and evaluated out-of-sample on 2023 to February 2026, claiming superior profitability, risk-adjusted returns, downside-risk control, and more selective signals relative to baseline MACD.
Significance. If the performance gains are shown to be statistically robust and not artifacts of the single calibration window, the work would offer a concrete, implementable refinement to a widely used technical indicator, with potential value for practitioners seeking improved signal quality in U.S. equity index trading.
major comments (3)
- [Empirical Results / Out-of-Sample Evaluation] The central claim of superior economic performance rests on the out-of-sample evaluation, yet the manuscript reports only a single forward test on 2023–February 2026 without walk-forward optimization, regime-stratified results, or formal statistical tests (e.g., Diebold-Mariano or bootstrap) on whether Sharpe-ratio or downside-risk differences are distinguishable from zero after transaction costs.
- [Model Calibration and Sensitivity Parameter] The sensitivity parameter is calibrated on the 2018-2022 window to improve responsiveness; because the 2023-2026 test period may share volatility or trend features with the calibration window, the reported gains in selectivity and profitability risk reflecting in-sample tuning rather than the claimed volume/volatility/intraday mechanism.
- [Abstract and Results Summary] No numerical performance metrics, p-values, or comparison tables are supplied in the abstract or summary description, leaving the asserted improvements in profitability, risk-adjusted return, and downside-risk control without verifiable quantitative support.
minor comments (2)
- [Methodology] Clarify the exact functional form of the volume, volatility, and intraday price adjustments (e.g., how they modify the MACD line or signal line) with explicit equations.
- [Model Calibration] Provide the precise definition and optimization procedure for the sensitivity parameter, including any constraints or grid-search details.
Simulated Author's Rebuttal
We thank the referee for the constructive and detailed comments. We address each major comment below, indicating the revisions we will make to strengthen the empirical robustness and clarity of the manuscript.
read point-by-point responses
-
Referee: [Empirical Results / Out-of-Sample Evaluation] The central claim of superior economic performance rests on the out-of-sample evaluation, yet the manuscript reports only a single forward test on 2023–February 2026 without walk-forward optimization, regime-stratified results, or formal statistical tests (e.g., Diebold-Mariano or bootstrap) on whether Sharpe-ratio or downside-risk differences are distinguishable from zero after transaction costs.
Authors: We acknowledge that reliance on a single forward out-of-sample window limits the strength of the performance claims. In the revised manuscript we will add bootstrap-based statistical tests to assess whether differences in Sharpe ratios and downside-risk metrics remain significant after transaction costs. We will also incorporate a regime-stratified breakdown using volatility regimes identified within the test period. Full walk-forward optimization is not feasible within the scope of a major revision given the computational demands and data constraints, but the proposed bootstrap and regime analyses directly address the core issue of statistical distinguishability. revision: partial
-
Referee: [Model Calibration and Sensitivity Parameter] The sensitivity parameter is calibrated on the 2018-2022 window to improve responsiveness; because the 2023-2026 test period may share volatility or trend features with the calibration window, the reported gains in selectivity and profitability risk reflecting in-sample tuning rather than the claimed volume/volatility/intraday mechanism.
Authors: The 2018-2022 calibration window includes the COVID-19 volatility episode while the 2023-February 2026 test window reflects a distinct post-pandemic regime; the periods are temporally separated. Nevertheless, we accept the concern that shared market characteristics could influence results. We will revise the manuscript to provide a more explicit justification for the period split and add robustness checks, including recalibration on alternative sub-windows and sensitivity analysis demonstrating that performance improvements arise from the volume, volatility, and intraday price adjustments rather than the specific sensitivity values chosen. revision: yes
-
Referee: [Abstract and Results Summary] No numerical performance metrics, p-values, or comparison tables are supplied in the abstract or summary description, leaving the asserted improvements in profitability, risk-adjusted return, and downside-risk control without verifiable quantitative support.
Authors: We agree that the absence of concrete metrics in the abstract reduces immediate verifiability. In the revised version we will update the abstract to include key quantitative results such as cumulative returns, Sharpe ratios, maximum drawdowns, and signal counts for the VP-MACD strategy versus the baseline MACD across the S&P 500, Nasdaq-100, and Dow Jones indices. revision: yes
Circularity Check
No significant circularity; standard calibration and out-of-sample evaluation
full rationale
The paper calibrates a sensitivity parameter on 2018-2022 data then reports performance on an independent 2023-February 2026 window, claiming superiority over baseline MACD. This is a conventional train/test split for an empirical trading rule; the out-of-sample metrics are not equivalent to the calibration inputs by construction, nor do they reduce to any self-definition, ansatz, or self-citation chain. No load-bearing uniqueness theorems or renamed known results appear in the abstract or described framework. The central claim rests on observable economic performance differences rather than tautological equivalence to fitted values.
Axiom & Free-Parameter Ledger
free parameters (1)
- sensitivity parameter
axioms (1)
- domain assumption Historical price and volume data contain persistent patterns that technical rules can exploit for profit
Reference graph
Works this paper leans on
-
[1]
Pat Tong Chio. A comparative study of the macd-base trading strategies: evidence from the us stock market.arXiv preprint arXiv:2206.12282,
-
[2]
The complexity of cryptocurrencies algorithmic trading
Gil Cohen and Mahmoud Qadan. The complexity of cryptocurrencies algorithmic trading. Mathematics, 10(12):2037,
2037
-
[3]
Predicting stock price trend using macd optimized by historical volatility.Mathematical Problems in Engineering, 2018(1):9280590,
Jian Wang and Junseok Kim. Predicting stock price trend using macd optimized by historical volatility.Mathematical Problems in Engineering, 2018(1):9280590,
2018
discussion (0)
Sign in with ORCID, Apple, or X to comment. Anyone can read and Pith papers without signing in.