Recognition: unknown
Electricity price forecasting across Norway's five bidding zones in the post-crisis era
Pith reviewed 2026-05-07 13:35 UTC · model grok-4.3
The pith
LightGBM achieves lowest errors in forecasting Norway's electricity prices post-crisis, with lagged prices and calendars often matching full data.
A machine-rendered reading of the paper's core claim, the machinery that carries it, and where it could break.
Core claim
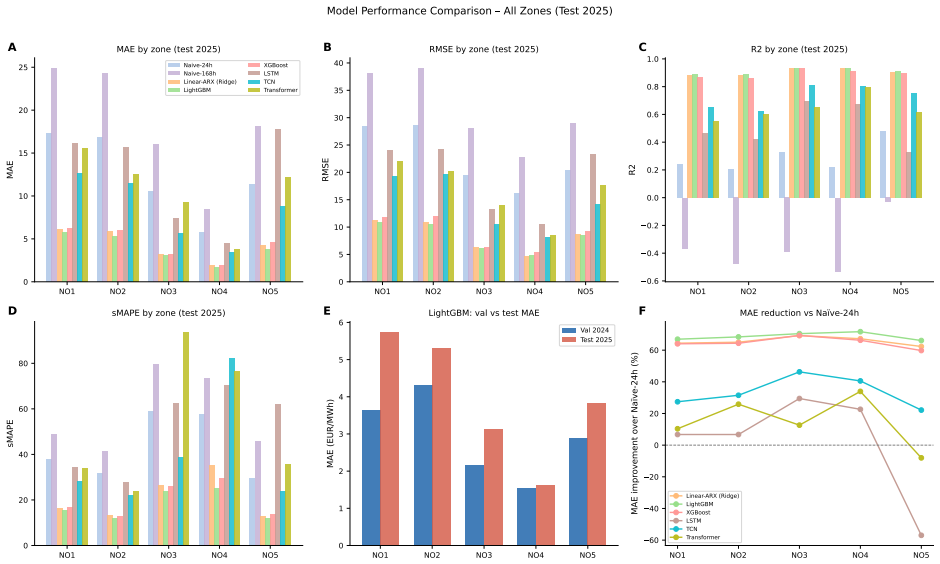
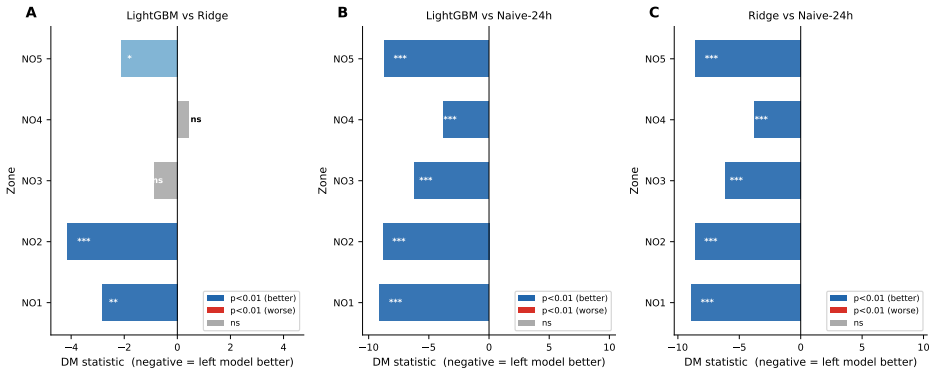
A comprehensive evaluation across Norway's five Nord Pool bidding zones using a 2019-2025 multimodal dataset, rolling-origin backtesting, leave-one-group-out ablation, and conditional regime splits demonstrates that LightGBM outperforms other families in every zone while ridge ARX remains a strong linear baseline in northern areas; models limited to lagged prices and calendar features reach comparable accuracy, yet external covariates remain essential for separating forecast performance across stressed versus normal market regimes.
What carries the argument
Leave-one-group-out feature ablation paired with conditional regime analysis on the post-crisis multimodal dataset to isolate feature contributions and error behavior.
If this is right
- Forecasting systems can often rely on a narrow set of lagged prices and calendar variables without losing accuracy.
- Error spikes remain predictable once market regimes are identified, allowing targeted risk adjustments.
- Linear benchmarks like ridge ARX retain practical value in hydro-rich northern zones where external drivers matter less.
- Regime-aware monitoring becomes necessary for decision makers as integration with Continental Europe continues.
Where Pith is reading between the lines
- The same pattern of minimal features sufficing until regimes shift may appear in other hydro-dominated markets facing similar integration pressures.
- Embedding real-time regime detection into operational systems could reduce exposure during high-error periods without increasing model complexity.
- Extending the ablation to quantify the marginal value of each external variable under different hydro inflow conditions would clarify when multimodal data is worth the cost.
Load-bearing premise
The 2019-2025 multimodal dataset fully captures post-crisis price formation dynamics without unmodeled structural breaks or data quality problems.
What would settle it
A sustained rise in out-of-sample errors on 2026 data or during a fresh market shock that the current regime splits do not anticipate would show the models fail to generalize.
Figures


read the original abstract
Norway's electricity market is heavily dominated by hydropower, but the 2021--2022 energy crisis and stronger integration with Continental Europe have fundamentally altered price formation, reducing the reliability of forecasting models calibrated on historical data. Despite the critical need for updated models, a unified benchmark evaluating feature contributions across all structurally diverse Norwegian bidding zones remains lacking. Here we present a comprehensive evaluation of electricity price forecasting across all five Norwegian Nord Pool bidding zones. We constructed a multimodal hourly dataset spanning 2019--2025 and evaluated eight forecasting model families including LightGBM, ARX, and advanced deep learning architectures using a strictly causal test set. We implemented robust rolling-origin backtesting, leave-one-group-out feature ablation, and conditional regime analysis to dissect model performance and feature utility. Our results show that LightGBM achieves the best performance in every zone with MAE ranging from 1.64 to 5.74~EUR/MWh, while the ridge ARX model remains a highly competitive linear benchmark in northern zones. Feature ablation reveals that models relying solely on lagged prices and calendar variables achieve high accuracy and often match or exceed full multimodal integration. However, conditional regime analysis demonstrates that external features like reservoir levels and gas prices remain crucial to stratify forecast errors, which consistently increase under stressed market regimes. This highlights the practical value of model interpretability and regime awareness for decision makers facing structural changes in market dynamics.
Editorial analysis
A structured set of objections, weighed in public.
Referee Report
Summary. The manuscript presents a comprehensive empirical evaluation of electricity price forecasting across Norway's five Nord Pool bidding zones using a multimodal hourly dataset spanning 2019-2025. It compares eight model families (including LightGBM, ridge ARX, and deep learning architectures) via strictly causal rolling-origin backtesting, leave-one-group-out feature ablation, and conditional regime analysis, claiming that LightGBM achieves the best performance in every zone (MAE 1.64-5.74 EUR/MWh), that lagged prices plus calendar variables are often sufficient, and that external features (e.g., reservoir levels, gas prices) are primarily useful for stratifying forecast errors under stressed regimes.
Significance. If the central results hold, the work supplies a timely post-crisis benchmark for a hydropower-dominated market undergoing structural integration with Continental Europe. The combination of causal backtesting, systematic ablation, and regime-stratified error analysis provides actionable guidance on feature selection and model robustness for practitioners. The construction of the 2019-2025 multimodal dataset and the emphasis on interpretability under varying market conditions are clear strengths.
major comments (1)
- [§3.2] §3.2 (rolling-origin backtesting): The procedure applies rolling-origin evaluation over the entire 2019-2025 span without restricting training windows to post-2022 observations for later test periods. This risks mixing pre-crisis and post-crisis regimes, which directly undermines the claims that results isolate post-crisis dynamics and that external features are needed only for error stratification rather than core prediction.
minor comments (2)
- [Abstract] Abstract: The MAE range 1.64-5.74 EUR/MWh is reported without per-zone attribution or accompanying variability measures, reducing interpretability of the 'best performance' claim.
- [Results] Results: Feature ablation and regime analysis would be strengthened by explicit tables or figures showing per-zone performance deltas and error distributions under each regime.
Simulated Author's Rebuttal
We thank the referee for the constructive feedback on our manuscript. We address the single major comment below and indicate the planned revisions.
read point-by-point responses
-
Referee: [§3.2] §3.2 (rolling-origin backtesting): The procedure applies rolling-origin evaluation over the entire 2019-2025 span without restricting training windows to post-2022 observations for later test periods. This risks mixing pre-crisis and post-crisis regimes, which directly undermines the claims that results isolate post-crisis dynamics and that external features are needed only for error stratification rather than core prediction.
Authors: We appreciate the referee's observation on the backtesting design. Our rolling-origin procedure follows standard practice for causal time-series evaluation by retraining models on all data available up to each forecast origin. This reflects operational reality in which forecasters retain historical observations rather than discarding pre-crisis data. The regime-stratified error analysis already isolates performance differences under stressed versus normal conditions. Nevertheless, we acknowledge that the current setup does not fully isolate post-2022 dynamics. In the revised manuscript we will add a sensitivity experiment that restricts training windows to post-2022 observations for all test periods after 2022 and reports the resulting MAE, feature-ablation outcomes, and regime-stratified errors. This addition will directly test whether pre-crisis data materially alters the conclusions on model ranking and external-feature utility. revision: partial
Circularity Check
No circularity: purely empirical model comparison on held-out data
full rationale
The paper reports an empirical evaluation of eight model families (LightGBM, ARX, deep learning) on a 2019-2025 multimodal dataset for Norwegian electricity prices. It uses standard rolling-origin backtesting, leave-one-group-out ablation, and regime-stratified error analysis to compare MAE and feature utility. No mathematical derivation chain, first-principles predictions, or fitted parameters renamed as out-of-sample results exist; all reported metrics are computed directly on strictly causal held-out test windows. The central claims (LightGBM best across zones, lagged prices+calendar often sufficient) are therefore falsifiable against external benchmarks and do not reduce to the inputs by construction.
Axiom & Free-Parameter Ledger
free parameters (1)
- Hyperparameters of LightGBM, ARX, and deep learning models
axioms (2)
- domain assumption Electricity prices follow patterns predictable from lagged values, calendars, and external features under causal evaluation
- domain assumption The 2019-2025 period sufficiently represents post-crisis market regimes without major unaccounted shifts
Reference graph
Works this paper leans on
-
[1]
European Parliament and Council, Directive 96/92/EC of the European parliament and of the Council of 19 December 1996 concerning common rules for the internal market in electricity, Tech. Rep. L 27/20, Official Journal of the European Communities (1997)
1996
-
[2]
R. Weron, Electricity price forecasting: A review of the state-of-the-art with a look into the future, International Journal of Forecasting 30 (4) (2014) 1030–1081.doi: 10.1016/j.ijforecast.2014.08.008
-
[3]
J. Lago, G. Marcjasz, B. De Schutter, R. Weron, Forecasting day-ahead electricity prices: A review of state-of-the-art algorithms, best practices and an open-access benchmark, Applied Energy 293 (2021) 116983.doi:10.1016/j.apenergy.2021.116983
-
[4]
rep., ESMA (2023)
European Securities and Markets Authority (ESMA), The August 2022 surge in the price of natural gas futures, Tech. rep., ESMA (2023). URLhttps://www.esma.europa.eu/sites/default/files/2023-10/ ESMA50-524821-2963_TRV_Article_the_August_2022_surge_in_the_price_of_ natural_gas_futures.pdf
2022
-
[5]
doi: https://doi.org/10.1016/j.eneco
B. Sæther, A. Neumann, The effect of the 2022 energy crisis on electricity markets ashore the north sea, Energy Economics 131 (2024) 107380.doi:10.1016/j.eneco. 2024.107380
-
[6]
rep., ACER (2022)
Agency for the Cooperation of Energy Regulators (ACER), Wholesale electricity market monitoring 2022: Key developments, Tech. rep., ACER (2022). URLhttps://acer.europa.eu/sites/default/files/documents/Publications/ Electricity_MMR_2022-Key_Developments.pdf
2022
-
[7]
rep., ACER (April 2022)
Agency for the Cooperation of Energy Regulators (ACER), Final assessment of the EU wholesale electricity market design, Tech. rep., ACER (April 2022). URLhttps://euagenda.eu/upload/publications/acer-26-23039-3bs-20final-20assessment-20of-20the-20eu-20wholesale-20electricity-20market-20design. pdf 27
2022
-
[8]
URLhttps://energifaktanorge.no/en/norsk-energiforsyning/ kraftproduksjon/
Norwegian Water Resources and Energy Directorate (NVE), Electricity production in Norway, Energifakta Norge, accessed April 2026 (2025). URLhttps://energifaktanorge.no/en/norsk-energiforsyning/ kraftproduksjon/
2026
-
[9]
Statnett, Interconnector to UK on track for trial operation in october,https://www.statnett.no/en/ for-stakeholders-in-the-power-industry/news-for-the-power-industry/ interconnector-to-uk-on-track-for-trial-operation-in-october/, accessed: April 2026 (2021)
2026
-
[10]
Statnett, NordLink in operation,https://www.statnett.no/en/about-statnett/ news-and-press-releases/news-archive-2021/nordlink-in-operation2/, ac- cessed: April 2026 (2021)
2021
-
[11]
B. Uniejewski, R. Weron, F. Ziel, Variance stabilizing transformations for electricity spot price forecasting, IEEE Transactions on Power Systems 33 (2) (2019) 2219–2229. doi:10.1109/TPWRS.2017.2734563
-
[12]
G. Marcjasz, B. Uniejewski, R. Weron, Beating the naïve - combining LASSO with naïve intraday recalibration for day-ahead electricity price forecasting, Energies 13 (7) (2020) 1667.doi:10.3390/en13071667
-
[13]
A. J¸ edrzejewski, J. Lago, Electricity price forecasting: The dawn of machine learn- ing, IEEE Power and Energy Magazine 20 (4) (2022) 5–12.doi:10.1109/MPE.2022. 3150809
-
[14]
T. Kristiansen, Forecasting Nord Pool day-ahead prices with an autoregressive model, Energy Policy 49 (2012) 328–332.doi:10.1016/j.enpol.2012.06.028
-
[15]
T. Kristiansen, A time series spot price forecast model for the Nord Pool market, International Journal of Electrical Power & Energy Systems 61 (2014) 20–26.doi: 10.1016/j.ijepes.2014.03.007. 28
-
[16]
W. Li, D. M. Becker, Day-ahead electricity price prediction applying hybrid models of LSTM-baseddeeplearningmethodsandfeatureselectionalgorithmsunderconsideration of market coupling, Energy 237 (2021) 121543.doi:10.1016/j.energy.2021.121543
-
[17]
F. Mehroudust, I. Noorani, S. B. Belhaouari, Forecasting Nordic electricity spot price using deep learning networks, Neural Computing and Applications 35 (26) (2023) 19169– 19185.doi:10.1007/s00521-023-08734-3
-
[18]
G. Vamathevan, M. F. Dynge,˘U. Cali, Electricity price forecasting for norwegian day- ahead market using hybrid ai models, in: 2022 18th International Conference on the European Energy Market (EEM), IEEE, Ljubljana, Slovenia, 2022, pp. 1–6.doi:10. 1109/EEM54602.2022.9921003. URLhttps://doi.org/10.1109/EEM54602.2022.9921003
-
[19]
Omdena, AI forecasts Norway power prices,https://www.omdena.com/blog/ electricity-price-forecasting-in-norway(2025)
2025
-
[20]
Scott, W
H. Scott, W. Mellander, Scenario-based long-term electricity price forecasting in no4 (norway) using a hybrid machine learning model, DiVA portal, diva2:1985635, disserta- tion (2025)
2025
-
[21]
G. Ke, Q. Meng, T. Finley, T. Wang, W. Chen, W. Ma, Q. Ye, T.-Y. Liu, LightGBM: A highly efficient gradient boosting decision tree, in: Advances in Neural Information Processing Systems, Vol. 30, 2017, pp. 3146–3154
2017
-
[22]
Hochreiter, J
S. Hochreiter, J. Schmidhuber, Long short-term memory, Neural computation 9 (8) (1997) 1735–1780
1997
-
[23]
S. Bai, J. Z. Kolter, V. Koltun, An empirical evaluation of generic convolutional and recurrent networks for sequence modeling, arXiv preprint arXiv:1803.01271 (2018)
work page internal anchor Pith review arXiv 2018
-
[24]
Vaswani, N
A. Vaswani, N. Shazeer, N. Parmar, J. Uszkoreit, L. Jones, A. N. Gomez, Ł. Kaiser, I. Polosukhin, Attention is all you need, in: Advances in Neural Information Processing Systems, Vol. 30, 2017, pp. 5998–6008. 29
2017
-
[25]
S. Makridakis, Accuracy measures: Theoretical and practical concerns, International Journal of Forecasting 9 (4) (1993) 527–529.doi:10.1016/0169-2070(93)90079-3
-
[26]
F. X. Diebold, R. S. Mariano, Comparing predictive accuracy, Journal of Business & Economic Statistics 13 (3) (1995) 253–263.doi:10.1080/07350015.1995.10524599
-
[27]
Harvey, S
D. Harvey, S. Leybourne, P. Newbold, Testing the equality of prediction mean squared errors, International Journal of Forecasting 13 (2) (1997) 281–291.doi:10.1016/ S0169-2070(96)00719-4
1997
-
[28]
Open-Meteo, Historical weather API,https://open-meteo.com(2024). 30 Supplementary Figures Jan Feb Mar Apr May Jun Jul Aug Sep Oct Nov Dec Month 0 20 40 60 80 100 120Mean Price (EUR/MWh) A NO1 NO2 NO3 NO4 NO5 0 25 50 75 100 125 150 175 200 Lag (hours) 0.6 0.7 0.8 0.9 1.0ACF 24h 168h B NO1 NO2 NO3 NO4 NO5 Mon Tue Wed Thu Fri Sat Sun Day of Week 0 10 20 30 4...
2024
discussion (0)
Sign in with ORCID, Apple, or X to comment. Anyone can read and Pith papers without signing in.