Recognition: unknown
CORINOS V: Radiative transfer effects in protostellar ice observations
Pith reviewed 2026-05-07 08:07 UTC · model grok-4.3
The pith
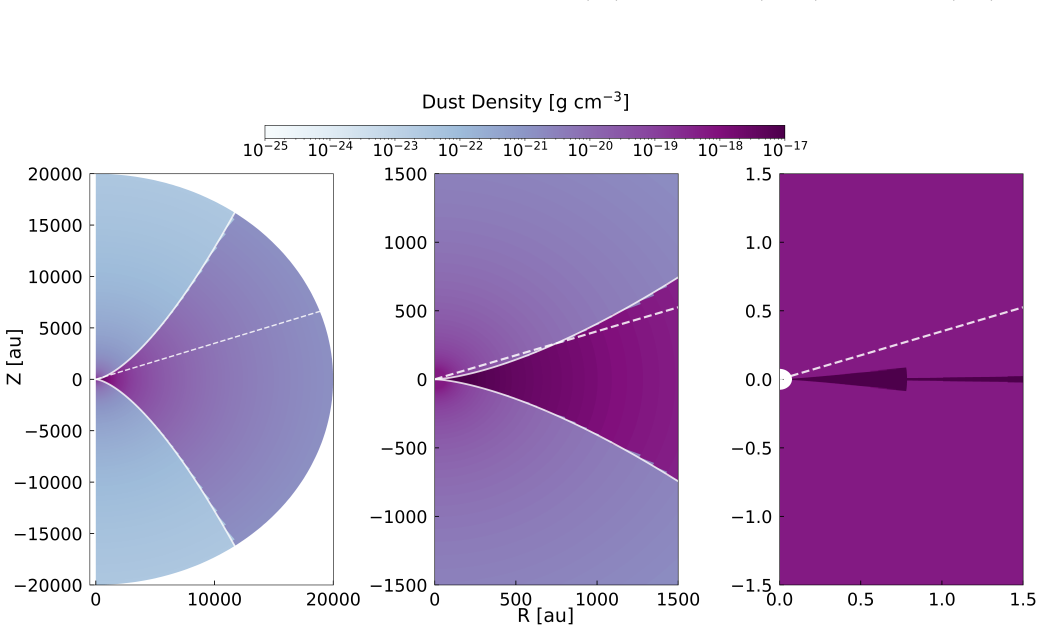
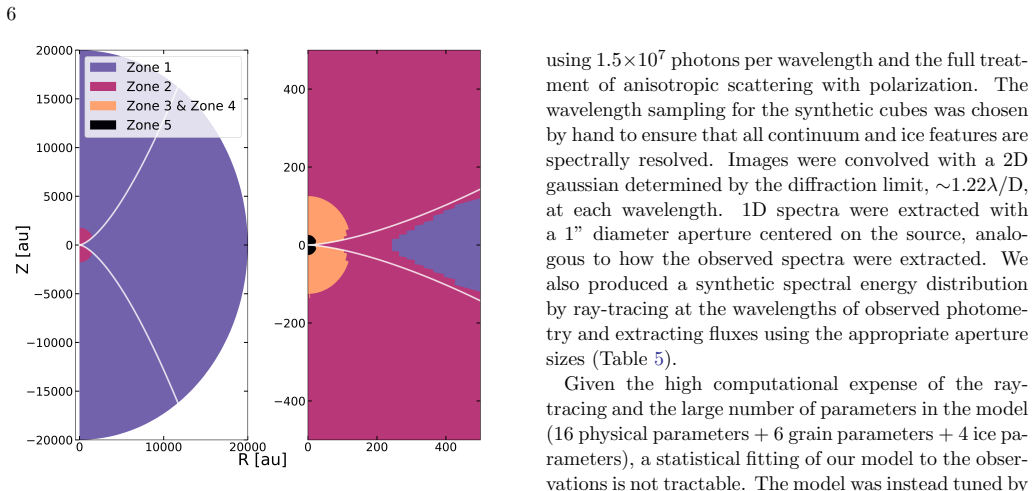
For the protostar IRAS 15398-3359, observed ice absorption mostly originates from material between 1000 and 2000 au along the line of sight rather than the full envelope out to 20,000 au.
A machine-rendered reading of the paper's core claim, the machinery that carries it, and where it could break.
Core claim
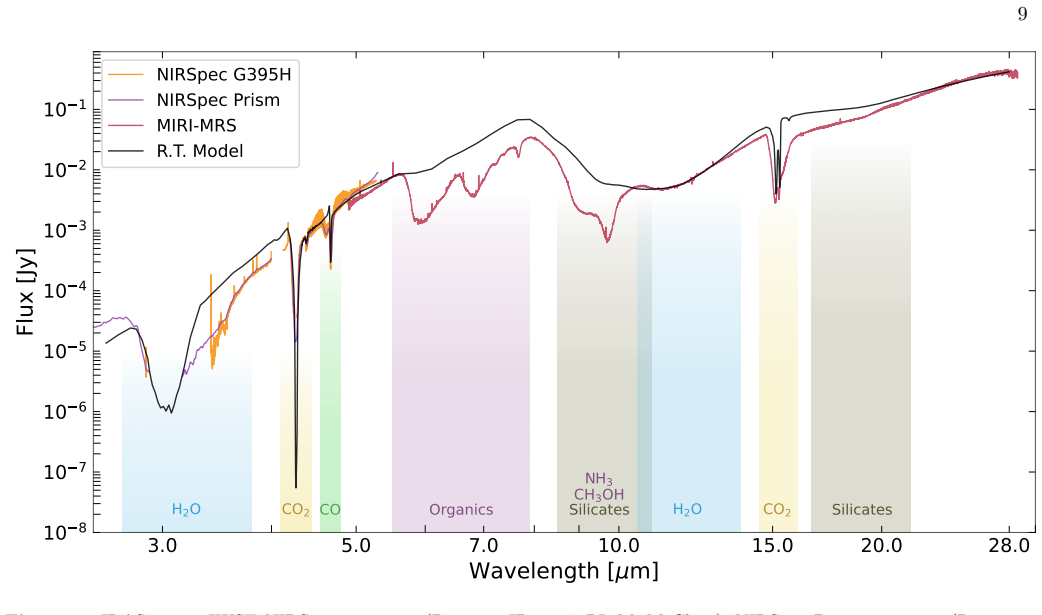
A new radiative transfer framework applied to JWST observations of IRAS 15398-3359 reveals that the absorption predominantly originates along the line of sight between 1000 and 2000 au, peaking at the outflow cavity to envelope transition. The modeled H2O and CO column densities match prior empirical work, but a CO2/H2O ratio of 76% is required to fit the 15 μm band. Using the modeled continuum yields a 6-10 μm optical depth spectrum that differs markedly from polynomial-based continua. The spectra prove largely insensitive to ices in the outer envelope extending to 20,000 au, and apparent column density ratios can be underestimated depending on cavity intersection.
What carries the argument
Three-dimensional radiative transfer model incorporating envelope geometry, outflow cavity, dust properties, and ice distribution to compute absorption spectra.
If this is right
- The observed absorption is insensitive to ices in the outer envelope beyond 2000 au.
- A high CO2 to H2O ratio of 76% is needed to match the 15 μm optical depth.
- Modeled continuum subtraction reveals differences in the 6-10 μm optical depth compared to polynomial methods.
- Apparent CO2/H2O and CO/H2O ratios can underestimate true ice abundances based on line-of-sight geometry.
- JWST ice observations of protostars require radiative transfer corrections for accurate interpretation.
Where Pith is reading between the lines
- Applying the same framework to additional protostars could reveal whether the 1000-2000 au dominance holds generally.
- Observations from different viewing angles might confirm the underestimation of ice ratios.
- The model could be extended to predict how cavity orientation affects trace ice detection.
- Improved constraints on envelope geometry from other observations would strengthen the framework's reliability.
Load-bearing premise
The specific three-dimensional geometry of the envelope, outflow cavity, and ice distribution is assumed to be accurate enough to reproduce the observed spectra.
What would settle it
Mapping the spatial distribution of ice absorption with higher-resolution data at scales of 1000-2000 au and comparing it directly to the model's predicted origin region would test the claim.
Figures


read the original abstract
Recent observations of protostars with the James Webb Space Telescope have revealed unprecedented chemical complexity from their ice absorption features. However, these spectra are likely influenced by radiative transfer effects, and there is little understanding of how this impacts our ability to identify, quantify, and interpret the observed ice features. We have developed a new modeling framework to investigate the radiative transfer through icy protostellar envelopes, and apply this to the IRAS 15398-3359 protostar observed by the JWST CORINOS program. The modeled H$_2$O and CO column densities are similar to previous empirical studies, but we require a high CO$_2$/H$_2$O ratio of 76% to match the optical depth of the 15 $\mu$m band. We use our modeled continuum to calculate a 6-10 $\mu$m optical depth spectrum, and see considerable differences compared to a simple polynomial continuum model, underscoring the challenges with quantifying trace ice species in this range. For this source, we find that the observed absorption predominantly originates along the viewing line of sight between 1000 - 2000 au, peaking at the transition from the outflow cavity to the envelope; the spectra are largely insensitive to absorption from ices in the outer envelope, which extends out to 20,000 au. Lastly, we show that depending on how the line of sight intersects the cavity, the apparent CO$_2$/H$_2$O and CO/H$_2$O column density ratios can be underestimated compared to the underlying ice abundance ratios. Together this provides important context for interpreting the ice constraints derived from JWST observations of protostars.
Editorial analysis
A structured set of objections, weighed in public.
Referee Report
Summary. The manuscript develops a 3D radiative transfer framework for modeling ice absorption in protostellar envelopes and applies it to JWST CORINOS observations of IRAS 15398-3359. It reports that modeled H2O and CO column densities are consistent with prior empirical work, but a CO2/H2O ratio of 76% is required to reproduce the 15 μm band optical depth. Using the modeled continuum, the authors find substantial differences in the derived 6-10 μm optical depth spectrum relative to a simple polynomial continuum. The central result is that absorption along the line of sight originates predominantly between 1000-2000 au, peaking at the outflow-cavity to envelope transition, with the spectra largely insensitive to ices in the outer envelope (extending to 20,000 au). The work also shows that apparent column-density ratios can be underestimated depending on how the line of sight intersects the cavity.
Significance. If the radiative transfer results hold under reasonable variations in geometry, the paper provides timely and useful context for interpreting JWST ice spectra of protostars. Demonstrating that observed absorption is localized to the cavity-envelope transition region and that continuum choice affects trace-species quantification directly addresses a key uncertainty in deriving ice abundances from these data. The new modeling framework is a constructive addition to the field and could be applied to other sources.
major comments (2)
- [§4.3] §4.3 (contribution-function analysis): The headline claim that absorption originates predominantly between 1000-2000 au and is insensitive to the outer envelope follows from the fixed 3D envelope + cavity geometry and assumed ice radial profile. No parameter exploration is presented that varies the cavity opening angle, envelope density power-law index, or the radial cutoff of ice mantles while holding total column density fixed. A modest change in these parameters could shift the peak contribution radius or allow measurable outer-envelope contribution to the 15 μm optical depth, so the quantitative radial localization is not shown to be robust.
- [§3.1 and §4.1] §3.1 and §4.1 (model setup and fitting): The requirement of a 76% CO2/H2O ratio to match the 15 μm band is presented without reported uncertainties on the ratio or tests of alternative explanations such as changes in ice temperature, band strength, or grain-size distribution. Because this ratio is a key output used to interpret the observations, the fitting procedure and its robustness should be documented more explicitly (e.g., via χ² maps or posterior distributions).
minor comments (3)
- [Figure 4] Figure 4 (or equivalent optical-depth comparison figure): The caption should explicitly state the wavelength range, the polynomial order used for the continuum, and the quantitative difference (e.g., Δτ at 6.0, 7.0, and 9.0 μm) between the modeled and polynomial continua.
- [§2.2] §2.2 (radiative transfer equation): The notation for the specific intensity and optical depth should be defined once at first use and kept consistent; the current presentation mixes τ_ν and τ_λ without clear conversion.
- [Introduction] Introduction: Add a brief reference to existing 1D or 2D radiative-transfer codes for protostellar envelopes (e.g., those used in prior ice studies) to clarify the novelty of the 3D framework.
Simulated Author's Rebuttal
We thank the referee for their constructive comments and positive evaluation of the manuscript's significance. We address each major comment point by point below, indicating the revisions that will be incorporated in the next version.
read point-by-point responses
-
Referee: [§4.3] §4.3 (contribution-function analysis): The headline claim that absorption originates predominantly between 1000-2000 au and is insensitive to the outer envelope follows from the fixed 3D envelope + cavity geometry and assumed ice radial profile. No parameter exploration is presented that varies the cavity opening angle, envelope density power-law index, or the radial cutoff of ice mantles while holding total column density fixed. A modest change in these parameters could shift the peak contribution radius or allow measurable outer-envelope contribution to the 15 μm optical depth, so the quantitative radial localization is not shown to be robust.
Authors: We agree that the robustness of the radial localization would be strengthened by parameter variations. The adopted geometry (cavity opening angle, density power-law index) and ice radial profile are directly constrained by independent observations of IRAS 15398-3359. To address the concern, we will add a new sensitivity analysis in §4.3 consisting of three additional models: (i) cavity opening angle varied by ±15°, (ii) density power-law index varied by ±0.2 with normalization adjusted to preserve total column, and (iii) ice mantles truncated at 5000 au. These calculations show that the dominant contribution remains between 1000–2000 au for all cases, although the precise fraction from radii >5000 au can increase modestly when the cavity is narrower. A full exploration of the entire parameter space is beyond the scope of this framework paper but will be noted as future work. revision: partial
-
Referee: [§3.1 and §4.1] §3.1 and §4.1 (model setup and fitting): The requirement of a 76% CO2/H2O ratio to match the 15 μm band is presented without reported uncertainties on the ratio or tests of alternative explanations such as changes in ice temperature, band strength, or grain-size distribution. Because this ratio is a key output used to interpret the observations, the fitting procedure and its robustness should be documented more explicitly (e.g., via χ² maps or posterior distributions).
Authors: We agree that the fitting procedure requires more explicit documentation. In the revised manuscript we will expand §3.1 with a dedicated paragraph describing the χ² minimization used to scale the CO2 abundance (while holding H2O fixed to the observed band depth), including the exact spectral windows and noise weighting. Uncertainties on the resulting 76% ratio will be reported as ±8% based on the continuum-subtracted spectral noise. We will also add a short sensitivity subsection testing (a) ice temperatures of 10–40 K, (b) band strengths varied by ±10% around literature values, and (c) grain-size distributions shifted by ±0.5 μm. These tests confirm that the required CO2/H2O ratio remains above 60% in all cases, demonstrating robustness to the suggested alternatives. revision: yes
Circularity Check
No significant circularity in the derivation chain
full rationale
The paper develops a new radiative transfer modeling framework for protostellar envelopes and applies it to IRAS 15398-3359 to interpret JWST ice spectra. Column densities for H2O and CO are reported as similar to prior empirical studies, with the CO2/H2O ratio adjusted to 76% specifically to reproduce the 15 μm optical depth; the 6-10 μm optical depth spectrum is then computed from the model continuum. The central claim that absorption originates predominantly between 1000-2000 au (peaking at the cavity-envelope transition) and is insensitive to outer-envelope ices follows directly from evaluating the contribution function along the line of sight within the fixed 3D geometry, density profile, and ice distribution of the model. This is a computed output of the radiative transfer calculation rather than a self-referential reduction, a fitted parameter relabeled as a prediction, or a result forced by self-citation. No load-bearing self-citations, uniqueness theorems imported from prior author work, or smuggled ansatzes are described in the abstract or summary sections. The derivation is self-contained as an application of the developed framework to provide interpretive context for the observations.
Axiom & Free-Parameter Ledger
free parameters (1)
- CO2/H2O ratio =
76%
axioms (1)
- domain assumption Standard assumptions of radiative transfer through a structured protostellar envelope with outflow cavities and ice mantles on dust grains
Reference graph
Works this paper leans on
-
[1]
2010, , 518, L102, 10.1051/0004-6361/201014666
Andr´ e, P., Men’shchikov, A., Bontemps, S., et al. 2010, A&A, 518, L102, doi: 10.1051/0004-6361/201014666
-
[2]
Andrews, S. M. 2020, ARA&A, 58, 483, doi: 10.1146/annurev-astro-031220-010302 19
-
[3]
Arabhavi, A. M., Woitke, P., Cazaux, S. M., et al. 2022, A&A, 666, A139, doi: 10.1051/0004-6361/202141825
-
[4]
Bergner, J. B., Sturm, J. A., Piacentino, E. L., et al. 2024, ApJ, 975, 166, doi: 10.3847/1538-4357/ad79fc
-
[5]
Boogert, A. C. A., Gerakines, P. A., & Whittet, D. C. B. 2015, ARA&A, 53, 541, doi: 10.1146/annurev-astro-082214-122348
work page Pith review doi:10.1146/annurev-astro-082214-122348 2015
-
[6]
Boogert, A. C. A., Ehrenfreund, P., Gerakines, P. A., et al. 2000, A&A, 353, 349, doi: 10.48550/arXiv.astro-ph/9909477
work page internal anchor Pith review doi:10.48550/arxiv.astro-ph/9909477 2000
-
[7]
Boogert, A. C. A., Pontoppidan, K. M., Knez, C., et al. 2008, ApJ, 678, 985, doi: 10.1086/533425
-
[8]
Bottinelli, S., Boogert, A. C. A., Bouwman, J., et al. 2010, ApJ, 718, 1100, doi: 10.1088/0004-637X/718/2/1100
-
[9]
2015, MNRAS, 451, 2145, doi: 10.1093/mnras/stv1021
Bouilloud, M., Fray, N., B´ enilan, Y., et al. 2015, MNRAS, 451, 2145, doi: 10.1093/mnras/stv1021
-
[10]
Brunken, N. G. C., van Dishoeck, E. F., Slavicinska, K., et al. 2024, A&A, 692, A163, doi: 10.1051/0004-6361/202451794
-
[11]
Brunken, N. G. C., Boogert, A. C. A., van Dishoeck, E. F., et al. 2025, ACS Earth and Space Chemistry, 9, 1992, doi: 10.1021/acsearthspacechem.5c00037
-
[12]
Chen, Y., Rocha, W. R. M., van Dishoeck, E. F., et al. 2024, A&A, 690, A205, doi: 10.1051/0004-6361/202450706
-
[13]
Cook, A. M., Whittet, D. C. B., Shenoy, S. S., et al. 2011, ApJ, 730, 124, doi: 10.1088/0004-637X/730/2/124
-
[14]
Cordiner, M. A., Roth, N. X., Kelley, M. S. P., et al. 2025, ApJL, 991, L43, doi: 10.3847/2041-8213/ae0647
-
[15]
Pontoppidan, K. M., & Dullemond, C. P. 2008, A&A, 486, 245, doi: 10.1051/0004-6361:20078589
-
[16]
A., Ysard, N., Demyk, K., & Chabot, M
Dartois, E., Noble, J. A., Ysard, N., Demyk, K., & Chabot, M. 2022, A&A, 666, A153, doi: 10.1051/0004-6361/202243929
-
[17]
Dartois, E., Noble, J. A., Caselli, P., et al. 2024, Nature Astronomy, 8, 359, doi: 10.1038/s41550-023-02155-x Dohn´ alek, Z., Kimmel, G. A., Ayotte, P., Smith, R. S., &
-
[18]
Kay, B. D. 2003, JChPh, 118, 364, doi: 10.1063/1.1525805
-
[19]
2021, Astrophysics Source Code Library, ascl:2104.010
Dominik, C., Min, M., & Tazaki, R. 2021, Astrophysics Source Code Library, ascl:2104.010. http://ascl.net/2104.010
2021
-
[20]
2003a, ARA&A, 41, 241, doi: 10.1146/annurev.astro.41.011802.094840
Draine, B. 2003a, ARA&A, 41, 241, doi: 10.1146/annurev.astro.41.011802.094840
-
[21]
Draine, B. T. 2003b, ApJ, 598, 1017, doi: 10.1086/379118 —. 2003c, ApJ, 598, 1026, doi: 10.1086/379123
-
[22]
P., Juhasz, A., Pohl, A., et al
Dullemond, C. P., Juhasz, A., Pohl, A., et al. 2012, RADMC-3D: A multi-purpose radiative transfer tool, Astrophysics Source Code Library, record ascl:1202.015
2012
-
[23]
Evans, II, N. J. 1999, ARA&A, 37, 311, doi: 10.1146/annurev.astro.37.1.311
-
[24]
doi:10.1088/0067-0049/181/2/321 , eprint =
Evans, II, N. J., Dunham, M. M., Jørgensen, J. K., et al. 2009, ApJS, 181, 321, doi: 10.1088/0067-0049/181/2/321
-
[25]
2008, ApJS, 176, 184, doi: 10.1086/527301
Furlan, E., McClure, M., Calvet, N., et al. 2008, ApJS, 176, 184, doi: 10.1086/527301
-
[26]
Galli, P. A. B., Bouy, H., Olivares, J., et al. 2020, A&A, 643, A148, doi: 10.1051/0004-6361/202038717
-
[27]
Gerakines, P. A., Whittet, D. C. B., Ehrenfreund, P., et al. 1999, ApJ, 522, 357, doi: 10.1086/307611
-
[28]
Gibb, E., Whittet, D., Boogert, A., & Tielens, A. 2004, ApJS, 151, 35, doi: 10.1086/381182
-
[29]
Gillett, F. C., & Forrest, W. J. 1973, ApJ, 179, 483, doi: 10.1086/151888
-
[30]
Green, J. D., Yang, Y.-L., Evans, II, N. J., et al. 2016, AJ, 151, 75, doi: 10.3847/0004-6256/151/3/75
-
[31]
Gross, R. E., Yang, Y.-L., Cleeves, L. I., et al. 2025, arXiv e-prints, arXiv:2512.20820, doi: 10.48550/arXiv.2512.20820
-
[32]
Harris, C. R., Millman, K. J., van der Walt, S. J., et al. 2020, Nature, 585, 357, doi: 10.1038/s41586-020-2649-2
-
[33]
2013, Chemical Reviews, 113, 9016
Henning, T., & Semenov, D. 2013, Chemical Reviews, 113, 9016
2013
-
[34]
Heyer, M. H., & Graham, J. A. 1989, PASP, 101, 816, doi: 10.1086/132502
-
[35]
Hollenbach, D., Kaufman, M. J., Bergin, E. A., & Melnick, G. J. 2009, ApJ, 690, 1497, doi: 10.1088/0004-637X/690/2/1497
-
[36]
Tielens, A. G. G. M. 1993, ApJS, 86, 713, doi: 10.1086/191796
-
[37]
Hunter, J. D. 2007, Computing in Science & Engineering, 9, 90, doi: 10.1109/MCSE.2007.55 Jørgensen, J. K., Visser, R., Sakai, N., et al. 2013, ApJL, 779, L22, doi: 10.1088/2041-8205/779/2/L22
-
[38]
Schutte, W. A., & Whittet, D. C. B. 2001, A&A, 376, 254, doi: 10.1051/0004-6361:20010936
-
[39]
Kemper, F., Vriend, W. J., & Tielens, A. G. G. M. 2004, ApJ, 609, 826, doi: 10.1086/421339
-
[40]
Li, A., & Draine, B. T. 2001, ApJ, 554, 778, doi: 10.1086/323147
-
[41]
Loeffler, M. J., Moore, M. H., & Gerakines, P. A. 2016, ApJ, 827, 98, doi: 10.3847/0004-637X/827/2/98
-
[42]
K., Espaillat, C., Calvet, N., et al
McClure, M. K., Espaillat, C., Calvet, N., et al. 2015, ApJ, 799, 162, doi: 10.1088/0004-637X/799/2/162
-
[43]
McClure, M. K., Rocha, W. R. M., Pontoppidan, K. M., et al. 2023, Nature Astronomy, 7, 431, doi: 10.1038/s41550-022-01875-w 20
-
[44]
McKee, C. F., & Ostriker, E. C. 2007, ARA&A, 45, 565, doi: 10.1146/annurev.astro.45.051806.110602
-
[45]
Meyer, D. M., Jura, M., & Cardelli, J. A. 1998, ApJ, 493, 222, doi: 10.1086/305128
-
[46]
Min, M., Hovenier, J. W., & de Koter, A. 2005, A&A, 432, 909, doi: 10.1051/0004-6361:20041920
-
[47]
Minissale, M., Aikawa, Y., Bergin, E., et al. 2022, ACS Earth and Space Chemistry, 6, 597, doi: 10.1021/acsearthspacechem.1c00357 N¨ urnberger, D., Chini, R., & Zinnecker, H. 1997, Astronomy and Astrophysics, v. 324, p. 1036-1045, 324, 1036
-
[48]
2010, ApJL, 712, L174, doi: 10.1088/2041-8205/712/2/L174 ¨Oberg, K
Pirronello, V. 2010, ApJL, 712, L174, doi: 10.1088/2041-8205/712/2/L174 ¨Oberg, K. I., Boogert, A. C. A., Pontoppidan, K. M., et al. 2008, ApJ, 678, 1032, doi: 10.1086/533432 —. 2011a, ApJ, 740, 109, doi: 10.1088/0004-637X/740/2/109 ¨Oberg, K. I., Murray-Clay, R., & Bergin, E. A. 2011b, ApJL, 743, L16, doi: 10.1088/2041-8205/743/1/L16
-
[49]
2018, ApJL, 864, L25, doi: 10.3847/2041-8213/aad8ba
Okoda, Y., Oya, Y., Sakai, N., et al. 2018, ApJL, 864, L25, doi: 10.3847/2041-8213/aad8ba
-
[50]
2023, ApJ, 948, 127, doi: 10.3847/1538-4357/acc1e5
Okoda, Y., Oya, Y., Francis, L., et al. 2023, ApJ, 948, 127, doi: 10.3847/1538-4357/acc1e5
-
[51]
Okoda, Y., Yang, Y.-L., Evans, II, N. J., et al. 2025, ApJ, 982, 149, doi: 10.3847/1538-4357/adb83f
-
[52]
2003, ApJ, 586, 1148, doi: 10.1086/367695
Hartmann, L. 2003, ApJ, 586, 1148, doi: 10.1086/367695
-
[53]
1994, A&A, 291, 943
Ossenkopf, V., & Henning, T. 1994, A&A, 291, 943
1994
-
[54]
McCoustra, M. R. S. 2006, Physical Chemistry Chemical Physics (Incorporating Faraday Transactions), 8, 279, doi: 10.1039/B509279E pandas development team, T. 2020, pandas-dev/pandas: Pandas, latest, Zenodo, doi: 10.5281/zenodo.3509134
-
[55]
Pontoppidan, K. M., Dullemond, C. P., van Dishoeck, E. F., et al. 2005, ApJ, 622, 463, doi: 10.1086/427688
-
[56]
M., Evans, N., Bergner, J., & Yang, Y.-L
Pontoppidan, K. M., Evans, N., Bergner, J., & Yang, Y.-L. 2024, Research Notes of the American Astronomical Society, 8, 68, doi: 10.3847/2515-5172/ad303f
-
[57]
Pontoppidan, K. M., Boogert, A. C. A., Fraser, H. J., et al. 2008, ApJ, 678, 1005, doi: 10.1086/533431
-
[58]
Poteet, C. A., Megeath, S. T., Watson, D. M., et al. 2011, ApJL, 733, L32, doi: 10.1088/2041-8205/733/2/L32
-
[59]
Rayalacheruvu, P., Majumdar, L., Rocha, W. R. M., et al. 2025, arXiv e-prints, arXiv:2506.15358, doi: 10.48550/arXiv.2506.15358
-
[60]
Robitaille, T. P., Whitney, B. A., Indebetouw, R., Wood, K., & Denzmore, P. 2006, ApJS, 167, 256, doi: 10.1086/508424
-
[61]
Rocha, W. R. M., van Dishoeck, E. F., Ressler, M. E., et al. 2024, A&A, 683, A124, doi: 10.1051/0004-6361/202348427
-
[62]
Rocha, W. R. M., McClure, M. K., Sturm, J. A., et al. 2025, A&A, 693, A288, doi: 10.1051/0004-6361/202451505
-
[63]
2009, ApJ, 697, 769, doi: 10.1088/0004-637X/697/1/769
Sakai, N., Sakai, T., Hirota, T., Burton, M., & Yamamoto, S. 2009, ApJ, 697, 769, doi: 10.1088/0004-637X/697/1/769
-
[64]
Salyk, C., Yang, Y.-L., Pontoppidan, K. M., et al. 2024, ApJ, 974, 97, doi: 10.3847/1538-4357/ad62fe
-
[65]
A., Boogert, A
Schutte, W. A., Boogert, A. C. A., Tielens, A. G. G. M., et al. 1999, A&A, 343, 966
1999
-
[66]
I., & Sunyaev, R
Shakura, N. I., & Sunyaev, R. A. 1973, A&A, 24, 337
1973
-
[67]
Shirley, Y. L., Evans, II, N. J., & Rawlings, J. M. C. 2002, ApJ, 575, 337, doi: 10.1086/341286
-
[68]
Gregersen, E. M. 2000, ApJS, 131, 249, doi: 10.1086/317358
-
[69]
Shu, F. H., Adams, F. C., & Lizano, S. 1987, ARA&A, 25, 23, doi: 10.1146/annurev.aa.25.090187.000323
-
[70]
Skrutskie, M. F., Cutri, R. M., Stiening, R., et al. 2006, AJ, 131, 1163, doi: 10.1086/498708
-
[71]
Slavicinska, K., van Dishoeck, E. F., Tychoniec, L., et al. 2024, A&A, 688, A29, doi: 10.1051/0004-6361/202449785
-
[72]
Slavicinska, K., Tychoniec, L., Navarro, M. G., et al. 2025, ApJL, 986, L19, doi: 10.3847/2041-8213/addb45
-
[73]
Sturm, J. A., McClure, M. K., Bergner, J. B., et al. 2023, A&A, 677, A18, doi: 10.1051/0004-6361/202346053
-
[74]
Sturm, J. A., McClure, M. K., Harsono, D., et al. 2024, A&A, 689, A92, doi: 10.1051/0004-6361/202450865
-
[75]
Terebey, S., Shu, F. H., & Cassen, P. 1984, ApJ, 286, 529, doi: 10.1086/162628
-
[76]
J., Lai, S.-P., Ohashi, N., et al
Thieme, T. J., Lai, S.-P., Ohashi, N., et al. 2023, ApJ, 958, 60, doi: 10.3847/1538-4357/ad003a
-
[77]
Ulrich, R. K. 1976, ApJ, 210, 377, doi: 10.1086/154840 van Dishoeck, E. F., Tychoniec, L., Rocha, W. R. M., et al. 2025, A&A, 699, A361, doi: 10.1051/0004-6361/202554444
-
[78]
M., Fern´ andez-L´ opez, M., Plunkett, A., et al
Vazzano, M. M., Fern´ andez-L´ opez, M., Plunkett, A., et al. 2021, A&A, 648, A41, doi: 10.1051/0004-6361/202039228
-
[79]
Visser, R., van Dishoeck, E. F., Doty, S. D., & Dullemond, C. P. 2009, A&A, 495, 881, doi: 10.1051/0004-6361/200810846
-
[80]
Warren, S. G. 1986, ApOpt, 25, 2650, doi: 10.1364/AO.25.002650 21
discussion (0)
Sign in with ORCID, Apple, or X to comment. Anyone can read and Pith papers without signing in.