Recognition: unknown
Epidemic Extinction in a Continuous SIRS Model with Vaccination
Pith reviewed 2026-05-07 10:06 UTC · model grok-4.3
The pith
Continuous SIRS models with vaccination let epidemics persist unrealistically after the infected count falls below one person.
A machine-rendered reading of the paper's core claim, the machinery that carries it, and where it could break.
Core claim
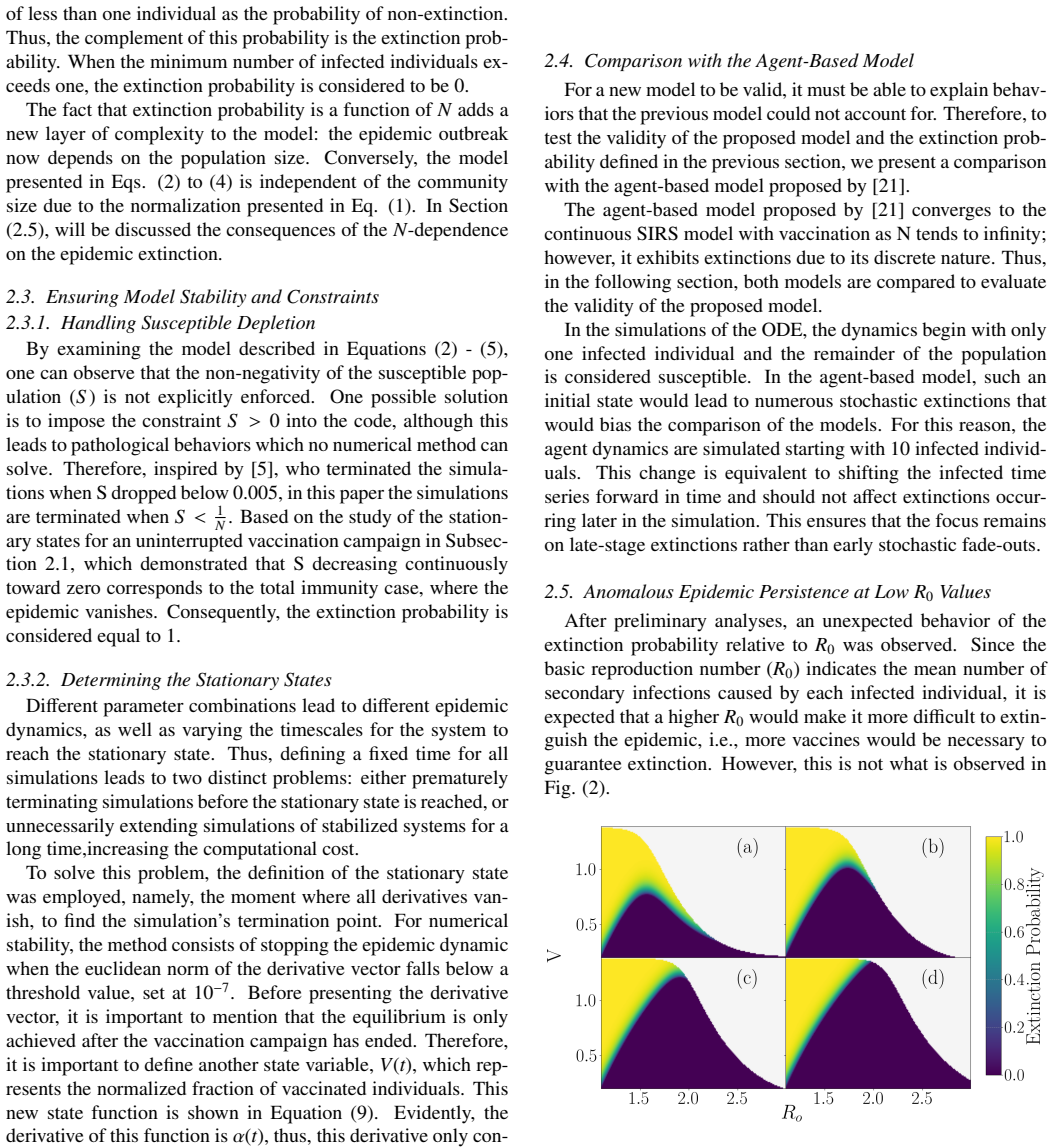
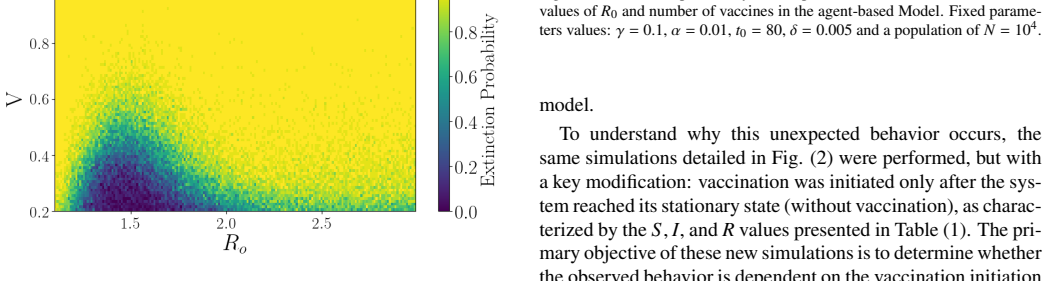
In the continuous SIRS ODE model with vaccination, the infected compartment can fall below one individual while remaining positive, allowing the epidemic to persist or generate artificial secondary waves. Parameter sweeps across infection, recovery, and waning rates identify regimes of apparent extinction versus endemicity, yet all such outcomes remain artifacts once population discreteness is considered. The authors therefore conclude that accurate prediction of epidemic fade-out demands incorporation of stochasticity or discrete effects rather than reliance on deterministic continuous dynamics.
What carries the argument
The deterministic system of three ordinary differential equations for the susceptible, infected, and recovered fractions, augmented by a vaccination rate term and a constant waning-immunity rate.
If this is right
- In regimes of rapid recovery the continuous model produces quick apparent decay followed by long nonphysical tails.
- Vaccination lowers the endemic infected level but leaves the fractional-individual artifact unchanged near extinction.
- Secondary peaks appear in the ODE trajectories after near-zero infected values, which would be impossible once infection has truly reached zero.
- Real-world fade-out thresholds are systematically mismatched by the continuous dynamics whenever infected numbers become small.
Where Pith is reading between the lines
- Forecasting tools should switch from deterministic ODEs to stochastic rules once prevalence falls below a few dozen cases to avoid overestimating outbreak length.
- Policy decisions based solely on continuous-model projections may mis-time interventions at the tail of an epidemic.
- Hybrid modeling frameworks that remain deterministic at high prevalence and become discrete or stochastic at low prevalence would better match observed extinction timing.
Load-bearing premise
The continuous ODE equations remain a valid description of epidemic dynamics even when the infected population is smaller than one person.
What would settle it
A fully stochastic individual-based simulation of the identical SIRS process with the same rates, in which the epidemic reaches exact zero infected individuals and stays extinct without secondary peaks once the last case recovers.
Figures


read the original abstract
Epidemics have shaped human history, often with devastating consequences, motivating the development of mathematical models to understand and control their dynamics. Among the many aspects of epidemic behavior, the conditions that lead to epidemic extinction stand out as a central-if not the fundamental-question in epidemic modeling. In this work, we study epidemic extinction in a continuous SIRS (Susceptible-Infected-Recovered-Susceptible) model governed by a system of ordinary differential equations (ODEs). The model includes vaccination as a time-dependent process and considers the reinfection of recovered individuals through waning immunity. We analyze how different parameter regimes -- particularly infection, recovery, and immunity loss rates -- affect the persistence or extinction of the epidemic. Special attention is given to the limitations of continuous population models, in which the infected fraction can fall below the equivalent of a single individual, leading to nonphysical outcomes such as unrealistically long persistence or artificial secondary peaks. By comparing the continuous SIRS dynamics with expected real-world thresholds for extinction, we highlight the importance of incorporating stochasticity or discrete effects to accurately describe epidemic fade-out.
Editorial analysis
A structured set of objections, weighed in public.
Referee Report
Summary. The manuscript studies epidemic extinction in a continuous SIRS model with time-dependent vaccination and waning immunity, governed by a system of ODEs. It examines the effects of infection, recovery, and immunity-loss rates on persistence versus extinction, and stresses that deterministic models permit non-physical persistence once the infected fraction drops below the equivalent of one individual. The authors compare these dynamics to real-world extinction thresholds and conclude that stochastic or discrete effects must be incorporated for realistic descriptions of epidemic fade-out.
Significance. The central observation—that mean-field ODEs break down for true extinction once I < 1/N—is a standard and load-bearing limitation of deterministic epidemic models. If the parameter-regime analysis supplies concrete, falsifiable comparisons to real-world thresholds or reproducible numerical examples, the work could usefully illustrate this point for modelers working on vaccination and fade-out scenarios. Absent new derivations or quantitative predictions, the contribution largely restates a known modeling caveat.
minor comments (3)
- The abstract states that parameter regimes are analyzed and compared to real-world thresholds, yet supplies neither the governing ODEs, specific numerical results, nor error analysis. Adding the model equations (e.g., as Eq. (1)) and at least one table or figure of extinction times versus parameters would make the claimed analysis verifiable.
- The phrase 'expected real-world thresholds for extinction' is used without citation or quantitative definition. A brief reference to classic stochastic-extinction results (e.g., branching-process approximations or Gillespie simulations) would anchor the comparison.
- The discussion of 'artificial secondary peaks' arising from non-physical persistence is mentioned but not illustrated. A single time-series plot contrasting the deterministic trajectory with a stochastic realization near the 1/N threshold would clarify the practical consequence.
Simulated Author's Rebuttal
We thank the referee for their review and for recommending minor revision. We appreciate the recognition of the importance of deterministic model limitations in epidemic fade-out and address the substantive points below.
read point-by-point responses
-
Referee: The central observation—that mean-field ODEs break down for true extinction once I < 1/N—is a standard and load-bearing limitation of deterministic epidemic models. If the parameter-regime analysis supplies concrete, falsifiable comparisons to real-world thresholds or reproducible numerical examples, the work could usefully illustrate this point for modelers working on vaccination and fade-out scenarios. Absent new derivations or quantitative predictions, the contribution largely restates a known modeling caveat.
Authors: We agree that the breakdown of mean-field ODEs below the single-individual threshold is a standard limitation. Our manuscript contributes by providing a systematic parameter-regime analysis in the specific setting of a continuous SIRS model with time-dependent vaccination and waning immunity. We present reproducible numerical simulations across ranges of infection, recovery, and immunity-loss rates that explicitly demonstrate non-physical persistence, unrealistically long epidemic duration, and artificial secondary peaks once the infected fraction falls below the equivalent of one individual. We further compare these dynamics directly to real-world extinction thresholds, yielding concrete, falsifiable examples that illustrate when and how stochastic or discrete effects become essential for vaccination-related fade-out scenarios. While we do not derive new mathematical forms of the limitation, the focused application, parameter studies, and explicit real-world comparisons supply the quantitative illustrations the referee notes would make the work useful. revision: no
Circularity Check
No significant circularity; standard mean-field analysis
full rationale
The paper sets up a conventional SIRS ODE system with time-dependent vaccination and waning immunity, then numerically integrates the deterministic equations across parameter regimes. Extinction is discussed solely by contrasting the continuous model's non-physical persistence (I(t) > 0 for all t even when I << 1/N) against the known discrete threshold of one individual; this contrast is a textbook property of mean-field approximations and is not obtained by fitting any parameter to the target outcome or by self-referential definition. No uniqueness theorems, ansatzes, or predictions are introduced that reduce to the model's own inputs by construction, and the manuscript contains no self-citations that bear load on the central claim.
Axiom & Free-Parameter Ledger
axioms (1)
- domain assumption Epidemic dynamics are governed by a system of ordinary differential equations for S, I, R compartments with time-dependent vaccination.
Reference graph
Works this paper leans on
-
[1]
Pulse mass measles vaccina- tion across age cohorts
Agur, Z., Cojocaru, L., Mazor, G., Anderson, R.M., Danon, Y .L., 1993. Pulse mass measles vaccina- tion across age cohorts. Proceedings of the Na- tional Academy of Sciences 90, 11698–11702. URL: https://www.pnas.org/doi/10.1073/pnas.90.24.11698, doi:10.1073/pnas.90.24.11698
-
[2]
Arenas, A., Cota, W., Gómez-Gardeñes, J., Gómez, S., Granell, C., Matamalas, J.T., Soriano-Paños, D., Steinegger, B., 2020. Modeling the spa- tiotemporal epidemic spreading of covid-19 and the impact of mobility and social distancing in- terventions. Phys. Rev. X 10, 041055. URL: https://link.aps.org/doi/10.1103/PhysRevX.10.041055, doi:10.1103/PhysRevX.10.041055
-
[3]
Measles periodicity and community size
Bartlett, M.S., 1957. Measles periodicity and community size. Journal of the Royal Statistical Society. Series A (General) 120, 48–70. doi:10.2307/2342553
-
[4]
A discrete-time susceptible-infectious-recovered- susceptible model for the analysis of influenza data
Bucyibaruta, G., Dean, C.B., Torabi, M., 2023. A discrete-time susceptible-infectious-recovered- susceptible model for the analysis of influenza data. Infectious Disease Modelling 8, 471–483
2023
-
[5]
Rebound in epidemic control: how misaligned vaccination timing amplifies infec- tion peaks
Castioni, P., Gómez, S., Granell, C., Arenas, A., 2024. Rebound in epidemic control: how misaligned vaccination timing amplifies infec- tion peaks. npj Complexity 1, 20. URL: https://doi.org/10.1038/s44260-024-00020-0, doi:10.1038/s44260-024-00020-0
-
[6]
Costantino, V ., Trent, M., MacIntyre, C.R., 2019. Modelling of optimal timing for influenza vaccination as a function of intraseasonal waning of immunity and vaccine coverage. Vaccine 37, 6768–6775. URL: https://doi.org/10.1016/j.vaccine.2019.08.069, doi:10.1016/j.vaccine.2019.08.069
-
[7]
Optimal timing of one-shot interventions for epidemic con- trol
Di Lauro, F., Kiss, I.Z., Miller, J.C., 2021. Optimal timing of one-shot interventions for epidemic con- trol. PLOS Computational Biology 17, 1–25. URL: https://doi.org/10.1371/journal.pcbi.1008763, doi:10.1371/journal.pcbi.1008763
-
[8]
Sirs epi- demics with individual heterogeneity of immunity wan- ing
El Khalifi, M., Britton, T., 2024. Sirs epi- demics with individual heterogeneity of immunity wan- ing. Journal of Theoretical Biology 605, 111815. doi:10.1016/j.jtbi.2024.111815
-
[9]
Evolution of antibody immunity to SARS-CoV-2
Gaebler, C., Wang, Z., Lorenzi, J.C.C., Muecksch, F., Finkin, S., Tokuyama, M., Cho, A., Jankovic, M., Schaefer-Babajew, D., Oliveira, T.Y ., Cipolla, M., Viant, C., Barnes, C.O., Bram, Y ., Breton, G., Hägglöf, T., Mendoza, P., Hurley, A., Turroja, M., Gordon, K., others, Nussenzweig, M.C., 2021. Evolution of antibody immunity to SARS-CoV-2. Nature 591, ...
-
[10]
Digital Image Pro- cessing
Gonzalez, R.C., Woods, R.E., 2018. Digital Image Pro- cessing. 4th ed., Pearson, New York, NY
2018
-
[11]
Os- cillations in sirs model with distributed delays
Gonçalves, S., Abramson, G., Gomes, M.F.C., 2011. Os- cillations in sirs model with distributed delays. The Euro- pean Physical Journal B: Condensed Matter and Complex Systems 81, 363–371. 8
2011
-
[12]
The mathematics of infectious dis- eases
Hethcote, H.W., 2000. The mathematics of infectious dis- eases. SIAM review 42, 599–653
2000
-
[13]
Mitigation strategies for pandemic influenza a: Balancing conflicting policy objectives
Hollingsworth, T.D., Klinkenberg, D., Heesterbeek, H., Anderson, R.M., 2011. Mitigation strategies for pandemic influenza a: Balancing conflicting policy objectives. PLOS Computational Biology 7, 1–11. URL: https://doi.org/10.1371/journal.pcbi.1001076, doi:10.1371/journal.pcbi.1001076
-
[14]
Major in- fectious diseases: Key messages from disease control pri- orities, third edition, in: Major Infectious Diseases
Holmes, K.K., Bertozzi, S., Bloom, B.R., Jha, P., Gel- band, H., DeMaria, L.M., Horton, S., 2017. Major in- fectious diseases: Key messages from disease control pri- orities, third edition, in: Major Infectious Diseases. The International Bank for Reconstruction and Development/ The World Bank
2017
-
[15]
Modeling Infectious Diseases in Humans and Animals
Keeling, M.J., Rohani, P., 2008. Modeling Infectious Diseases in Humans and Animals. Princeton University Press, Princeton
2008
-
[16]
Maier, B.F., Brockmann, D., 2020. Effective containment explains subexponential growth in recent confirmed covid-19 cases in china. Science 368, 742–746. URL: https://www.science.org/doi/abs/10.1126/science.abb4557, doi:10.1126/science.abb4557
-
[17]
Potential benefits of de- laying the second mrna covid-19 vaccine dose
Maier, B.F., Burdinski, A., Rose, A.H., Schlosser, F., Hinrichs, D., Betsch, C., Korn, L., Sprengholz, P., Meyer-Hermann, M., Mitra, T., Lauterbach, K., Brockmann, D., 2021. Potential benefits of de- laying the second mrna covid-19 vaccine dose. URL:https://arxiv.org/abs/2102.13600, doi:10.48550/arXiv.2102.13600,arXiv:2102.13600
-
[18]
Markov, P.V ., Ghafari, M., Beer, M., Lythgoe, K., Simmonds, P., Stilianakis, N.I., Katzourakis, A., 2023. The evolution of SARS-CoV-2. Na- ture Reviews Microbiology 21, 361–379. URL: https://doi.org/10.1038/s41579-023-00878-2, doi:10.1038/s41579-023-00878-2
-
[19]
Vaccination and non-pharmaceutical interventions for COVID-19: a mathematical modelling study
Moore, S., Hill, E.M., Tildesley, M.J., Dyson, L., Keel- ing, M.J., 2021. Vaccination and non-pharmaceutical interventions for COVID-19: a mathematical modelling study. The Lancet Infectious Diseases 21, 793–802. URL: https://doi.org/10.1016/S1473-3099(21)00143-2, doi:10.1016/S1473-3099(21)00143-2
-
[20]
Murray, J.D., 1993. Mathematical Biology. Springer Berlin Heidelberg, Berlin, Heidelberg. URL: http://link.springer.com/10.1007/978-3-662-08542-4, doi:10.1007/978-3-662-08542-4
-
[21]
Vaccina- tion campaigns and epidemic rebounds
Pablo Silvestrin, Germano Brill, S.G., 2025. Vaccina- tion campaigns and epidemic rebounds. Trabalho de Con- clusão de Curso IF-UFRGS and private communication
2025
-
[22]
Safan, M., Kretzschmar, M., Hadeler, K.P., 2012. Vacci- nation based control of infections in sirs models with rein- fection: special reference to pertussis. Journal of Mathe- matical Biology 240, 205–214. doi:10.1007/s00285-012- 0582-1
-
[23]
Evasion of innate and adaptive immune responses by influenza a virus
Schmolke, M., García-Sastre, A., 2010. Evasion of innate and adaptive immune responses by influenza a virus. Cellular Microbiology 12, 873–880. URL: https://doi.org/10.1111/j.1462-5822.2010.01475.x, doi:10.1111/j.1462-5822.2010.01475.x
-
[24]
Cor- relation coefficients: Appropriate use and interpre- tation
Schober, P., Boer, C., Schwarte, L.A., 2018. Cor- relation coefficients: Appropriate use and interpre- tation. Anesthesia & Analgesia 126, 1763–1768. doi:10.1213/ANE.0000000000002864
-
[25]
Optimizing infectious disease interventions during an emerging epidemic
Wallinga, J., van Boven, M., Lipsitch, M., 2010. Optimizing infectious disease interventions during an emerging epidemic. Proceedings of the Na- tional Academy of Sciences 107, 923–928. URL: https://www.pnas.org/doi/10.1073/pnas.0908491107, doi:10.1073/pnas.0908491107
-
[26]
Studying the impacts of variant evolution for a generalized age-group transmission model
Wei, F., Zhou, R., Jin, Z., Sun, Y ., Peng, Z., et al., 2024. Studying the impacts of variant evolution for a generalized age-group transmission model. PLOS ONE 19, e0306554. doi:10.1371/journal.pone.0306554
-
[27]
Modeling covid-19 dynamics in illinois under nonpharmaceuti- cal interventions
Wong, G.N., Weiner, Z.J., Tkachenko, A.V ., Elbanna, A., Maslov, S., Goldenfeld, N., 2020. Modeling covid-19 dynamics in illinois under nonpharmaceuti- cal interventions. Phys. Rev. X 10, 041033. URL: https://link.aps.org/doi/10.1103/PhysRevX.10.041033, doi:10.1103/PhysRevX.10.041033
-
[28]
Who coro- navirus (covid-19) dashboard: deaths
World Health Organization, 2026. Who coro- navirus (covid-19) dashboard: deaths. URL: https://data.who.int/dashboards/covid19/deaths
2026
-
[29]
Covid- 19 coronavirus pandemic
Worldometer, 2025. Covid- 19 coronavirus pandemic. URL: https://www.worldometers.info/coronavirus/
2025
-
[30]
You, C., Deng, Y ., Hu, W., Sun, J., Lin, Q., Zhou, F., Pang, C.H., Zhang, Y ., Chen, Z., Zhou, X.H.,
-
[31]
International Jour- nal of Hygiene and Environmental Health 228, 113555
Estimation of the time-varying reproduction num- ber of covid-19 outbreak in china. International Jour- nal of Hygiene and Environmental Health 228, 113555. doi:10.1016/j.ijheh.2020.113555. 9
discussion (0)
Sign in with ORCID, Apple, or X to comment. Anyone can read and Pith papers without signing in.