Recognition: unknown
ZAYAN: Disentangled Contrastive Transformer for Tabular Remote Sensing Data
Pith reviewed 2026-05-07 06:35 UTC · model grok-4.3
The pith
By contrasting features rather than samples with a zero-anchor setup, ZAYAN creates disentangled embeddings that raise accuracy on tabular remote sensing data.
A machine-rendered reading of the paper's core claim, the machinery that carries it, and where it could break.
Core claim
ZAYAN is a self-supervised, feature-centric contrastive framework for tabular data. ZAYAN performs contrastive learning at the feature rather than sample level, removing the need for explicit anchor selection and any reliance on class labels, while encouraging a redundancy-minimized, disentangled embedding space. The framework has two modules: ZAYAN-CL, which pretrains feature embeddings via a zero-anchor contrastive objective with dynamic perturbations and masking, and ZAYAN-T, a Transformer that conditions on these embeddings for downstream classification. Across eight datasets, including six remote-sensing tabular benchmarks and two remote-sensing-driven flood-prediction tables from卫星 and
What carries the argument
The zero-anchor contrastive objective with dynamic perturbations and masking applied at the feature level to produce redundancy-minimized, disentangled embeddings that feed a Transformer for classification.
If this is right
- Tabular deep learning for remote sensing can be pretrained effectively without any class labels to reach higher classification accuracy.
- Dynamic perturbations and masking at the feature level reduce redundancy that is common in heterogeneous sensing data.
- Gains from the approach remain consistent when labeled examples are scarce or when training and test distributions differ.
- Removing the need for explicit anchor selection makes contrastive pretraining simpler to apply to tabular sensing tables.
Where Pith is reading between the lines
- The same feature-level contrastive recipe could be adapted to tabular data in other domains that suffer from feature redundancy, such as medical or financial records.
- Pairing the disentangled embeddings with satellite image or time-series inputs could strengthen multi-modal remote sensing models.
- Scaling the method to much larger tabular sensing collections would test whether the disentanglement benefit holds without added compute cost.
- The observed robustness to distribution shift points to possible use in ongoing environmental monitoring where conditions evolve.
Load-bearing premise
That contrastive learning at the feature level with zero-anchor dynamic perturbations and masking will produce a redundancy-minimized disentangled embedding space that improves downstream classification without class labels or explicit anchor selection.
What would settle it
On the same eight datasets, a standard supervised Transformer or other tabular baseline matching or exceeding ZAYAN accuracy under low-label and distribution-shift conditions would falsify the central claim.
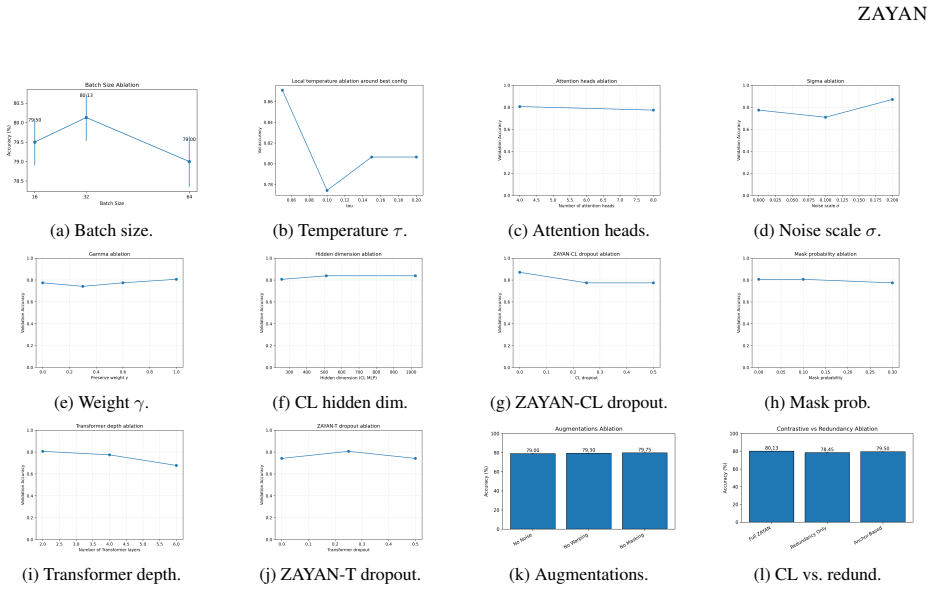
Figures


read the original abstract
Learning informative representations from tabular data in remote sensing and environmental science is challenging due to heterogeneity, scarce labels, and redundancy among features. We present ZAYAN (Zero-Anchor dYnamic feAture eNcoding), a self-supervised, feature-centric contrastive framework for tabular data. ZAYAN performs contrastive learning at the feature rather than sample level, removing the need for explicit anchor selection and any reliance on class labels, while encouraging a redundancy-minimized, disentangled embedding space. The framework has two modules: ZAYAN-CL, which pretrains feature embeddings via a zero-anchor contrastive objective with dynamic perturbations and masking, and ZAYAN-T, a Transformer that conditions on these embeddings for downstream classification. Across eight datasets, including six remote-sensing tabular benchmarks and two remote-sensing-driven flood-prediction tables from satellite and GIS products, ZAYAN achieves superior accuracy, robustness, and generalization over tabular deep learning baselines, with consistent gains under label scarcity and distribution shift. These results indicate that feature-level contrastive learning and dynamic feature encoding provide an effective recipe for learning from tabular sensing data.
Editorial analysis
A structured set of objections, weighed in public.
Referee Report
Summary. The manuscript introduces ZAYAN, a self-supervised contrastive framework for tabular remote sensing data. ZAYAN-CL performs feature-level contrastive pretraining via a zero-anchor objective that uses dynamic perturbations and masking to produce redundancy-minimized, disentangled embeddings without class labels or explicit anchors. ZAYAN-T then conditions a Transformer on these embeddings for downstream classification. The paper claims superior accuracy, robustness, and generalization over tabular deep learning baselines across eight remote-sensing datasets (including flood-prediction tables), with consistent gains under label scarcity and distribution shift.
Significance. If the empirical gains prove reproducible and the perturbation mechanism is shown to be semantically valid for heterogeneous features, the work could provide a useful recipe for self-supervised representation learning on tabular sensing data, where labels are scarce and features exhibit redundancy and mixed types. The feature-centric (rather than sample-centric) contrastive design and zero-anchor formulation are conceptually interesting for avoiding anchor selection. The application focus on remote-sensing benchmarks and flood prediction adds practical relevance.
major comments (3)
- [§3.2] §3.2 (ZAYAN-CL): The dynamic perturbation and masking strategy is described as generating positive pairs for the zero-anchor contrastive objective, but no type-aware handling is specified for heterogeneous features (continuous spectral indices, categorical land-cover classes, GIS variables). Uniform application risks invalid transformations (e.g., additive noise on discrete variables), which directly undermines the claim that the resulting embeddings are disentangled and improve downstream performance. An ablation isolating this component is required.
- [§4] §4 (Experiments): The central claim of superior accuracy, robustness, and generalization is asserted across eight datasets with gains under label scarcity and distribution shift, yet the text supplies no list of exact baselines, hyperparameter tuning protocol, number of random seeds, error bars, or statistical tests. This information is load-bearing for evaluating whether the data support the performance claims.
- [Table 1] Table 1 (main results): Reported accuracy improvements lack standard deviations or confidence intervals from multiple runs, making it impossible to determine whether the observed gains are statistically reliable or could arise from variance.
minor comments (3)
- [Abstract] Abstract: The eight datasets are not named or characterized (e.g., number of features, class imbalance), which would aid immediate assessment of the scope of the claims.
- [§2] §2 (Related Work): Additional citations to recent tabular contrastive methods (e.g., extensions of SimCLR or Barlow Twins to tables) would strengthen the positioning of the zero-anchor novelty.
- [Figure 1] Figure 1 (architecture): The diagram does not label the dynamic perturbation and masking modules explicitly, reducing clarity of the data flow.
Simulated Author's Rebuttal
We thank the referee for the constructive and detailed feedback. We appreciate the opportunity to clarify aspects of ZAYAN and strengthen the manuscript. We address each major comment below and will revise the paper accordingly.
read point-by-point responses
-
Referee: [§3.2] §3.2 (ZAYAN-CL): The dynamic perturbation and masking strategy is described as generating positive pairs for the zero-anchor contrastive objective, but no type-aware handling is specified for heterogeneous features (continuous spectral indices, categorical land-cover classes, GIS variables). Uniform application risks invalid transformations (e.g., additive noise on discrete variables), which directly undermines the claim that the resulting embeddings are disentangled and improve downstream performance. An ablation isolating this component is required.
Authors: We agree that the manuscript does not explicitly describe type-aware handling of heterogeneous features in §3.2. We will revise this section to detail our perturbation strategy, which applies feature-type-specific operations (Gaussian noise scaled to standard deviation for continuous variables such as spectral indices; random masking or replacement from the empirical distribution for categorical variables such as land-cover classes; and appropriate scaling for GIS variables). We will also add an ablation study in §4 that isolates the contribution of the dynamic perturbation and masking component to embedding disentanglement and downstream accuracy. revision: yes
-
Referee: [§4] §4 (Experiments): The central claim of superior accuracy, robustness, and generalization is asserted across eight datasets with gains under label scarcity and distribution shift, yet the text supplies no list of exact baselines, hyperparameter tuning protocol, number of random seeds, error bars, or statistical tests. This information is load-bearing for evaluating whether the data support the performance claims.
Authors: We agree that these experimental details are essential for reproducibility and for rigorously supporting the performance claims. The complete list of baselines, hyperparameter search protocol, number of random seeds, and statistical tests are currently provided only in the appendix. We will expand §4 with a concise summary of the full experimental protocol (including baselines, tuning procedure, seeds, and tests) and will ensure that error bars and significance results are referenced in the main text. revision: yes
-
Referee: [Table 1] Table 1 (main results): Reported accuracy improvements lack standard deviations or confidence intervals from multiple runs, making it impossible to determine whether the observed gains are statistically reliable or could arise from variance.
Authors: We acknowledge that Table 1 (and related result tables) currently omit measures of variability. We will update these tables to report mean performance ± standard deviation computed over five independent runs with different random seeds. We will additionally include p-values from paired statistical tests against the baselines to demonstrate that the reported gains are statistically reliable. revision: yes
Circularity Check
No circularity detected in ZAYAN derivation chain
full rationale
The paper describes ZAYAN as a self-supervised feature-centric contrastive framework consisting of ZAYAN-CL (zero-anchor objective with dynamic perturbations and masking) and ZAYAN-T (Transformer for downstream classification). These components are introduced as architectural design choices, not as outputs of a derivation that reduces to its own inputs. No equations, fitted parameters renamed as predictions, or self-referential definitions appear in the provided text. Performance claims rest on empirical results across eight datasets rather than on any mathematical chain that loops back by construction. Self-citations, if present in the full manuscript, are not shown to be load-bearing for the core claims. The framework is self-contained as a proposed method with external validation, satisfying the criteria for a non-circular finding.
Axiom & Free-Parameter Ledger
Reference graph
Works this paper leans on
-
[1]
Abiodun, O.K.: Flood Dataset (2024), kaggle dataset
2024
-
[2]
Akiba, T., et al.: Optuna: A Next-Generation Hyperparameter Optimization Framework. In: KDD. pp. 2623–2631 (2019)
2019
-
[3]
In: CVPR
Akiva, P., et al.: Self-Supervised Material and Texture Representation Learning for Remote Sensing Tasks. In: CVPR. pp. 8203–8215 (2022)
2022
-
[4]
Alosaimi, N., et al.: Self-Supervised Learning for Remote Sensing Scene Classification under the Few Shot Scenario. Sci. Rep.13(1), 433 (2023)
2023
-
[5]
UCI ML Repository (2020)
Anonymous: Crop Mapping Using Fused Optical-Radar Data Set. UCI ML Repository (2020)
2020
-
[6]
In: AAAI
Arik, S.Ö., Pfister, T.: TabNet: Attentive Interpretable Tabular Learning. In: AAAI. vol. 35, pp. 6679–6687 (2021)
2021
-
[7]
In: ICCV
Ayush, K., et al.: Geography-aware Self-Supervised Learning. In: ICCV. pp. 10181–10190 (2021)
2021
-
[8]
In: ICLR (2022)
Bahri, D., et al.: SCARF: Self-Supervised Contrastive Learning using Random Feature Corruption. In: ICLR (2022)
2022
-
[9]
Chen, T., Guestrin, C.: XGBoost: A Scalable Tree Boosting System. In: KDD. pp. 785–794. ACM (2016)
2016
-
[10]
In: ICML
Chen, T., et al.: A Simple Framework for Contrastive Learning of Visual Representations. In: ICML. pp. 1597–1607 (2020) 11 ZAYAN
2020
-
[11]
NeurIPS 35, 197–211 (2022)
Cong, Y ., et al.: SatMAE: Pre-Training Transformers for Temporal and Multi-Spectral Satellite Imagery. NeurIPS 35, 197–211 (2022)
2022
-
[12]
Demšar, J.: Statistical Comparisons of Classifiers Over Multiple Data Sets. J. Mach. Learn. Res.7(Jan), 1–30 (2006)
2006
-
[13]
Mathematical Program- ming91(2), 201–213 (2002)
Dolan, E.D., Moré, J.J.: Benchmarking Optimization Software with Performance Profiles. Mathematical Program- ming91(2), 201–213 (2002)
2002
-
[14]
Ducey, M.J., et al.: The Influence of Human Demography on Land Cover Change in the Great Lakes States, USA. Environ. Manage.62(6), 1089–1107 (2018)
2018
-
[15]
Freund, Y ., Schapire, R.E.: A Decision-Theoretic Generalization of On-Line Learning and an Application to Boosting. J. Comput. Syst. Sci.55(1), 119–139 (1997)
1997
-
[16]
Friedman, J.H.: Greedy Function Approximation: A Gradient Boosting Machine. Ann. Stat.29(5), 1189–1232 (2001)
2001
-
[17]
Friedman, M.: The Use of Ranks to Avoid the Assumption of Normality Implicit in the Analysis of Variance. J. Amer. Stat. Assoc.32(200), 675–701 (1937)
1937
-
[18]
NeurIPS34, 18932–18943 (2021)
Gorishniy, Y ., et al.: Revisiting Deep Learning Models for Tabular Data. NeurIPS34, 18932–18943 (2021)
2021
-
[19]
NeurIPS35, 24991–25004 (2022)
Gorishniy, Y ., et al.: On Embeddings for Numerical Features in Tabular Deep Learning. NeurIPS35, 24991–25004 (2022)
2022
-
[20]
In: ICLR (2024)
Gorishniy, Y ., et al.: TabR: Tabular Deep Learning Meets Nearest Neighbors. In: ICLR (2024)
2024
-
[21]
In: ICLR (2025)
Gorishniy, Y ., et al.: TabM: Advancing Tabular Deep Learning with Parameter-Efficient Ensembling. In: ICLR (2025)
2025
-
[22]
In: IJCAI (2017)
Guo, H., et al.: DeepFM: A Factorization-Machine based Neural Network for CTR Prediction. In: IJCAI (2017)
2017
-
[23]
In: ICPR
Habib, A.Z.S.B., et al.: TabSeq: A Framework for Deep Learning on Tabular Data via Sequential Ordering. In: ICPR. pp. 418–434. Springer (2024)
2024
-
[24]
Harvard Dataverse Repository: Census of Individual Trees (2025), kaggle dataset
2025
-
[25]
In: CVPR
He, K., et al.: Deep Residual Learning for Image Recognition. In: CVPR. pp. 770–778 (2016)
2016
-
[26]
In: NeurIPS TableRep Wkshp (2022)
Hollmann, N., et al.: TabPFN: A Transformer That Solves Small Tabular Classification Problems in a Second. In: NeurIPS TableRep Wkshp (2022)
2022
-
[27]
Nature637(8045), 319–326 (2025)
Hollmann, N., et al.: Accurate Predictions on Small Data with a Tabular Foundation Model. Nature637(8045), 319–326 (2025)
2025
-
[28]
TabTransformer: Tabular Data Modeling Using Contextual Embeddings
Huang, X., et al.: TabTransformer: Tabular Data Modeling Using Contextual Embeddings. arXiv:2012.06678 (2020)
work page internal anchor Pith review arXiv 2012
-
[29]
Jain, U., et al.: Multimodal Contrastive Learning for Remote Sensing Tasks. arXiv:2209.02329 (2022)
-
[30]
In: ICLR (2023)
Jeffares, A., et al.: TANGOS: Regularizing Tabular Neural Networks through Gradient Orthogonalization and Specialization. In: ICLR (2023)
2023
-
[31]
In: ICML
Jiang, X., et al.: ProtoGate: Prototype-based Neural Networks with Global-to-local Feature Selection for Tabular Biomedical Data. In: ICML. pp. 21844–21878 (2024)
2024
-
[32]
Remote Sens.11(24), 2971 (2019)
Jin, S., et al.: Overall Methodology Design for the United States National Land Cover Database 2016 products. Remote Sens.11(24), 2971 (2019)
2016
-
[33]
UCI ML Repository (2012)
Johnson, B.: Forest Type Mapping. UCI ML Repository (2012)
2012
-
[34]
UCI ML Repository (2013)
Johnson, B.: Urban Land Cover. UCI ML Repository (2013)
2013
-
[35]
UCI ML Repository (2013)
Johnson, B.: Wilt. UCI ML Repository (2013)
2013
-
[36]
ISPRS Int
Johnson, B.A.: Remote Sensing Image Fusion at the Segment Level Using a Spatially-Weighted Approach: Applications for Land Cover Spectral Analysis and Mapping. ISPRS Int. J. Geo-Inf.4(1), 172–184 (2015)
2015
-
[37]
Johnson, B.A., Iizuka, K.: Integrating OpenStreetMap Crowdsourced Data and Landsat Time-Series Imagery for Rapid Land Use/Land Cover (LULC) Mapping. Appl. Geogr.67, 140–149 (2016)
2016
-
[38]
Remote Sens.11(17), 1713 (2019)
Jozdani, S.E., et al.: Comparing Deep Neural Networks, Ensemble Classifiers, and Support Vector Machine Algorithms for Object-based Urban Land Use/Land Cover Classification. Remote Sens.11(17), 1713 (2019)
2019
-
[39]
NeurIPS30(2017)
Ke, G., et al.: LightGBM: A Highly Efficient Gradient Boosting Decision Tree. NeurIPS30(2017)
2017
-
[40]
Ma´ckiewicz, A., Ratajczak, W.: Principal Components Analysis (PCA). Comput. Geosci.19(3), 303–342 (1993) 12 ZAYAN
1993
-
[41]
In: CVPR
Mall, U., et al.: Change-aware Sampling and Contrastive Learning for Satellite Images. In: CVPR. pp. 5261–5270 (2023)
2023
-
[42]
In: ICCV
Manas, O., et al.: Seasonal Contrast: Unsupervised Pre-Training from Uncurated Remote Sensing Data. In: ICCV. pp. 9414–9423 (2021)
2021
-
[43]
von Mehren, M., et al.: Massively-Parallel Break Detection for Satellite Data. arXiv:1807.01751 (2018)
-
[44]
Water10(11), 1536 (2018)
Mosavi, A., et al.: Flood Prediction Using Machine Learning Models: Literature Review. Water10(11), 1536 (2018)
2018
-
[45]
In: NeurIPS (2025)
Naor, E., Lindenbaum, O.: Hybrid Autoencoders for Tabular Data: Leveraging Model-Based Augmentation in Low-Label Settings. In: NeurIPS (2025)
2025
-
[46]
Princeton University (1963)
Nemenyi, P.B.: Distribution-Free Multiple Comparisons. Princeton University (1963)
1963
-
[47]
In: ICLR (2020)
Popov, S., et al.: Neural Oblivious Decision Ensembles for Deep Learning on Tabular Data. In: ICLR (2020)
2020
-
[48]
NeurIPS31(2018)
Prokhorenkova, L., et al.: CatBoost: Unbiased Boosting with Categorical Features. NeurIPS31(2018)
2018
-
[49]
In: ICML (2025)
QU, J., et al.: TabICL: A Tabular Foundation Model for In-Context Learning on Large Data. In: ICML (2025)
2025
-
[50]
Reda, M.: Satellite Image Classification (2025), kaggle dataset
2025
-
[51]
Remote Sens
Sánchez-Mejía, G.E., et al.: Status of Phenological Research Using Sentinel-2 Data: A Review. Remote Sens. 12(17), 2760 (2020)
2020
-
[52]
Sidrane, C., et al.: Machine Learning for Generalizable Prediction of Flood Susceptibility. arXiv:1910.06521 (2019)
-
[53]
In: NeurIPS TableRep Wkshp (2022)
Somepalli, G., et al.: SAINT: Improved Neural Networks for Tabular Data via Row Attention and Contrastive Pre-Training. In: NeurIPS TableRep Wkshp (2022)
2022
-
[54]
In: CIKM
Song, W., et al.: AutoInt: Automatic Feature Interaction Learning via Self-Attentive Neural Networks. In: CIKM. pp. 1161–1170 (2019)
2019
-
[55]
Stival, L., et al.: Semantically-Aware Contrastive Learning for Multispectral Remote Sensing Images. ISPRS J. Photogramm. Remote Sens.223, 173–187 (2025)
2025
-
[56]
In: CVPR
Stojnic, V ., Risojevic, V .: Self-Supervised Learning of Remote Sensing Scene Representations Using Contrastive Multiview Coding. In: CVPR. pp. 1182–1191 (2021)
2021
-
[57]
Surya, J., Warner: Flood Risk in India (2025), kaggle dataset
2025
-
[58]
In: 5th MusIML Wkshp (NeurIPS 2025) (2025)
Tabasum, M., et al.: Tabular Deep Learning vs Classical Machine Learning for Urban Land Cover Classification. In: 5th MusIML Wkshp (NeurIPS 2025) (2025)
2025
-
[59]
NeurIPS36, 20054– 20066 (2023)
Tang, M., et al.: Cross-Scale MAE: A Tale of Multiscale Exploitation in Remote Sensing. NeurIPS36, 20054– 20066 (2023)
2023
-
[60]
In: NeurIPS Efficient NLP/Speech Wkshp
Thielmann, A.F., Samiee, S.: On the Efficiency of NLP-Inspired Methods for Tabular Deep Learning. In: NeurIPS Efficient NLP/Speech Wkshp. pp. 532–539 (2024)
2024
-
[61]
IEEE Trans
Tian, J., et al.: SwiMDiff: Scene-wide Matching Contrastive Learning with Diffusion Constraint for Remote Sensing Image. IEEE Trans. Geosci. Remote Sens.62, 1–13 (2024)
2024
-
[62]
Wang, R., et al.: Deep & Cross Network for Ad Click Predictions. In: KDD. pp. 1–7 (2017)
2017
-
[63]
Machine Learning 114(1), 16 (2025)
Wang, W.Y ., et al.: A Survey on Self-Supervised Learning for Non-Sequential Tabular Data. Machine Learning 114(1), 16 (2025)
2025
-
[64]
IEEE Geosci
Wang, Y ., et al.: Self-Supervised Learning in Remote Sensing: A Review. IEEE Geosci. Remote Sens. Mag.10(4), 213–247 (2022)
2022
-
[65]
Wang, Z., et al.: Flood Hazard Risk Assessment Model Based on Random Forest. J. Hydrol.527, 1130–1141 (2015)
2015
-
[66]
Remote Sens.6(8), 7424–7441 (2014)
Wickham, J., et al.: The Multi-Resolution Land Characteristics (MRLC) Consortium-20 Years of Development and Integration of USA National Land Cover Data. Remote Sens.6(8), 7424–7441 (2014)
2014
-
[67]
Yadav, R., et al.: Attentive Dual Stream Siamese U-net for Flood Detection on Multi-temporal Sentinel-1 Data. arXiv:2204.09387 (2022)
-
[68]
Yoon, J., et al.: VIME: Extending the Success of Self-and Semi-Supervised Learning to Tabular Domain. NeurIPS 33, 11033–11043 (2020) 13 ZAYAN Supplementary Material ZAY AN: Disentangled Contrastive Transformer for Tabular Remote Sensing Data2 This supplementary document supports our main paperZAYAN: Disentangled Contrastive Transformer for Tabular Remote ...
discussion (0)
Sign in with ORCID, Apple, or X to comment. Anyone can read and Pith papers without signing in.