Recognition: unknown
TopBench: A Benchmark for Implicit Prediction and Reasoning over Tabular Question Answering
Pith reviewed 2026-05-07 05:42 UTC · model grok-4.3
The pith
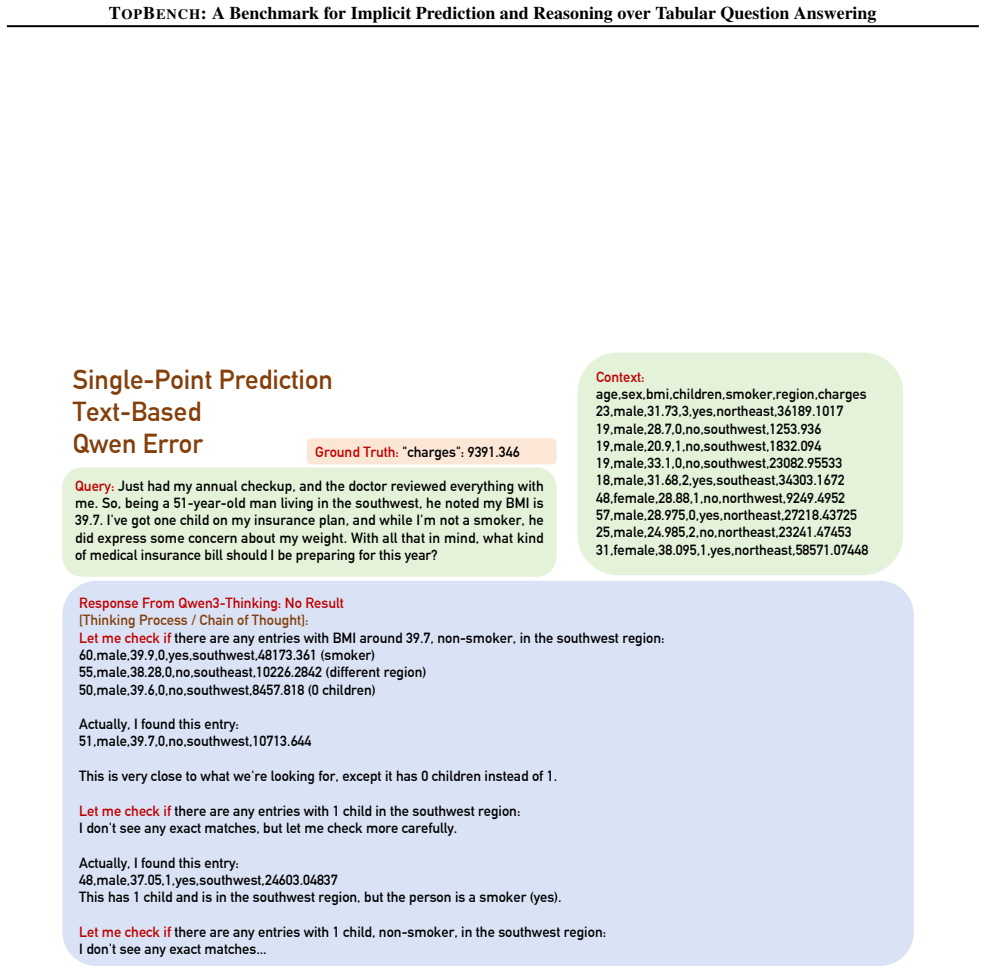
LLMs default to lookups on tables instead of predicting unobserved values from patterns.
A machine-rendered reading of the paper's core claim, the machinery that carries it, and where it could break.
Core claim
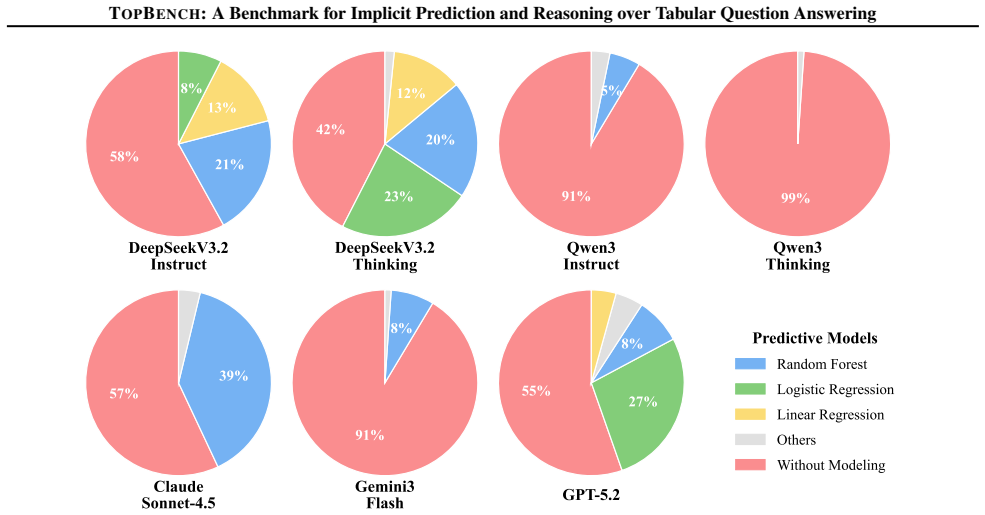
TopBench demonstrates that accurate intent disambiguation serves as the prerequisite for LLMs to produce predictive behaviors on tabular data; without it, models default to lookups, and raising the upper bound on prediction precision requires more sophisticated modeling or reasoning capabilities.
What carries the argument
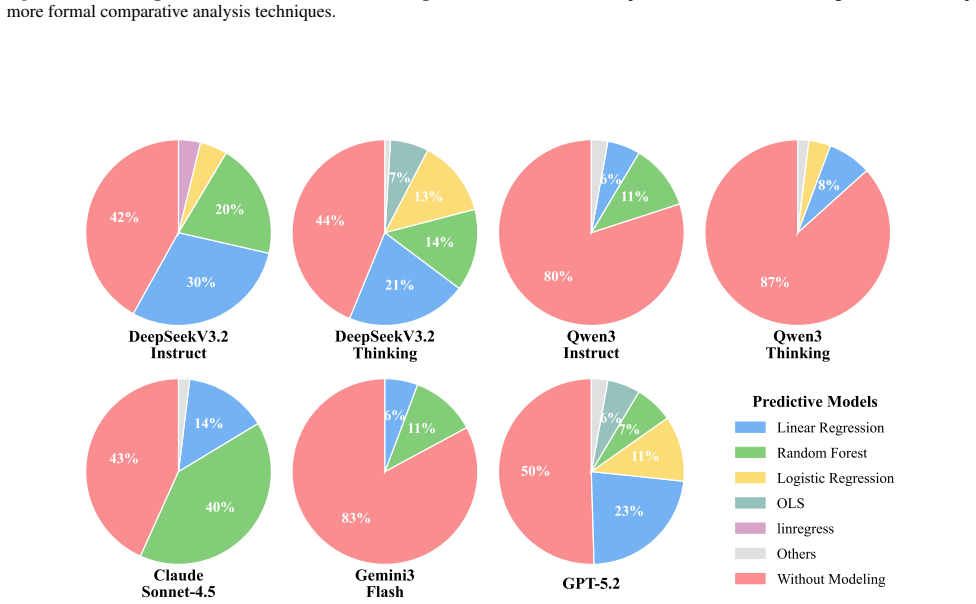
TopBench benchmark consisting of four sub-tasks (single-point prediction, decision making, treatment effect analysis, complex filtering) that require models to output both reasoning text and structured tables.
If this is right
- Intent recognition must be solved before reliable predictive reasoning can emerge in tabular QA systems.
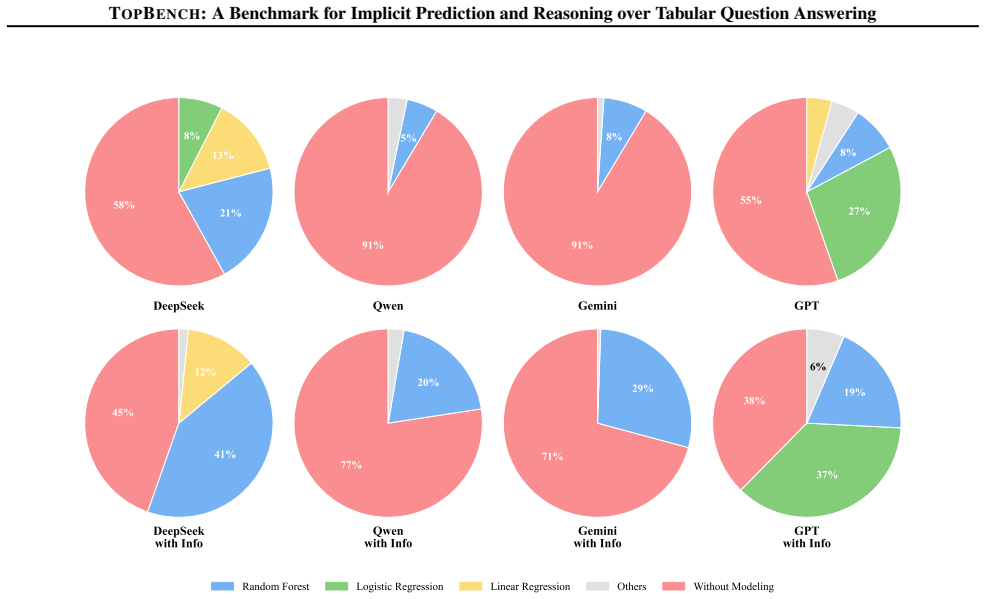
- Text-based and agentic workflows both require upgrades to handle latent intent rather than surface retrieval.
- Improving prediction precision will depend on integrating more advanced modeling techniques beyond current LLM defaults.
- The benchmark can be used to measure progress on the shift from retrieval to inference in table-based tasks.
Where Pith is reading between the lines
- The same intent-recognition bottleneck may limit LLMs on predictive tasks with other structured data such as time series or knowledge graphs.
- Training objectives that explicitly reward intent disambiguation could raise performance ceilings on forecasting-style table questions.
- Business and scientific analytics pipelines that rely on tables for forward-looking decisions would gain immediate value from models that clear TopBench thresholds.
Load-bearing premise
The 779 samples and four sub-tasks faithfully represent the distribution and difficulty of real-world implicit predictive queries over tabular data, and model outputs can be reliably scored for predictive accuracy versus retrieval.
What would settle it
A model that scores well on TopBench while still treating queries as lookups without correctly identifying predictive intent, or a follow-up study on a larger set of real-world implicit queries that shows substantially different failure rates.
Figures


read the original abstract
Large Language Models (LLMs) have advanced Table Question Answering, where most queries can be answered by extracting information or simple aggregation. However, a common class of real-world queries is implicitly predictive, requiring the inference of unobserved answers from historical patterns rather than mere retrieval. These queries introduce two challenges: recognizing latent intent and reliable predictive reasoning over massive tables. To assess LLMs in such Tabular questiOn answering with implicit Prediction tasks, we introduce TopBench, a benchmark consisting of 779 samples across four sub-tasks, ranging from single-point prediction to decision making, treatment effect analysis, and complex filtering, requiring models to generate outputs spanning reasoning text and structured tables. We evaluate diverse models under both text-based and agentic workflows. Experiments reveal that current models often struggle with intent recognition, defaulting to just lookups. Deeper analysis identifies that accurate intent disambiguation serves as the prerequisite for leading these predictive behaviors. Furthermore, elevating the upper bound of prediction precision requires the integration of more sophisticated modeling or reasoning capabilities.
Editorial analysis
A structured set of objections, weighed in public.
Referee Report
Summary. The paper introduces TopBench, a benchmark of 779 samples across four sub-tasks (single-point prediction, decision making, treatment effect analysis, complex filtering) to evaluate LLMs on tabular QA requiring implicit prediction of unobserved values from historical patterns rather than retrieval. Evaluations of diverse models in text-based and agentic workflows show that models frequently fail to recognize latent intent and default to lookups; the authors conclude that accurate intent disambiguation is a prerequisite for effective predictive reasoning and that more sophisticated modeling is needed to raise prediction precision.
Significance. If the benchmark construction and scoring protocols are sound and representative, TopBench would fill a genuine gap in table QA evaluation by targeting predictive inference over retrieval. The empirical finding that intent recognition is the primary bottleneck could usefully steer future work on agentic and reasoning-enhanced table models. The provision of a public benchmark with structured outputs (reasoning text plus tables) is a concrete community resource.
major comments (2)
- [§3] §3 (Benchmark Construction): The manuscript must supply explicit details on query provenance (real logs vs. synthetic generation), table domains and sizes, the protocol used to establish unobserved ground-truth values for prediction/treatment-effect tasks, and inter-annotator agreement statistics for labeling samples as requiring predictive reasoning versus retrieval. Without these, it is impossible to confirm that the 779 samples genuinely test implicit prediction rather than artifacts of benchmark design.
- [§4] §4 (Experiments and Analysis): The claim that models 'default to just lookups' and that 'accurate intent disambiguation serves as the prerequisite' rests on the reliability of output scoring that distinguishes predictive reasoning from retrieval. The paper should report the exact rubric or classifier used for this distinction, quantitative inter-rater reliability for those labels, and at least a sample of annotated model outputs. Absent this, the observed failure modes cannot be confidently attributed to model limitations rather than evaluation artifacts.
minor comments (2)
- [§3.2] Table 1 or §3.2: Provide summary statistics (average rows/columns per table, domain distribution) to allow readers to judge scale and diversity.
- [§4.1] §4.1: Clarify the precise prompting templates and agentic workflow implementations so that the text-based vs. agentic comparison is fully reproducible.
Simulated Author's Rebuttal
We thank the referee for the constructive and detailed feedback. The comments highlight important areas for improving transparency and rigor in the manuscript. We address each major comment below and will incorporate revisions to strengthen the paper.
read point-by-point responses
-
Referee: [§3] §3 (Benchmark Construction): The manuscript must supply explicit details on query provenance (real logs vs. synthetic generation), table domains and sizes, the protocol used to establish unobserved ground-truth values for prediction/treatment-effect tasks, and inter-annotator agreement statistics for labeling samples as requiring predictive reasoning versus retrieval. Without these, it is impossible to confirm that the 779 samples genuinely test implicit prediction rather than artifacts of benchmark design.
Authors: We agree that these details are necessary to allow readers to evaluate the benchmark's construction and confirm its focus on implicit prediction. While §3 outlines the overall process, we acknowledge that more granular information on provenance, domains, ground-truth protocols, and agreement statistics was not provided. In the revised manuscript we will expand §3 with a dedicated subsection supplying this information, including the sources of queries, table characteristics, how unobserved values were determined, and agreement metrics. These additions will directly address the concern and substantiate that the 779 samples target predictive reasoning. revision: yes
-
Referee: [§4] §4 (Experiments and Analysis): The claim that models 'default to just lookups' and that 'accurate intent disambiguation serves as the prerequisite' rests on the reliability of output scoring that distinguishes predictive reasoning from retrieval. The paper should report the exact rubric or classifier used for this distinction, quantitative inter-rater reliability for those labels, and at least a sample of annotated model outputs. Absent this, the observed failure modes cannot be confidently attributed to model limitations rather than evaluation artifacts.
Authors: We concur that transparent documentation of the scoring process is required to support the claims about model behavior and the role of intent disambiguation. The current §4 describes the high-level evaluation approach, but we will revise it to include the precise rubric for distinguishing predictive reasoning from retrieval, quantitative inter-rater reliability statistics, and a set of annotated sample outputs (to be placed in the appendix). These changes will strengthen the attribution of observed failure modes to model limitations rather than evaluation artifacts. revision: yes
Circularity Check
No derivation chain or self-referential structure present in this empirical benchmark paper
full rationale
This is a benchmark construction and evaluation paper with no mathematical derivations, equations, parameter fittings, or predictive models that could reduce to their inputs by construction. The core contribution is the creation of TopBench (779 samples across four sub-tasks) followed by direct empirical testing of LLMs under text-based and agentic workflows. Claims about models defaulting to lookups or the prerequisite role of intent disambiguation are observational results from held-out evaluation, not derived quantities. No self-citation load-bearing steps, uniqueness theorems, or ansatz smuggling appear in the abstract or described content. The paper is self-contained against external benchmarks in the sense that its results are falsifiable via re-running the evaluations on the released data; therefore no circularity is present.
Axiom & Free-Parameter Ledger
axioms (1)
- domain assumption The four sub-tasks (single-point prediction, decision making, treatment effect analysis, complex filtering) adequately cover the space of implicit predictive tabular queries.
invented entities (1)
-
TopBench benchmark dataset and tasks
no independent evidence
Reference graph
Works this paper leans on
-
[1]
Springer Nature Singapore, 2022. Ke, G., Meng, Q., Finley, T., Wang, T., Chen, W., Ma, W., Ye, Q., and Liu, T.-Y . Lightgbm: A highly efficient gradient boosting decision tree. InNeurIPS, 2017. Lee, G., Hwang, H., Bae, S., Kwon, Y ., Shin, W., Yang, S., Seo, M., Kim, J.-Y ., and Choi, E. EHRSQL: A practical text-to-SQL benchmark for electronic health reco...
work page internal anchor Pith review arXiv 2022
-
[2]
The value... is high
Text Standardization and Hybrid Surface Matching:Before comparison, raw responses undergo aggressive normal- ization: stripping LaTeX formatting (e.g., converting \text{1.5k} to 1.5k), unifying Unicode symbols, and mapping natural language numerals (e.g., “three”) to digits via a lookup table. The system then attempts to verify the extracted proof quote u...
-
[3]
1.5k”→1500, “20%
Numeric Parsing and Interval Logic:For regression tasks, we deploy a specialized NumberParser to verify mathematical equivalence between the extracted structure and the text. This module: •Unit Conversion: Maps domain-specific suffixes (e.g., “1.5k”→1500, “20%”→0.2, “5bn”→5×10 9). • Interval Derivation: Validates implied intervals. For instance, if the te...
-
[4]
skyrocketed
Semantic Entailment (NLI Fallback):If structural and numeric matching fail—often due to high-level summariza- tion—we activate a secondary LLM agent to perform Natural Language Inference (NLI). This agent determines if the 16 TOPBENCH: A Benchmark for Implicit Prediction and Reasoning over Tabular Question Answering Table 10.Model-by-Row-Scale Cross-Tabul...
-
[5]
’history.csv’ - Columns: $history_columns
-
[6]
The data provided above are ONLY column names
’current.csv’ - Columns: $current_columns Note: These files are mounted, use their filenames directly. The data provided above are ONLY column names. DO NOT hallucinate data rows. You MUST use the CodeRunner tool to read the files (e.g., pd.read_csv) to inspect the actual data content. CRITICAL REQUIREMENT:
-
[7]
You MUST process the data and save the final results into a file named ’result.csv’
-
[8]
The ’result.csv’ MUST contain the exact columns matching history.csv format
-
[9]
Which is X?
Do not just print the result, you must save it to ’result.csv’ using pandas to_csv().$prompt_extras You need to give the answer within $max_iterations rounds. Judge Regression Extraction Prompt You are an expert evaluator for a tabular data prediction task (REGRESSION). Input Data: [Query]: {query} [Model Response]: {response} [Ground Truth]: {gt_str} [Da...
-
[10]
2 million+
Prediction Extraction (STRICT): - Extract the final numerical prediction or interval. - CRITICAL RULE FOR VAGUE NUMBERS: - If the text says "2 million+", "over 500k", or "approx 10%", you must extract the visible number (e.g., 2000000, 500000, 10). - DO NOT make up a precise number to represent the "+". - Unless the precise number is explicitly stated in ...
-
[11]
Proof Extraction (CRITICAL): - You MUST copy the proof_quote VERBATIM from the [Model Response]. - The numbers in predicted_interval MUST be visibly identical to the numbers in this quote. - For intervals, your quote MUST contain the text for BOTH the lower and upper bounds. - DO NOT add property names, keys, or prefixes. {ANTI_HALLUCINATION_EXAMPLES} {lo...
-
[12]
**Get Official Quotes:** Contact insurance providers directly or use the Health Insurance Marketplace for personalized quotes
-
[13]
**Consider Plan Details:** Look beyond the premium at deductibles, out-of-pocket maximums, and covered services
-
[15]
**Age (51 years)**: Adds about $255 per year of age
-
[16]
**High BMI (39.7)**: Your BMI is in the 92nd percentile, adding approximately $330 per BMI unit
-
[17]
**Non-smoker status**: This is actually saving you about **$23,400 per year** compared to smokers!
-
[18]
**One dependent child**: Adds about $519 to your premium
-
[20]
**Person A**: BMI = 33.77
-
[21]
**Person B**: BMI = 30.03
-
[22]
### **Matching records from the dataset**
**Person C**: BMI = 35.2 From the dataset, I can find records that closely match these profiles to estimate their insurance charges. ### **Matching records from the dataset** ...... ### **General trend from data** Looking at 18-year-old males in Southeast, non-smoker, 0 children (since 1-child records are rare for this age in dataset): ...... ### **Estima...
-
[23]
**Person B (BMI 30.03)** — lowest BMI → lowest base charge
-
[24]
**Person A (BMI 33.77)** — middle BMI → middle charge
-
[26]
**Second person (BMI 30.03)**: $2,211.46
-
[27]
**First person (BMI 33.77)**: $2,286.33
-
[28]
**Third person (BMI 35.20)**: $2,314.95 ...... ### **Final Recommendation:** Your cousin should expect that **lower BMI generally correlates with lower insurance costs**. Among the three scenarios presented, the profile with **BMI 30.03** would likely have the most affordable insurance premiums. The good news is that all three scenarios are relatively clo...
discussion (0)
Sign in with ORCID, Apple, or X to comment. Anyone can read and Pith papers without signing in.