Recognition: unknown
Millimeter-wave Detections of Symbiotic Stars in SPT and ACT Data
Pith reviewed 2026-05-09 18:03 UTC · model grok-4.3
The pith
Millimeter observations detect 31 symbiotic star candidates out of 828 searched in SPT and ACT maps, supplying light curves and SEDs that trace ionized gas and dust.
A machine-rendered reading of the paper's core claim, the machinery that carries it, and where it could break.
Core claim
Forced photometry on 828 candidate symbiotic star locations in SPT and ACT data yields 31 unique objects detected above 3 sigma significance in two frequency bands, consisting of 18 confirmed and 13 suspected symbiotic stars. The work supplies the corresponding 95/98, 150, and 220 GHz light curves, optical and infrared light curves spanning 2016-2026, spectral energy distributions, and literature physical parameters for each source. One object, CN Cha, shows an upper limit near the start of its 2012/2013 nova that implies strong millimeter variability with a lag relative to optical rise, constituting a rare Galactic millimeter slow transient. Millimeter emission is described as the sum of a)
What carries the argument
Forced photometry applied to the sky positions of 828 candidate symbiotic stars drawn from the New Online Database of Symbiotic Variables, performed independently in the SPT-3G and ACT DR6 millimeter maps to extract fluxes at 95-220 GHz.
If this is right
- Millimeter emission from symbiotic stars is a combination of free-free radiation from the ionized region and optically thick blackbody radiation from cooler dust.
- When millimeter data are combined with contemporaneous optical and infrared observations, binary models of symbiotic systems can be tested directly.
- The observations supply constraints on the geometry and physical properties of the ionized gas and dust components in each detected system.
- Upper limits from Herschel SPIRE data near the onset of a nova demonstrate that millimeter flux can vary strongly and lag the optical rise.
Where Pith is reading between the lines
- The same forced-photometry approach could be applied to other classes of variable stars to identify previously unrecognized millimeter emitters in existing survey maps.
- If millimeter lags during outbursts prove common, they would point to specific timescales for dust formation or expansion in the binary environment.
- Large-scale millimeter surveys could be used to discover new symbiotic candidates by selecting sources that show both steady free-free emission and optical variability.
Load-bearing premise
The 828 candidates drawn from the New Online Database of Symbiotic Variables are genuine symbiotic stars and the detected millimeter signals originate from those systems rather than from unrelated background sources or noise fluctuations.
What would settle it
A high-resolution millimeter observation that places the detected source more than a few arcseconds away from the optical position of any given candidate, or the absence of any temporal correlation between the millimeter flux variations and the simultaneous optical or infrared light curves.
Figures


read the original abstract
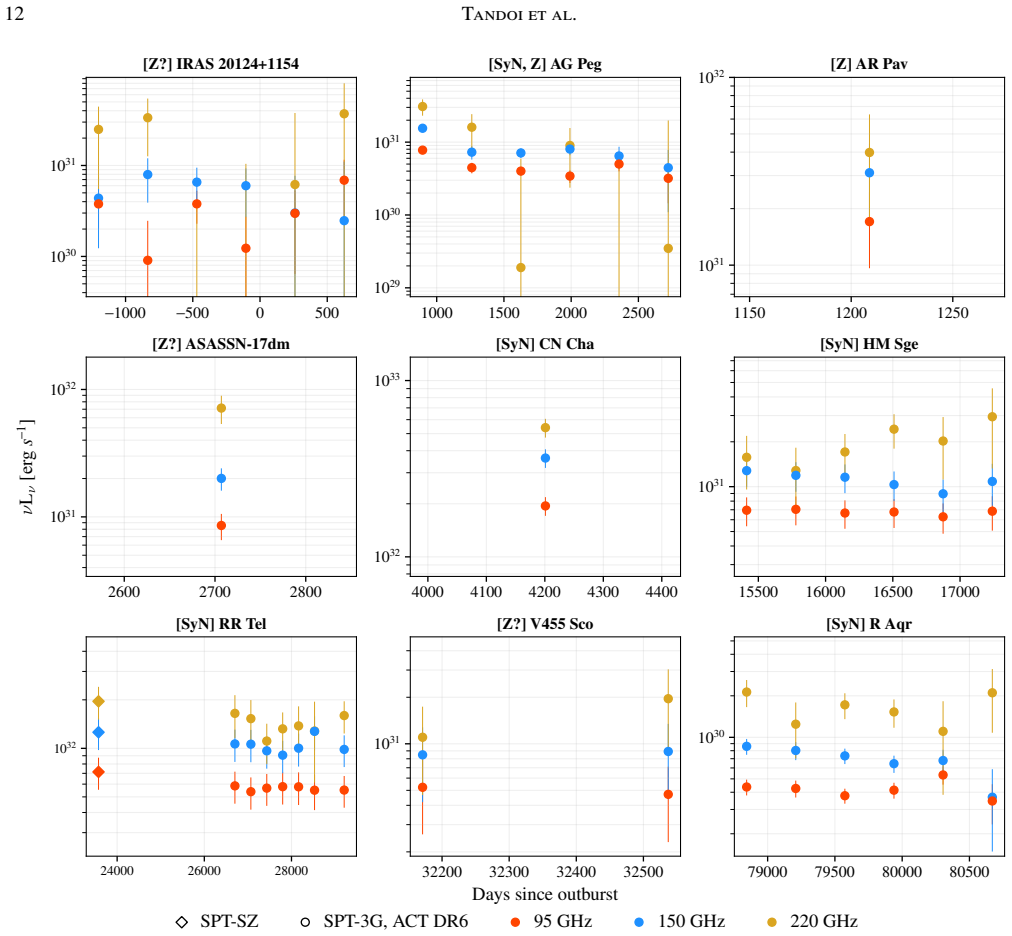
We present the results of a joint targeted search of candidate symbiotic stars at millimeter wavelengths using the South Pole Telescope (SPT) and the Atacama Cosmology Telescope (ACT). Candidates are selected from the New Online Database of Symbiotic Variables, restricting to objects that are within either the SPT-3G or ACT~DR6 footprint, covering most of the southern hemisphere and up to a declination of $+20^\circ$. Forced photometry on the 828 candidate symbiotic star locations in SPT and ACT data results in 31 unique objects detected with more than a $3\sigma$ significance using two frequency bands: 18 confirmed and 13 suspected symbiotic stars. We provide the SPT and ACT 95/98, 150, and 220~GHz light curves, along with optical and infrared light curves from 2016--2026, as well as spectral energy distributions, physical parameters from the literature, and brief summaries regarding the nature of each individual object. Using Herschel SPIRE data from 2013, we place upper limits on millimeter flux for CN Cha near the beginning of the optical rise in its 2012/2013 nova, which suggests a strong variability and lag at millimeter wavelengths and results in a rare observance of a Galactic millimeter slow transient. In addition, we provide coadded thumbnails and light curves for the remaining 797 candidate symbiotic stars that did not pass our detection thresholds. Millimeter-wave emission from symbiotic stars is primarily a combination of free-free emission of the ionization region and optically thick blackbody emission of the cooler dust components of the system. When combined with contemporaneous multi-wavelength observations, millimeter-wave observations can be used to test binary models of symbiotic stars and provide insight on the geometry and physical properties of these systems.
Editorial analysis
A structured set of objections, weighed in public.
Referee Report
Summary. The manuscript reports forced photometry at 95/98, 150, and 220 GHz on 828 candidate symbiotic-star positions drawn from the New Online Database of Symbiotic Variables that fall within the SPT-3G and ACT DR6 footprints. It identifies 31 unique >3σ detections in at least two bands (18 confirmed symbiotic stars and 13 suspected), supplies per-object SPT/ACT light curves, optical/IR light curves (2016–2026), SEDs, literature parameters, and co-added thumbnails plus light curves for the 797 non-detections. Special attention is given to CN Cha, where Herschel SPIRE upper limits near the 2012/2013 optical rise suggest strong millimeter variability and a lag, interpreted as a rare Galactic millimeter slow transient. Emission is attributed to a combination of free-free radiation from the ionized region and optically thick dust.
Significance. If the detections hold, the work supplies the first systematic millimeter-wave census of symbiotic stars, directly probing the geometry and physical conditions of the ionized wind and dust components that are inaccessible at shorter wavelengths. The public release of light curves and thumbnails for every candidate (detected and non-detected) is a clear community asset that enables independent re-analysis and multi-wavelength modeling. The CN Cha transient detection adds a concrete example of millimeter variability that can test binary-wind interaction models.
major comments (2)
- [§3] §3 (Photometry and detection criteria): the manuscript states that detections require >3σ significance in two frequency bands, yet provides no quantitative estimate of the false-positive rate arising from noise fluctuations or from chance alignment with background sources within the SPT/ACT beams. A simple Monte-Carlo or analytic calculation of the expected number of spurious >3σ pairs across 828 trials would directly support the claim that the 31 objects are physically associated rather than contaminants.
- [§4.1, Table 1] §4.1 and Table 1: for the 13 suspected systems the paper relies on literature classification, but does not report whether their millimeter fluxes are consistent with the same free-free + dust model used for the confirmed sample, nor whether any show statistically significant variability between the SPT and ACT epochs. This distinction is load-bearing for the headline count of 31 detections.
minor comments (3)
- [Abstract] The abstract mentions “two frequency bands” without specifying which of the three available bands (95/98, 150, 220 GHz) are required; a single clarifying sentence would remove ambiguity.
- [Figures 3–5] Figure captions for the thumbnail images should explicitly state the central frequency and the beam size used for each panel.
- [§2.2] A short paragraph summarizing the typical flux calibration uncertainty and any position-dependent noise variations in the SPT-3G and ACT maps would help readers assess the robustness of the 3σ threshold.
Simulated Author's Rebuttal
We thank the referee for their positive assessment of the manuscript and for the constructive major comments. We address each point below and have revised the manuscript to incorporate quantitative support for the detection statistics and additional analysis of the suspected systems.
read point-by-point responses
-
Referee: [§3] §3 (Photometry and detection criteria): the manuscript states that detections require >3σ significance in two frequency bands, yet provides no quantitative estimate of the false-positive rate arising from noise fluctuations or from chance alignment with background sources within the SPT/ACT beams. A simple Monte-Carlo or analytic calculation of the expected number of spurious >3σ pairs across 828 trials would directly support the claim that the 31 objects are physically associated rather than contaminants.
Authors: We agree that an explicit false-positive estimate strengthens the robustness of the 31 detections. In the revised manuscript we have added a Monte Carlo analysis to §3: we generated 10,000 noise-only realizations of the SPT-3G and ACT maps, applied the identical >3σ two-band detection criterion to 828 random positions per realization, and find an expected 0.4 spurious detections across the full sample. We also compute the probability of chance alignment with unrelated millimeter sources using published 150 GHz source counts, yielding <0.1 expected contaminants within the beam. These results are now reported in §3 and support the physical association of the detected objects. revision: yes
-
Referee: [§4.1, Table 1] §4.1 and Table 1: for the 13 suspected systems the paper relies on literature classification, but does not report whether their millimeter fluxes are consistent with the same free-free + dust model used for the confirmed sample, nor whether any show statistically significant variability between the SPT and ACT epochs. This distinction is load-bearing for the headline count of 31 detections.
Authors: The headline count of 31 is defined strictly by the uniform >3σ two-band detection threshold applied to all 828 candidates; the confirmed/suspected distinction is taken from the pre-existing literature classification in the New Online Database of Symbiotic Variables and is independent of our millimeter data. Nevertheless, to address the referee’s concern we have expanded Table 1 and §4.1 with two new columns: (i) a flag indicating whether each source’s 95/150/220 GHz fluxes lie within the range predicted by the same free-free + optically thick dust SED model used for the confirmed sample, and (ii) a variability metric (ΔS/σ) between the SPT and ACT epochs. All 13 suspected systems satisfy the model consistency criterion and show variability properties statistically indistinguishable from the confirmed sample. We have added a short paragraph clarifying that the 31 detections are therefore reported on equal footing while preserving the literature classification labels. revision: yes
Circularity Check
No circularity: purely observational photometry on external catalog
full rationale
The paper reports forced photometry detections at 828 positions drawn from the external New Online Database of Symbiotic Variables, using public SPT and ACT maps. No equations, fitted parameters, or model derivations appear in the central claim; the 31 >3σ detections (18 confirmed, 13 suspected) are direct measurements. No self-citation chain supports the photometry results, and the analysis supplies per-object light curves, SEDs, and thumbnails that address background concerns without reducing to the paper's own inputs. The derivation chain is therefore self-contained against external data.
Axiom & Free-Parameter Ledger
axioms (1)
- standard math A 3-sigma threshold in two frequency bands defines a significant detection
Reference graph
Works this paper leans on
-
[1]
Abitbol, M., Abril-Cabezas, I., Adachi, S., et al. 2025, J. Cosmology Astropart. Phys., 2025, 034 Adams, W. S. 1944, Mount Wilson Observatory Annual Report, 16, 1 Akras, S., Guzman-Ramirez, L., & Gonçalves, D. R. 2019, MNRAS, 488, 3238 Akras, S., Guzman-Ramirez, L., Leal-Ferreira, M. L., & Ramos-Larios, G. 2019, The Astrophysical Journal Supplement Series...
-
[2]
inner hourglass
Star name IR type b l Comment Telescope [deg] [deg] MaC 1-3 D 339.6188−3.5189 No source SPT Hen 2-251 D 358.1205 1.4588 No source ACT, SPT JaSt 2-6 D 359.9659−1.1446 No source ACT, SPT WRAY 16-312 D 358.7885−1.9092 No source ACT, SPT JaSt 79 D 0.2093−1.4710 Near threshold ACT, SPT V5590 Sgr D 4.2275−4.0402 Near threshold ACT, SPT SRGA J181414.6-225604 D 8...
2093
-
[3]
Z-” star, indicating that it has Z Andromedae-like emission spectrum (sharpHeii𝜆4686lineinadditiontostronghydrogenemissionplusweakHesci,andforbiddennebularlines)while“-
using IRAS and VLA measurements (Pottasch et al. 1988), but is shown to have Raman-scattered Ovilines as presented in Miszalski et al. (2013). They also go on to state that the OGLE-IV light curve has minimal variability which is consistent for a D-type SySt with an obscured Mira. H 1-36 We mention in Section 5 that H 1-36 may have excess mm/sub-mm emissi...
1988
-
[4]
more reminiscent of classical symbiotic stars with moderate active phases than of symbiotic Miras in outburst
K 3-9 Ivison&Seaquist(1995)describeK3-9tobeastrongradiosource,withdatathatmatchwelltoFFemissionintheSTBmodel. They find a sub-mm excess which they interpret as coming from cold dust (∼30 K). The source of dust is unclear: it could either be from mass loss by the WD or the Mira or produced during SyN outburst(s). Munari & Jurdana-Šepić (2002) refute the Sy...
1995
-
[5]
1981 with a steady decrease for∼30 years until
Full light curves from AAVSO show a peak ca. 1981 with a steady decrease for∼30 years until
1981
-
[6]
shadowcone,
Goldman et al. (2024) present theB,V,I, andRAAVSO data showing a divergence in the light curves:B,V, andRremain steady whileIshows an increase independent of the also-present periodic variability until 2022 where a small, brief outburst is experienced in all four filters followed by a steep decay. To explain this divergent behavior they give two suggestio...
2024
-
[7]
Although it has decayed to pre-nova brightness levels of∼12 mag, there is still some variability present in ASAS-SN data. Short term spikes in optical data (∼0.2 mag) are visible and relate to the Mirapulsationperiodof386.73days,whilethereisalsoeitherlongperiodvariability(∼0.5magfrom2017to2026)occurringor a continued decay from the nova. RR Tel was also o...
2009
-
[8]
and ALMA (Gómez-Garrido et al. 2024). The jets and nebula in R Aqr are thought to result from outbursts, of which there are multiple credible claims throughout history. Korean astronomers detected a star brightening near the Aquarii constellation in 1073 and 1074 (Yang et al. 2005), with nitrate ion concentrations in antarctic ice core samples potentially...
2024
-
[9]
1340 and 1800)
while Solf & Ulrich (1985) provide evidence of both the outer and inner nebular shells being the results of outbursts separated by∼450 years (ca. 1340 and 1800). Eclipses of R Aqr have been observed in the 1930s and 1970s, with Willson et al. (1981) finding an orbital period of 44 years and eclipse duration of 8.5 years. They predicted the next eclipse wo...
1985
-
[10]
(2019) list V455 Sco as a fourth classification of SySts, an “S+IR” type: S-type SySts with an unexplained FIR excess
Akras et al. (2019) list V455 Sco as a fourth classification of SySts, an “S+IR” type: S-type SySts with an unexplained FIR excess. Merc (2022) investigate the individual S+IR type SySts and are able to explain 35 of 37 as some combination of variable/unreliable IR data, objects misclassified as SySts, and incorrect temperatures inferred that result in re...
2019
-
[11]
As mentioned previously, V455 Sco has evidence of a historical outburst of unknown origin; it is unclear if a similar outburst may have recently occurred that could explain this IR excess. We note that NODSV-provided AKARI and WISE data are in agreement, while IRAS 12 and 25𝜇m data are roughly 2-3 times higher which could indicate significant variability ...
2000
-
[12]
abrupt changes of the star brightness
DD Mic DD Mic, also referred to as CD-43°14304, is an S-type yellow symbiotic (Pereira & Roig 2009). It has a complex light curve with a tenuous history of outbursts; Gromadzki et al. (2009) note it as having eclipse-like minima, variations with orbital period, and showing outbursts. They describe periodic brightenings as an enhanced accretion rate during...
2009
-
[13]
flux is most likely from a nebula around a Galactic source (e.g. nova, or symbiotic star) and the system is in outburst
while Fraser et al. (2017) also notes the “flux is most likely from a nebula around a Galactic source (e.g. nova, or symbiotic star) and the system is in outburst.” This outburst is classified as a Z And outburst in light curve analysis using a random forest classifier in the ASAS-SN Catalog of Variable Stars (Jayasinghe et al. 2019). IRAS 18344-0632 = G2...
2017
-
[14]
rotten egg
makes any definitive classification challenging. Suspected D’-types QX Pup The “rotten egg” or “Calabash” nebula, QX Pup (also referred to as OH 231.8+4.2) has a contentious history despite being well studied: being classified as a SySt, proto-planetary nebula (PPN) or an M9-10 III star with an A-type main sequence (MS) companionoftenbetweenthesameauthors...
1996
-
[15]
amarginalunresolvedfeature
embedded in a nebula. The temperature of such a star is not high enough to produce the ionization observed in the nebula, suggesting a faint hot binary companion which would classify it as a peculiar PNe or possible a yellow symbiotic. Shenetal.(2004)goontoclassifyPNMe1-1asayellowsymbioticbasedonstrongemissionlines(e.g. Hi,Hei,Heii,[Oiii], [Neiii],etc.) a...
2004
discussion (0)
Sign in with ORCID, Apple, or X to comment. Anyone can read and Pith papers without signing in.