Recognition: unknown
Understanding Simulated Architecture via gem5 Call-Stack Profiling
Pith reviewed 2026-05-09 18:10 UTC · model grok-4.3
The pith
Call-stack profiling of gem5 directly reflects simulated system activity and uncovers behaviors missed by standard statistics.
A machine-rendered reading of the paper's core claim, the machinery that carries it, and where it could break.
Core claim
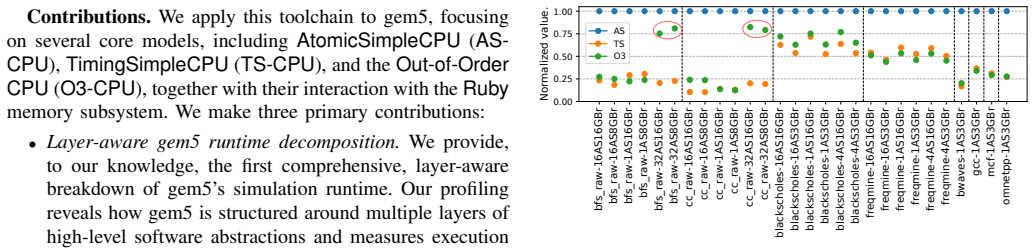
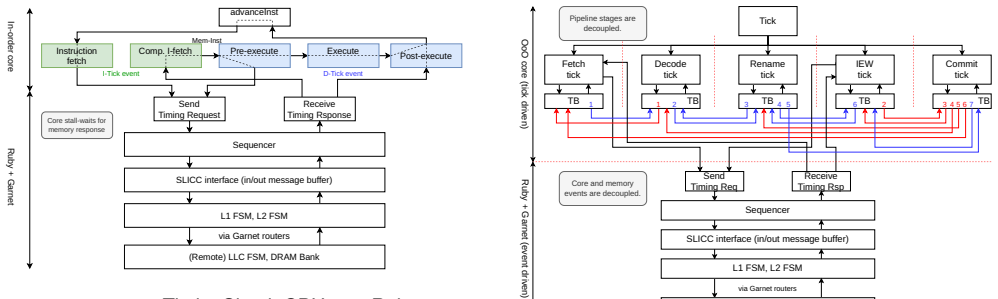
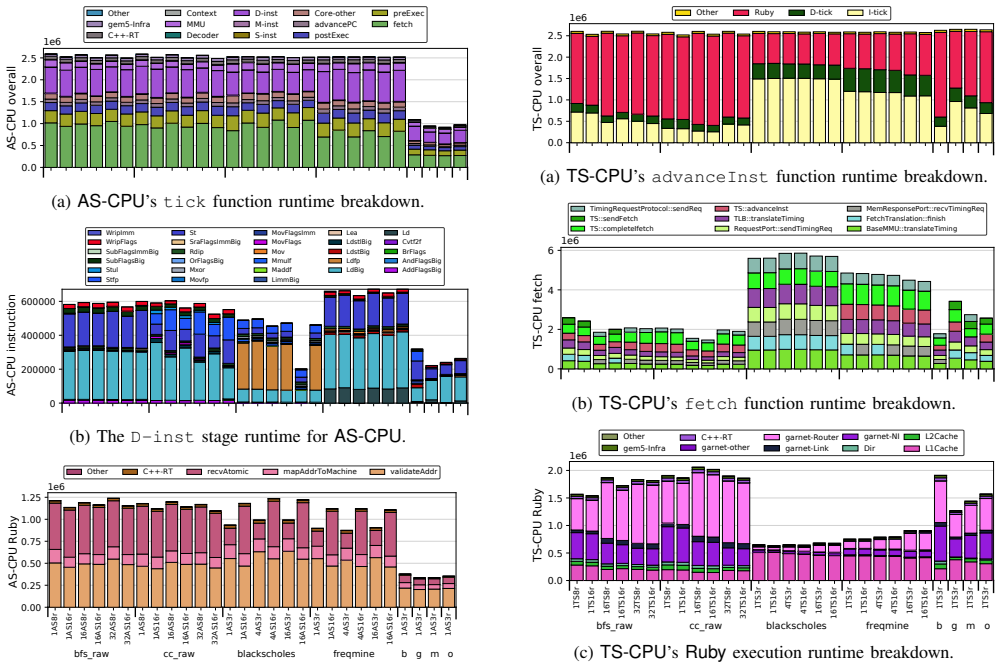
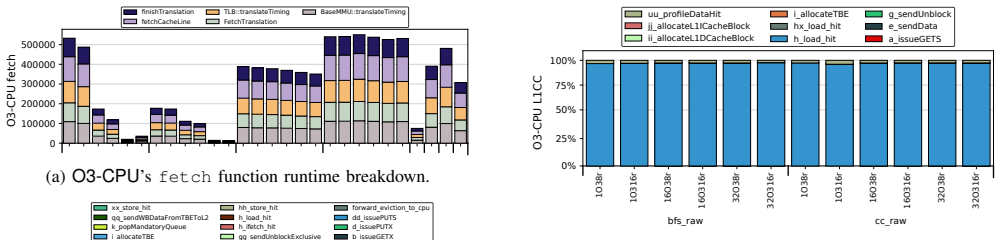
Call-stack profiling of gem5 itself offers a powerful yet underutilized perspective: the simulator's own call-stack directly reflects the activity of the simulated system, exposing insights that conventional statistics may overlook. The profiling framework samples gem5's runtime call-stacks, resolves symbols on the fly, and merges them into a hierarchical call-tree for analysis of CPU models and the Ruby memory system.
What carries the argument
A specialized lightweight profiling framework using Linux's perf_event interface to sample gem5's call-stacks in a separate process, resolve symbols, and build a hierarchical call-tree representation.
If this is right
- TimingSimpleCPU proves inefficient due to its lockup-cache model and does not run simulations faster than a full out-of-order core.
- Cache coherence protocol deadlocks and livelocks become straightforward to detect, even when the simulation appears normal or ends abruptly.
- Architectural insights into complex systems like integrated CPU and memory models become more accessible through hierarchical views of simulator activity.
Where Pith is reading between the lines
- Similar call-stack profiling could be adapted to other architecture simulators to gain comparable internal visibility.
- Developers might use these profiles to optimize simulator performance itself by identifying hot paths in the code.
- This approach could complement traditional tracing methods in hardware-software co-design studies.
Load-bearing premise
That sampling gem5's call-stacks provides an accurate and undistorted reflection of simulated system activity without meaningful interference from the simulator's layered design or the profiling overhead itself.
What would settle it
A direct comparison showing that the call-stack samples do not align with known simulation events or fail to identify the cache coherence deadlocks mentioned in the case studies.
Figures


read the original abstract
Understanding the behavior of simulated architectures in gem5 is critical for studying complex, deeply integrated computing systems. However, conventional analysis methods provide only an indirect view of the simulated system internals. In this work, we show that call-stack profiling of gem5 itself offers a powerful yet underutilized perspective: the simulator's own call-stack directly reflects the activity of the simulated system, exposing insights that conventional statistics may overlook. Profiling gem5's call-stacks is challenging due to its highly layered and complex software design patterns. To address this, we introduce a specialized, lightweight profiling framework built on Linux's perf_event interface which samples gem5's runtime call-stacks throughout the simulation, resolves symbols on the fly, and merges samples into a hierarchical call-tree representation supporting both high-level structural views and focused, user-defined, component-specific analysis. Moreover, all profiling is performed in a separate process running alongside the main gem5 process, avoiding intrusive changes and overheads to the simulation itself. We apply our framework to gem5's three major CPU models -- AtomicSimpleCPU, TimingSimpleCPU, and O3CPU -- together with the Ruby memory system, and uncover behaviors that are not easily observable in conventional gem5 statistics. Our case studies reveal, for example, that TimingSimpleCPU is inefficient due to its use of a lockup-cache model and, despite its conceptual simplicity, does not simulate faster than a full out-of-order core. In addition, our tool makes it straightforward to detect cache coherence protocol deadlock and livelock -- issues that are otherwise difficult to identify, since the simulation either appears to run normally or terminates abruptly, making it hard to pinpoint when these conditions occur.
Editorial analysis
A structured set of objections, weighed in public.
Referee Report
Summary. The paper introduces a lightweight, separate-process call-stack profiling framework for gem5 based on Linux perf_event. It samples gem5's runtime call-stacks, resolves symbols, and builds hierarchical call-trees to analyze the simulator's execution. The authors apply the tool to AtomicSimpleCPU, TimingSimpleCPU, O3CPU, and the Ruby memory system, claiming it reveals non-obvious behaviors such as TimingSimpleCPU's inefficiency from its lockup-cache model (despite conceptual simplicity) and facilitates detection of cache-coherence deadlocks or livelocks that are hard to spot with standard gem5 statistics.
Significance. If the mapping from gem5 call-stacks to simulated-component activity can be shown to be reliable and low-distortion, the framework would supply a useful complementary diagnostic for gem5 users working on complex CPU-memory interactions. The non-intrusive, separate-process design is a clear engineering strength that avoids modifying the simulator core.
major comments (2)
- [Abstract] Abstract and §3 (framework description): the central claim that 'the simulator's own call-stack directly reflects the activity of the simulated system' is not accompanied by any quantitative validation or error analysis. Because gem5 is a discrete-event simulator, sampled stacks capture the current event handler plus its C++ call chain; the paper does not measure or bound the distortion introduced by event-queue ordering, virtual dispatch, or long-running handlers (e.g., lockup-cache stalls in TimingSimpleCPU).
- [Case Studies] Case-study sections (CPU models and Ruby): the reported observations (TimingSimpleCPU slower than O3CPU, deadlock detection) are presented qualitatively with no numerical data, no comparison against conventional gem5 stats, and no verification that the call-tree hotspots correspond to the claimed simulated-component activity. Without such evidence the claim that the method 'exposes insights that conventional statistics may overlook' remains unsupported.
minor comments (2)
- [Framework] The manuscript would benefit from an explicit description of the call-tree merging algorithm and any sampling-rate or symbol-resolution overhead measurements.
- [Figures] Figure captions and axis labels in the call-tree visualizations should state the sampling interval and total number of samples collected so readers can assess statistical significance.
Simulated Author's Rebuttal
We thank the referee for the constructive comments and for recognizing the non-intrusive design of the profiling framework. We address each major comment below and will revise the manuscript to incorporate quantitative validation and supporting data.
read point-by-point responses
-
Referee: [Abstract] Abstract and §3 (framework description): the central claim that 'the simulator's own call-stack directly reflects the activity of the simulated system' is not accompanied by any quantitative validation or error analysis. Because gem5 is a discrete-event simulator, sampled stacks capture the current event handler plus its C++ call chain; the paper does not measure or bound the distortion introduced by event-queue ordering, virtual dispatch, or long-running handlers (e.g., lockup-cache stalls in TimingSimpleCPU).
Authors: We agree that the manuscript would benefit from explicit quantitative validation of the mapping. The central claim follows from gem5's discrete-event architecture, in which the active call-stack at each sample corresponds to the handler of the currently processed event and thereby to the simulated component's activity. We acknowledge that event-queue ordering, virtual dispatch, and handler duration can introduce indirection. In the revised manuscript we will add a dedicated subsection to §3 that discusses these potential sources of distortion and supplies empirical bounds derived from our existing profiling runs, including direct comparisons of stack-sample frequencies against gem5's internal event counters and targeted measurements for the lockup-cache stalls in TimingSimpleCPU. revision: yes
-
Referee: [Case Studies] Case-study sections (CPU models and Ruby): the reported observations (TimingSimpleCPU slower than O3CPU, deadlock detection) are presented qualitatively with no numerical data, no comparison against conventional gem5 stats, and no verification that the call-tree hotspots correspond to the claimed simulated-component activity. Without such evidence the claim that the method 'exposes insights that conventional statistics may overlook' remains unsupported.
Authors: The case studies were written to illustrate diagnostic capabilities through representative call-tree visualizations. We did record numerical data (simulation wall-clock times, per-component sample counts, and stack distributions) during the experiments. To strengthen the presentation we will expand the CPU-model and Ruby sections with quantitative tables that (a) report simulation performance metrics across AtomicSimpleCPU, TimingSimpleCPU, and O3CPU, (b) compare call-tree hotspot frequencies against conventional gem5 statistics, and (c) verify that the dominant lockup-cache activity in TimingSimpleCPU is not captured by standard stats. For the cache-coherence deadlock example we will add a step-by-step trace with timing information showing how the call-tree identifies the livelock condition. revision: yes
Circularity Check
No circularity: tool-building paper with no derivations or self-referential reductions
full rationale
The manuscript presents a profiling framework for gem5 and applies it to case studies on CPU models and Ruby. No equations, fitted parameters, predictions, or first-principles derivations appear in the abstract or described content. Claims rest on direct observation of call-stack samples and conventional statistics comparison, without any step that reduces by construction to its own inputs or prior self-citations. The work is self-contained as an engineering description.
Axiom & Free-Parameter Ledger
axioms (1)
- domain assumption gem5's call-stack directly reflects the activity of the simulated system
Reference graph
Works this paper leans on
-
[1]
The gem5 Simulator,
N. Binkert, B. Beckmann, G. Black, S. K. Reinhardt, A. Saidi, A. Basu, J. Hestness, D. R. Hower, T. Krishna, S. Sardashtiet al., “The gem5 Simulator,”ACM SIGARCH Computer Architecture News, vol. 39, no. 2, pp. 1–7, 2011
2011
-
[2]
J. Lowe-Power, A. M. Ahmad, A. Akram, M. Alian, R. Amslinger, M. Andreozzi, A. Armejach, N. Asmussen, B. Beckmann, S. Bharad- wajet al., “The gem5 Simulator: Version 20.0+,”arXiv preprint arXiv:2007.03152, 2020
-
[3]
Profiling gem5 Simulator,
J. Umeike, N. Patel, A. Manley, A. Mamandipoor, H. Yun, and M. Alian, “Profiling gem5 Simulator,” inIEEE International Symposium on Perfor- mance Analysis of Systems and Software (ISPASS), 2023, pp. 103–113
2023
-
[4]
Semi-Automatic Validation of Cycle-Accurate Sim- ulation Infrastructures: The Case for gem5-x86,
J. M. Cebrián González, A. Barredo, H. Caminal, M. Moretó, M. Casas, and M. Valero, “Semi-Automatic Validation of Cycle-Accurate Sim- ulation Infrastructures: The Case for gem5-x86,”Future Generation Computer Systems, vol. 112, pp. 832–847, 2020
2020
-
[5]
gprof: A Call Graph Execution Profiler,
S. L. Graham, P. B. Kessler, and M. K. McKusick, “gprof: A Call Graph Execution Profiler,” inSIGPLAN Symposium on Compiler Construction, 1982, pp. 120–126
1982
-
[6]
Intel VTune Profiler,
Intel, “Intel VTune Profiler,” https://www.intel.com/content/www/us/en/ developer/tools/oneapi/vtune-profiler.html, accessed: 2025-11-25
2025
-
[7]
IPC Considered Harmful for Multipro- cessor Workloads,
A. Alameldeen and D. Wood, “IPC Considered Harmful for Multipro- cessor Workloads,”IEEE Micro, vol. 26, no. 4, pp. 8–17, 2006
2006
-
[8]
GARNET: A Detailed On-Chip Network Model Inside a Full-System Simulator,
N. Agarwal, T. Krishna, L.-S. Peh, and N. K. Jha, “GARNET: A Detailed On-Chip Network Model Inside a Full-System Simulator,” in IEEE International Symposium on Performance Analysis of Systems and Software (ISPASS), 2009, pp. 33–42
2009
-
[9]
S. Beamer, K. Asanovi ´c, and D. Patterson, “The GAP Benchmark Suite,” arXiv preprint arXiv:1508.03619, 2015
-
[10]
PARSEC 3.0: A Multi- core Benchmark Suite with Network Stacks and SPLASH-2X,
X. Zhan, Y . Bao, C. Bienia, and K. Li, “PARSEC 3.0: A Multi- core Benchmark Suite with Network Stacks and SPLASH-2X,”ACM SIGARCH Computer Architecture News, vol. 44, no. 5, pp. 1–16, 2017
2017
-
[11]
SPEC CPU2017 Documentation,
SPEC, “SPEC CPU2017 Documentation,” 2017, accessed: 2024-10-29. [Online]. Available: https://www.spec.org/cpu2017/Docs/
2017
-
[12]
Automatically Characterizing Large Scale Program Behavior,
Sherwood, Timothy and Perelman, Erez and Hamerly, Greg and Calder, Brad, “Automatically Characterizing Large Scale Program Behavior,” inInternational Conference on Architectural Support for Programming Languages and Operating Systems (ASPLOS), 2002, pp. 45—57
2002
-
[13]
Mul- tifacet’s General Execution-Driven Multiprocessor Simulator (GEMS) Toolset,
M. M. K. Martin, D. J. Sorin, B. M. Beckmann, M. R. Marty, M. Xu, A. R. Alameldeen, K. E. Moore, M. D. Hill, and D. A. Wood, “Mul- tifacet’s General Execution-Driven Multiprocessor Simulator (GEMS) Toolset,”SIGARCH Comput. Archit. News, vol. 33, no. 4, p. 92–99, 2005
2005
-
[14]
Token Coherence: Decoupling Performance and Correctness,
M. Martin, M. Hill, and D. Wood, “Token Coherence: Decoupling Performance and Correctness,” inInternational Symposium on Computer Architecture (ISCA), 2003, pp. 182–193. APPENDIX A. Abstract This artifact provides the complete experimental infrastruc- ture used in the paperUnderstanding Simulated Architecture via gem5 Call-Stack Profiling. It includes the...
2003
-
[15]
How to access:The artifact can be downloaded via: •https://doi.org/10.5281/zenodo.19126063, or •https://zenodo.org/records/19126063
-
[16]
The system used in our evaluation has the following configuration: i) x86 processor (Intel Core i7-12900K), ii) 128 GB RAM
Hardware dependencies:The experiments require a Linux server capable of usingperf_event(this probably re- quires root privileges, depending on the system configuration) and gem5 full-system simulations. The system used in our evaluation has the following configuration: i) x86 processor (Intel Core i7-12900K), ii) 128 GB RAM. The workflow launches multiple...
-
[17]
System monitoring tools such ashtoporbtop are recommended for observing resource usage during exper- iments
Software dependencies:The artifact depends on the following software: i) Linux operating system, ii) Python and Celery task framework, iii) scons build system, iv) gem5 simulator. System monitoring tools such ashtoporbtop are recommended for observing resource usage during exper- iments
-
[18]
Datasets:Due to the large sizes (about 350 GB) of the gem5 checkpoints as well as the disk images and kernel bina- ries required for the simulations, these files cannot be hosted on Zenodo. Therefore, users are responsible for preparing them locally. Checkpoints can be generated by following the tutorials provided by gem5, for example the PARSEC tutorial2...
discussion (0)
Sign in with ORCID, Apple, or X to comment. Anyone can read and Pith papers without signing in.