Recognition: unknown
A Virgo Environmental Survey Tracing Ionised Gas Emission (VESTIGE). XXI. Statistical properties of individual HII regions in perturbed galaxies
Pith reviewed 2026-05-08 17:25 UTC · model grok-4.3
The pith
HI-deficient galaxies in the Virgo cluster have steeper HII region faint-end slopes and brighter characteristic Ha luminosities than gas-rich systems.
A machine-rendered reading of the paper's core claim, the machinery that carries it, and where it could break.
Core claim
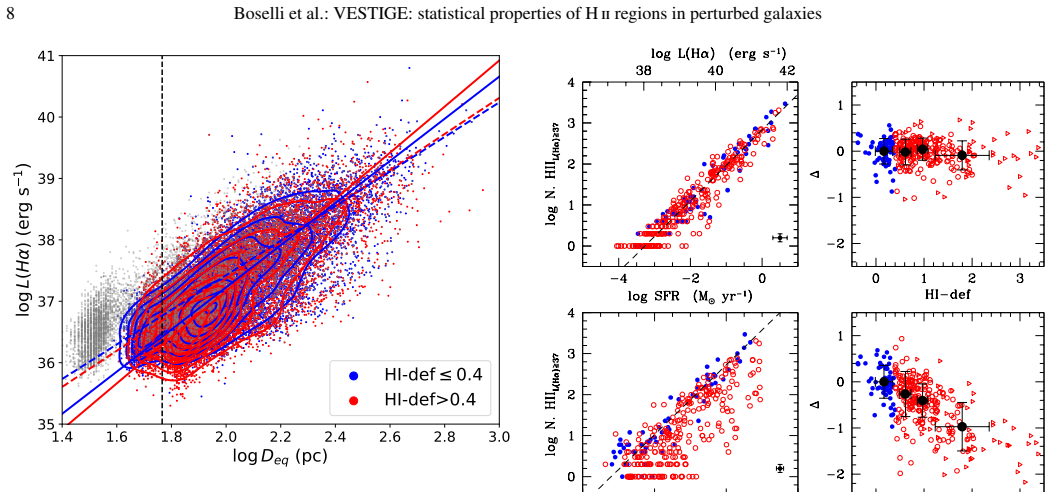
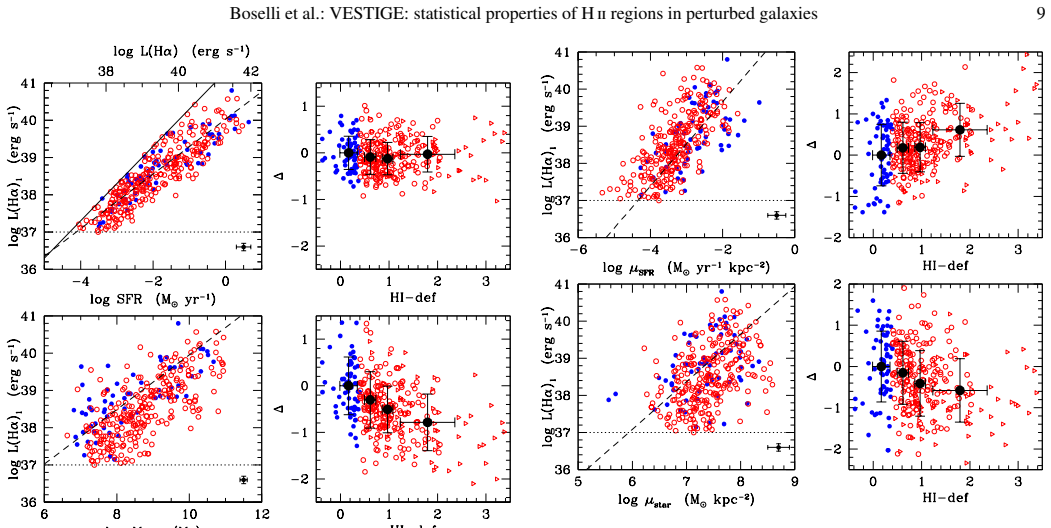
The statistical and physical properties of HI gas-deficient cluster galaxies are different from those of unperturbed systems, with perturbed objects having a steeper faint-end slope and a brighter characteristic Ha luminosity than gas-rich galaxies. The difference in the two distributions comes principally from the outer disc (outside the effective radius). The analysis of the scaling relations indicates that perturbed objects have a lower number of HII regions per unit stellar mass and disc surface than unperturbed systems, with differences increasing with the HI-deficiency parameter, principally in the outer disc where HII regions are less present in gas-poor systems. All these differences
What carries the argument
Composite H-alpha luminosity functions, diameter and electron density distributions, and scaling relations of HII regions identified above the completeness limit, compared between HI-deficient perturbed galaxies and gas-rich unperturbed galaxies.
If this is right
- Perturbed galaxies contain fewer HII regions per unit stellar mass and per unit disk surface area.
- The faint-end slope of the luminosity function steepens and the characteristic luminosity brightens as HI deficiency increases.
- The strongest changes occur outside the effective radius, consistent with outside-in gas removal.
- Once the outer HI is stripped, star formation activity in the outer disk drops sharply.
Where Pith is reading between the lines
- HII region statistics could serve as a proxy for identifying galaxies in the process of environmental quenching even when HI data are unavailable.
- The shift toward brighter characteristic luminosities may reflect more intense remaining star formation confined to the inner disk.
- Repeating the analysis with molecular-gas or UV tracers would test whether the quenching affects all phases of star formation or only the ionised component.
Load-bearing premise
That selecting galaxies as perturbed solely by their HI deficiency cleanly isolates ram pressure effects without substantial contamination from galaxy mass, morphology, or internal processes.
What would settle it
Finding no difference in HII region luminosity functions or number densities between HI-deficient and gas-rich galaxies once stellar mass and morphology are matched would falsify the environmental-quenching interpretation.
Figures


read the original abstract
We use narrow-band Halpha+[NII] imaging data gathered during VESTIGE, a blind survey of the Virgo cluster carried out with MegaCam at the CFHT, to identify HII regions in 385 galaxies showing ionised gas emission. We identify 76645 HII regions in 322 star-forming galaxies and study their physical properties for those above the completeness limit (L(Ha)>=10^37 erg s-1). The present work is focused on perturbed cluster galaxies, identified as those having a reduced amount of HI when compared to similar objects in the field. We derive composite luminosity functions, diameter and electron density distributions, and several scaling relations, and compare them to those already derived for gas-rich, unperturbed systems identified during the VESTIGE survey. The analysis shows that the statistical and physical properties of HI gas-deficient cluster galaxies are different from those of unperturbed systems, with perturbed objects having a steeper faint-end slope and a brighter characteristic Ha luminosity than gas-rich galaxies. The difference in the two distributions comes principally from the outer disc (outside the effective radius). The analysis of the scaling relations indicates that perturbed objects have a lower number of HII regions per unit stellar mass and disc surface than unperturbed systems, with differences increasing with the HI-deficiency parameter, principally in the outer disc where HII regions are less present in gas-poor systems. All these differences can be explained in the framework of galaxy evolution in rich environments, where their hydrodynamic interaction with the surrounding ICM (ram pressure) removes the gas outside-in quenching the star formation activity in the outer disc once the HI is removed.
Editorial analysis
A structured set of objections, weighed in public.
Referee Report
Summary. The manuscript uses VESTIGE narrow-band Hα+[NII] imaging to identify 76,645 HII regions in 322 star-forming Virgo galaxies (385 total with emission), focusing on HI-deficient perturbed systems above the L(Hα) ≥ 10^37 erg s^{-1} completeness limit. It constructs composite luminosity functions, diameter and electron density distributions, and scaling relations, comparing them to unperturbed gas-rich galaxies from the same survey. Perturbed galaxies show a steeper faint-end slope and brighter characteristic Hα luminosity, with differences concentrated in the outer disc; they also exhibit fewer HII regions per unit stellar mass and disc surface area, increasing with HI deficiency. These are interpreted as signatures of outside-in quenching via ram-pressure stripping by the ICM.
Significance. The large sample from a blind cluster survey enables statistically meaningful composite distributions that, if robust, would strengthen evidence for environmental quenching mechanisms in dense environments. The focus on outer-disc differences and scaling with HI deficiency directly tests the ram-pressure scenario. However, the overall significance depends on confirming that the reported differences are not driven by unaccounted sample biases.
major comments (3)
- [§3] §3 (sample definition): The selection of perturbed galaxies via HI deficiency relative to 'similar objects' in the field, and any explicit matching on stellar mass, morphology, or other properties, must be described in detail. The central claim that differences in the faint-end slope, characteristic luminosity, and outer-disc HII region counts arise from ram pressure requires that this selection isolates environmental effects; without it, residual composition differences could produce the observed trends.
- [§4.2] §4.2 (luminosity functions): The fitting procedure for the composite Hα luminosity functions—including the adopted functional form, incorporation of the stated completeness limit, and propagation of uncertainties on the faint-end slope and characteristic luminosity—must be provided. The reported steeper slope and brighter L* in perturbed galaxies are load-bearing for the quenching interpretation, yet the current description does not allow assessment of whether these differences are statistically significant or sensitive to analysis choices.
- [§4.3] §4.3 (radial analysis): The definition of the effective radius used to separate inner and outer discs, and the quantitative method for measuring the reduced number of HII regions per unit stellar mass in the outer disc, require explicit description. This radial dependence is central to the outside-in quenching claim and must be shown to be independent of how galaxies are binned by HI deficiency.
minor comments (2)
- [Abstract] The abstract refers to 'several scaling relations' without naming them; listing the specific relations (e.g., N_HII vs. M*, surface density) would improve readability.
- Ensure uniform terminology between 'perturbed', 'HI gas-deficient', and 'gas-poor' throughout the text and figures.
Simulated Author's Rebuttal
We thank the referee for their detailed and constructive comments on our manuscript. These have prompted us to clarify several aspects of our analysis. We address each major comment below and indicate the revisions we will make to the manuscript.
read point-by-point responses
-
Referee: [§3] §3 (sample definition): The selection of perturbed galaxies via HI deficiency relative to 'similar objects' in the field, and any explicit matching on stellar mass, morphology, or other properties, must be described in detail. The central claim that differences in the faint-end slope, characteristic luminosity, and outer-disc HII region counts arise from ram pressure requires that this selection isolates environmental effects; without it, residual composition differences could produce the observed trends.
Authors: We agree that a more detailed description of the sample selection is essential to support our interpretation. In the revised manuscript, we will expand Section 3 to explicitly describe: the calculation of the HI deficiency parameter using the reference field sample from the literature; the criteria used to identify 'similar objects' including any matching on stellar mass, morphological type, and other relevant properties; and an assessment of potential residual biases in the sample composition. This will help demonstrate that the observed differences are attributable to environmental effects such as ram-pressure stripping. revision: yes
-
Referee: [§4.2] §4.2 (luminosity functions): The fitting procedure for the composite Hα luminosity functions—including the adopted functional form, incorporation of the stated completeness limit, and propagation of uncertainties on the faint-end slope and characteristic luminosity—must be provided. The reported steeper slope and brighter L* in perturbed galaxies are load-bearing for the quenching interpretation, yet the current description does not allow assessment of whether these differences are statistically significant or sensitive to analysis choices.
Authors: We acknowledge that the description of the luminosity function fitting was insufficient. The composite LFs were constructed by stacking the HII regions from the respective samples and fitted with a Schechter function for luminosities above the completeness limit of 10^37 erg s^{-1}. In the revised version, we will detail the fitting procedure, including the functional form, how the completeness limit is accounted for (by restricting the fit to L(Hα) ≥ 10^37 erg s^{-1} and using maximum likelihood estimation), and the uncertainty estimation method (via bootstrap resampling of the galaxy samples to propagate errors on the faint-end slope α and characteristic luminosity L*). We will also include a statistical comparison (e.g., likelihood ratio test) to confirm the significance of the differences between perturbed and unperturbed galaxies. revision: yes
-
Referee: [§4.3] §4.3 (radial analysis): The definition of the effective radius used to separate inner and outer discs, and the quantitative method for measuring the reduced number of HII regions per unit stellar mass in the outer disc, require explicit description. This radial dependence is central to the outside-in quenching claim and must be shown to be independent of how galaxies are binned by HI deficiency.
Authors: We thank the referee for pointing out the need for clarity in the radial analysis. The effective radius is taken from the literature or derived from the stellar mass distribution as the radius enclosing 50% of the total stellar light. The number of HII regions per unit stellar mass in the outer disc is computed by summing HII regions beyond the effective radius and normalizing by the stellar mass within the outer disc (or total stellar mass, as appropriate). In the revised manuscript, we will provide explicit definitions and formulas for these quantities, describe the binning by HI deficiency parameter, and present checks demonstrating that the trends are robust to different binning schemes. This will reinforce the outside-in quenching scenario. revision: yes
Circularity Check
No significant circularity in derivation chain
full rationale
The paper presents independent measurements of HII region properties (luminosity functions, diameters, densities, scaling relations) from new VESTIGE narrow-band imaging of 322 star-forming galaxies, focusing on the HI-deficient perturbed subsample. These are compared to previously published results for unperturbed galaxies from the same survey series, but the new data and derivations stand alone without any reduction to fitted parameters, self-definitions, or ansatzes imported via citation. The interpretive framework invoking ram-pressure stripping is explanatory rather than a mathematical derivation that loops back to the inputs. No self-definitional, fitted-input-as-prediction, uniqueness-theorem, or renaming patterns appear in the provided derivation steps.
Axiom & Free-Parameter Ledger
axioms (2)
- domain assumption HI deficiency parameter reliably flags galaxies experiencing ram-pressure perturbation by the intracluster medium.
- domain assumption Narrow-band H-alpha+[NII] emission primarily traces ionization by young stars in HII regions with limited contamination.
Reference graph
Works this paper leans on
-
[1]
Ambrocio-Cruz, P., Le Coarer, E., Rosado, M., et al.\ 2016, , 457, 2048
2016
-
[2]
& Couch, W
Bekki, K. & Couch, W. J.\ 2003, , 596, L13
2003
-
[3]
L., McGee, S
Bellhouse, C., Jaff \'e , Y. L., McGee, S. L., et al.\ 2019, , 485, 1, 1157
2019
-
[4]
A.\ 1985, , 90, 1681
Binggeli, B., Sandage, A., & Tammann, G. A.\ 1985, , 90, 1681
1985
-
[5]
& Rosolowsky, E.\ 2006, , 650, 2, 933
Blitz, L. & Rosolowsky, E.\ 2006, , 650, 2, 933
2006
-
[6]
Boselli, A., & Gavazzi, G.\ 2006, , 118, 517
2006
-
[7]
Boselli, A., & Gavazzi, G.\ 2014, , 22, 74
2014
-
[8]
Boselli, A., Boissier, S., Cortese, L., et al.\ 2006, , 651, 811
2006
-
[9]
Boselli, A., Boissier, S., Cortese, L., & Gavazzi, G.\ 2008a, , 674, 742
-
[10]
Boselli, A., Boissier, S., Cortese, L., & Gavazzi, G.\ 2008b, , 489, 1015
-
[11]
Boselli, A., Boissier, S., Cortese, L., et al.\ 2009, , 706, 1527
2009
-
[12]
Boselli, A., Voyer, E., Boissier, S., et al.\ 2014a, , 570, AA69
-
[13]
Boselli, A., Cortese, L., Boquien, M., et al.\ 2014b, , 564, A67
-
[14]
Boselli, A., Fossati, M., Gavazzi, G., et al.\ 2015, , 579, A102
2015
-
[15]
Boselli, A., Fossati, M., Ferrarese, L., et al.\ 2018a, , 614, A56
-
[16]
Boselli, A., Fossati, M., Longobardi, A., et al.\ 2019, , 623, A52
2019
-
[17]
Boselli, A., Fossati, M., Longobardi, A., et al.\ 2020, , 634, L1
2020
-
[18]
Boselli, A., Lupi, A., Epinat, B., et al.\ 2021, , 646, A139
2021
-
[19]
Boselli, A., Fossati, M., Longobardi, A., et al.\ 2022a, , 659, A46
-
[20]
Boselli, A., Fossati, M., & Sun, M.\ 2022b, , 30, 3
-
[21]
Boselli, A., Fossati, M., Roediger, J., et al.\ 2023a, , 669, A73
-
[22]
Boselli, A., Fossati, M., C \^o t \'e , P., et al.\ 2023b, , 675, A123
-
[23]
Boselli, A., Fossati, M., Roehlly, Y., et al.\ 2025, , 696, A78
2025
-
[24]
& Corbelli, E.\ 2026, , 708, A350
Braine, J. & Corbelli, E.\ 2026, , 708, A350
2026
-
[25]
H., et al.\ 2000, , 119, 2, 580
Bravo-Alfaro, H., Cayatte, V., van Gorkom, J. H., et al.\ 2000, , 119, 2, 580
2000
-
[26]
D., Zabel, N., et al.\ 2021, , 257, 21
Brown, T., Wilson, C. D., Zabel, N., et al.\ 2021, , 257, 21
2021
-
[27]
D., Thorp, M., et al.\ 2023, , 956, 1, 37
Brown, T., Roberts, I. D., Thorp, M., et al.\ 2023, , 956, 1, 37
2023
-
[28]
Brown, T., Cortese, L., Catinella, B., et al.\ 2026, arXiv:2604.20056
work page internal anchor Pith review Pith/arXiv arXiv 2026
-
[29]
P., Ferrarese, L., et al.\ 2024, , 966, 1, 145
Cantiello, M., Blakeslee, J. P., Ferrarese, L., et al.\ 2024, , 966, 1, 145
2024
-
[30]
Cattorini, F., Gavazzi, G., Boselli, A., et al.\ 2023, , 671, A118
2023
-
[31]
H., Balkowski, C., & Kotanyi, C.\ 1990, , 100, 604
Cayatte, V., van Gorkom, J. H., Balkowski, C., & Kotanyi, C.\ 1990, , 100, 604
1990
-
[32]
Cayatte, V., Kotanyi, C., Balkowski, C., et al.\ 1994, , 107, 1003
1994
-
[33]
Chabrier, G.\ 2003, , 115, 763
2003
-
[34]
H., Kenney, J
Chung, A., van Gorkom, J. H., Kenney, J. D. P., et al. \ 2009, , 138, 1741
2009
-
[35]
I., Pohlen, M., et al.\ 2010, , 518, L49
Cortese, L., Davies, J. I., Pohlen, M., et al.\ 2010, , 518, L49
2010
-
[36]
Cortese, L., Fritz, J., Bianchi, S., et al.\ 2014, , 440, 942
2014
-
[37]
Cortese, L., Catinella, B., & Smith, R.\ 2021, , 38, e035
2021
-
[38]
L., & Songaila, A.\ 1977, , 266, 501
Cowie, L. L., & Songaila, A.\ 1977, , 266, 501
1977
-
[39]
L., Patton, D., Simard, L., & McConnachie, A.\ 2008, , 135, 1877
Ellison, S. L., Patton, D., Simard, L., & McConnachie, A.\ 2008, , 135, 1877
2008
-
[40]
L., Nair, P., Patton, D
Ellison, S. L., Nair, P., Patton, D. R., et al.\ 2011, , 416, 3, 2182
2011
-
[41]
& Hobson, M
Feroz, F. & Hobson, M. P.\ 2008, , 384, 449
2008
-
[42]
P., Cameron, E., et al.\ 2019, The Open Journal of Astrophysics, 2, 10
Feroz, F., Hobson, M. P., Cameron, E., et al.\ 2019, The Open Journal of Astrophysics, 2, 10
2019
-
[43]
Ferrarese, L., C \^o t \'e , P., Cuillandre, J.-C., et al.\ 2012, , 200, 4
2012
-
[44]
Fossati, M., Gavazzi, G., Savorgnan, G., et al.\ 2013, , 553, A91
2013
-
[45]
Fossati, M., Fumagalli, M., Boselli, A., et al.\ 2016, , 455, 2028
2016
-
[46]
Fossati, M., Fumagalli, M., Gavazzi, G., et al.\ 2019, , 484, 2212
2019
-
[47]
K., et al.\ 2021, , 503, 3044
Fossati, M., Fumagalli, M., Lofthouse, E. K., et al.\ 2021, , 503, 3044
2021
-
[48]
& Nagashima, M.\ 1999, , 516, 619
Fujita, Y. & Nagashima, M.\ 1999, , 516, 619
1999
-
[49]
R., Prochaska, J
Fumagalli, M., Krumholz, M. R., Prochaska, J. X., et al.\ 2009, , 697, 1811
2009
-
[50]
Gavazzi, G., Contursi, A., Carrasco, L., et al.\ 1995, , 304, 325
1995
-
[51]
Gavazzi, G., Boselli, A., Mayer, L., et al.\ 2001, , 563, L23
2001
-
[52]
Gavazzi, G., Boselli, A., Donati, A., et al.\ 2003, , 400, 451
2003
-
[53]
E., & Gott, J
Gunn, J. E., & Gott, J. R., III 1972, , 176, 1
1972
-
[54]
Haynes, M. P. & Giovanelli, R.\ 1984, , 89, 758
1984
-
[55]
F., Walterbos, R
Helmboldt, J. F., Walterbos, R. A. M., Bothun, G. D., et al.\ 2005, , 630, 824
2005
-
[56]
& Bekki, K.\ 2016, , 822, L33
Henderson, B. & Bekki, K.\ 2016, , 822, L33
2016
-
[57]
D., Akritas, M
Isobe, T., Feigelson, E. D., Akritas, M. G., et al.\ 1990, , 364, 104
1990
-
[58]
J., Brown, T., Wilson, C
Jim \'e nez-Donaire, M. J., Brown, T., Wilson, C. D., et al.\ 2023, , 671, A3
2023
-
[59]
C., Jr.\ 1998, , 36, 189
Kennicutt, R. C., Jr.\ 1998, , 36, 189
1998
-
[60]
Koopmann, R. A. & Kenney, J. D. P.\ 2004, , 613, 866
2004
-
[61]
Koopmann, R. A. & Kenney, J. D. P.\ 2004, , 613, 851
2004
-
[62]
A., Haynes, M
Koopmann, R. A., Haynes, M. P., & Catinella, B.\ 2006, , 131, 716
2006
-
[63]
B., Tinsley, B
Larson, R. B., Tinsley, B. M., & Caldwell, C. N.\ 1980, , 237, 692
1980
-
[64]
Liz \'e e, T., Vollmer, B., Braine, J., et al.\ 2021, , 645, A111
2021
-
[65]
Loni, A., Serra, P., Kleiner, D., et al.\ 2021, , 648, A31
2021
-
[66]
W., et al.\ 2015, , 811, 141
Mehta, V., Scarlata, C., Colbert, J. W., et al.\ 2015, , 811, 141
2015
-
[67]
Merritt, D.\ 1983, , 264, 24
1983
-
[68]
D., Knapen, J
Mok, A., Wilson, C. D., Knapen, J. H., et al.\ 2017, , 467, 4282
2017
-
[69]
Moore, B., Katz, N., Lake, G., et al.\ 1996, , 379, 613
1996
-
[70]
R., Balogh, M
Morgan, C. R., Balogh, M. L., Boselli, A., et al.\ 2024, , 691, A20
2024
-
[71]
Nehlig, F., Vollmer, B., & Braine, J.\ 2016, , 587, A108
2016
-
[72]
E., & Ferland, G
Osterbrock, D. E., & Ferland, G. J.\ 2006, Astrophysics of gaseous nebulae and active galactic nuclei, 2nd. ed. by D.E. Osterbrock and G.J. Ferland. Sausalito, CA: University Science Books, 2006,
2006
-
[73]
Pedrini, A., Fossati, M., Gavazzi, G., et al.\ 2022, , 511, 5180
2022
-
[74]
Santoro, F., Kreckel, K., Belfiore, F., et al.\ 2022, , 658, A188
2022
-
[75]
L.\ 1986, Reviews of Modern Physics, 58, 1
Sarazin, C. L.\ 1986, Reviews of Modern Physics, 58, 1
1986
-
[76]
Schechter, P.\ 1976, , 203, 297
1976
-
[77]
Z., Polletta, M., Ewald, S., et al.\ 2001, , 122, 3017
Scoville, N. Z., Polletta, M., Ewald, S., et al.\ 2001, , 122, 3017
2001
-
[78]
Shi, Y., Yan, L., Armus, L., et al.\ 2018, , 853, 2, 149
2018
-
[79]
L., & Pauldrach, A
Sternberg, A., Hoffmann, T. L., & Pauldrach, A. W. A.\ 2003, , 599, 1333
2003
-
[80]
Steyrleithner, P., Hensler, G., & Boselli, A.\ 2020, , 494, 1114
2020
discussion (0)
Sign in with ORCID, Apple, or X to comment. Anyone can read and Pith papers without signing in.