Recognition: unknown
MAUVE-MUSE: Ionization and Kinematic Signatures of Environmental Effects on Virgo Cluster Disks
Pith reviewed 2026-05-10 01:17 UTC · model grok-4.3
The pith
Environmental quenching in Virgo galaxies suppresses star formation and reveals diffuse ionized gas as the main emitter.
A machine-rendered reading of the paper's core claim, the machinery that carries it, and where it could break.
Core claim
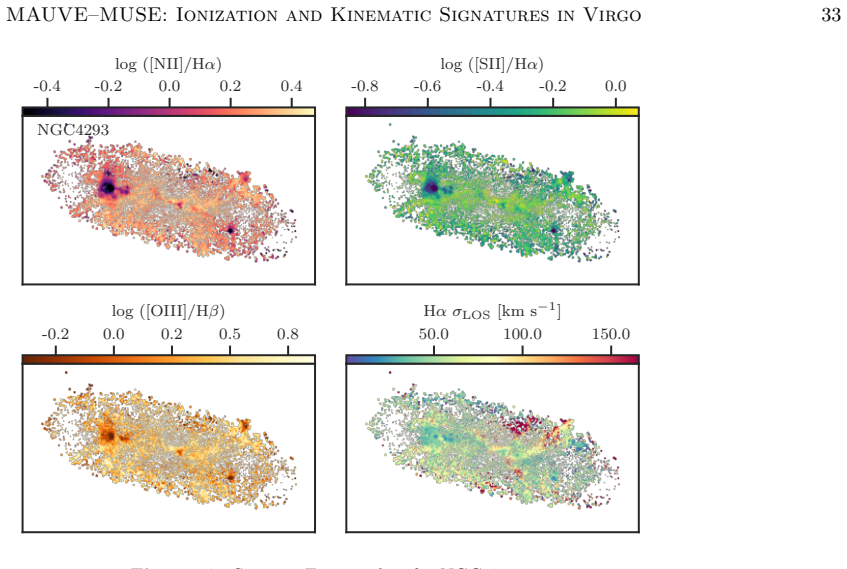
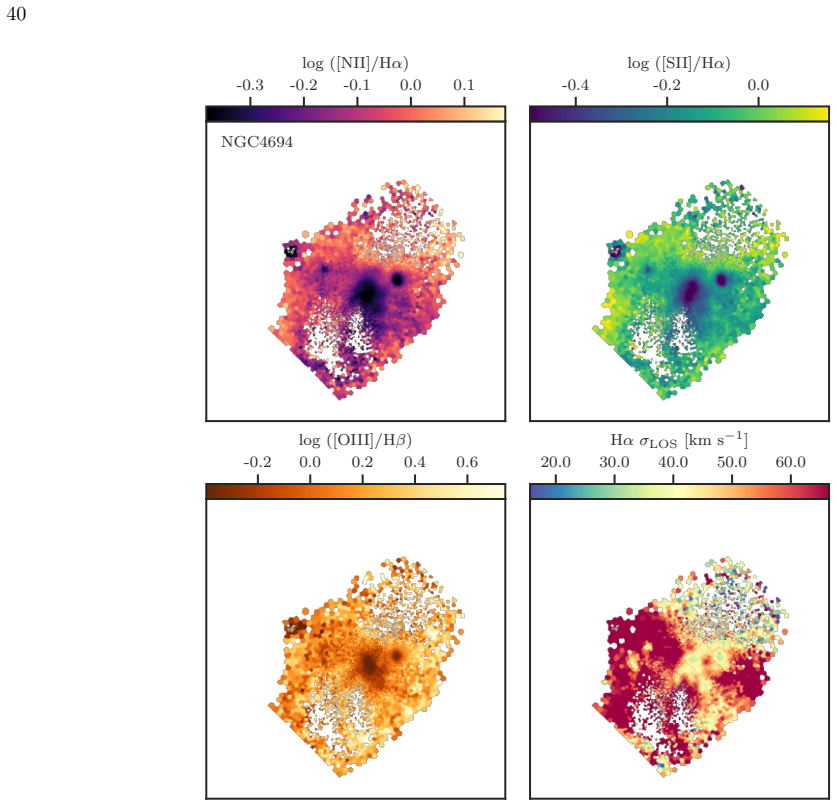
The MAUVE-MUSE early sample shows systematically elevated line ratios with medians of [N II]/Hα = 0.75, [S II]/Hα = 0.57, and [O III]/Hβ = 1.04 compared to 0.50, 0.49, and 0.68 in field disks. Spatially resolved BPT diagrams indicate 74% of spaxels are ionized by sources other than H II regions, versus 61% in the field. Kinematic analysis reveals 44% of spaxels with Hα σ_LOS > 40 km/s, driven by non-star-forming gas, and a 5% tail at σ_LOS > 100 km/s. These results demonstrate that environmental quenching primarily suppresses star formation, unveiling DIG as the dominant ionized component, with the elevated ratios and kinematics reflecting the ISM state absent vigorous star formation rather,
What carries the argument
Spatially resolved BPT diagrams and Hα line-of-sight velocity dispersion maps from MUSE spectroscopy that separate ionization sources from kinematic states in galaxy disks.
If this is right
- Quenching acts mainly by halting star formation, allowing DIG to dominate ionized gas emission in cluster disks.
- Line ratio elevations and kinematic broadening serve as indicators of the post-quenching ISM state.
- Shocks from intracluster medium interactions contribute a minor but detectable fraction of the emission.
- High-resolution observations at 100 pc scales are needed to separate these effects in cluster environments.
Where Pith is reading between the lines
- Similar observations in other galaxy clusters could test if this DIG dominance is a general feature of environmental quenching.
- Models of galaxy evolution in dense environments should account for increased DIG contributions when star formation declines.
- These signatures might be detectable in lower-resolution surveys to identify environmentally affected galaxies.
- Extending the sample size could clarify the relative roles of shocks versus DIG in driving the offsets.
Load-bearing premise
The sample of 12 MAUVE-MUSE galaxies is directly comparable to the PHANGS-MUSE field sample without selection biases or analysis differences that could produce the reported offsets in line ratios and kinematics.
What would settle it
A larger sample of Virgo galaxies observed with the same MUSE methods showing no systematic elevation in median line ratios or velocity dispersions compared to field galaxies would falsify the conclusion that quenching unveils DIG as the dominant ionized component.
Figures


read the original abstract
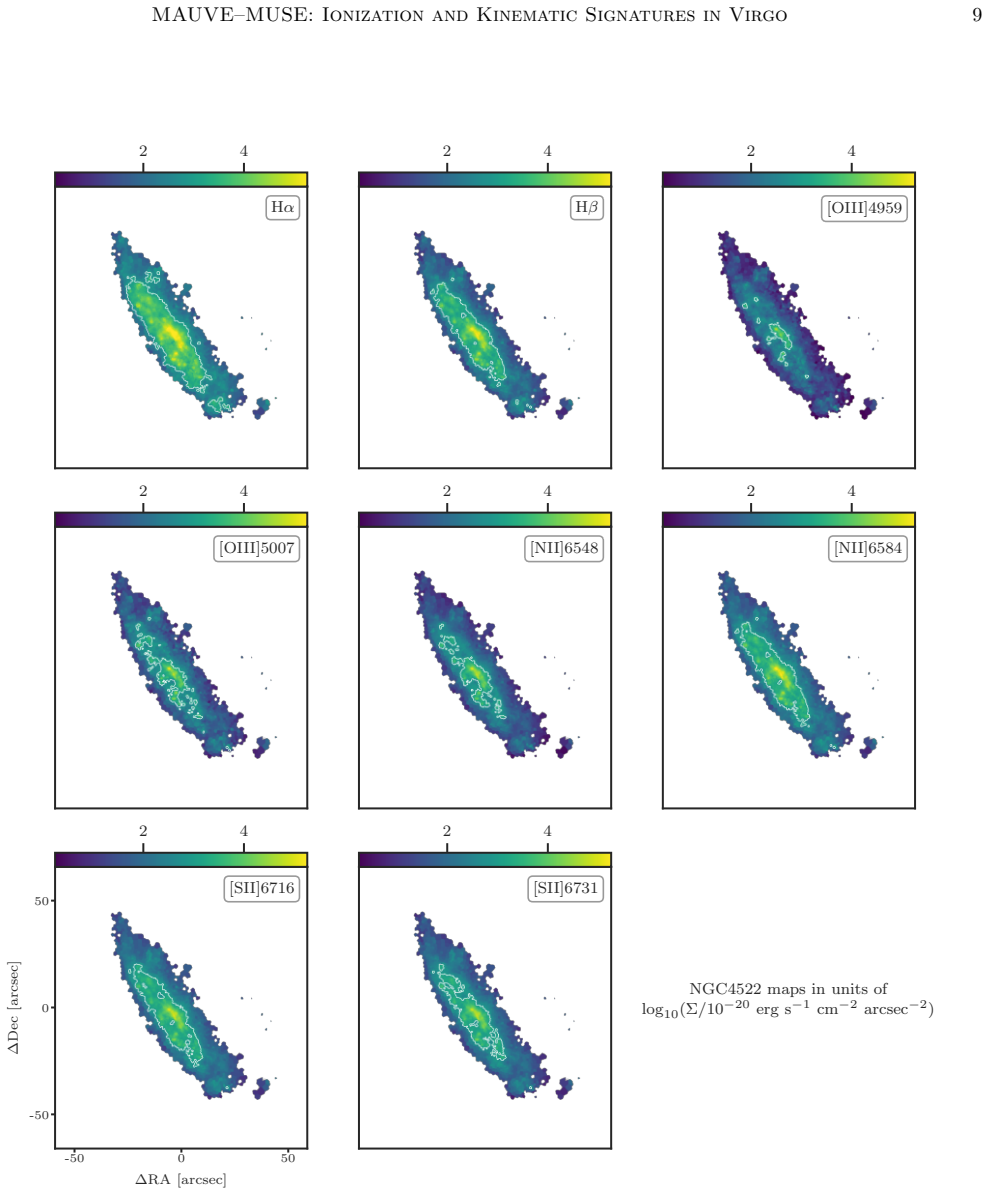
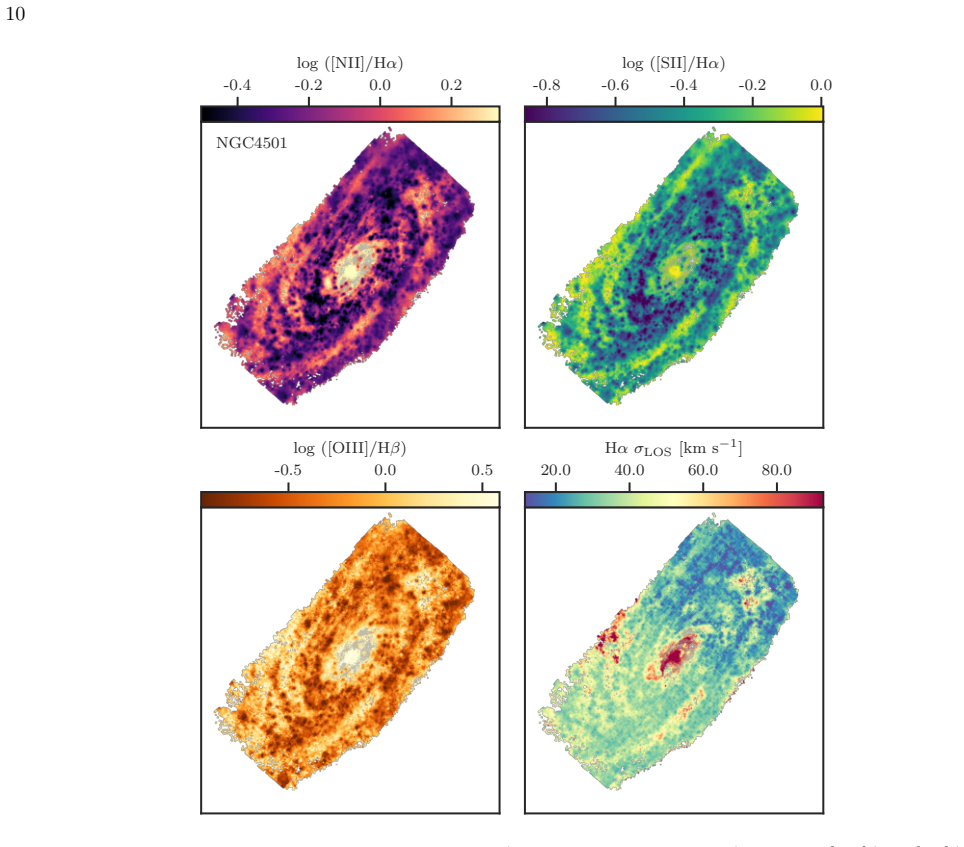
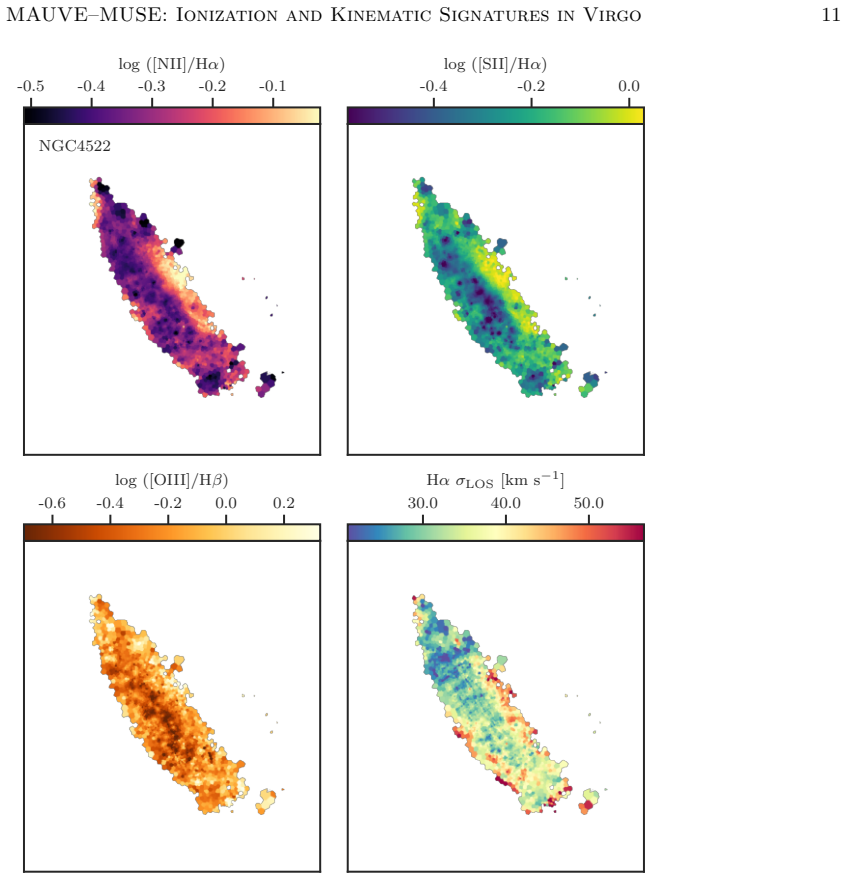
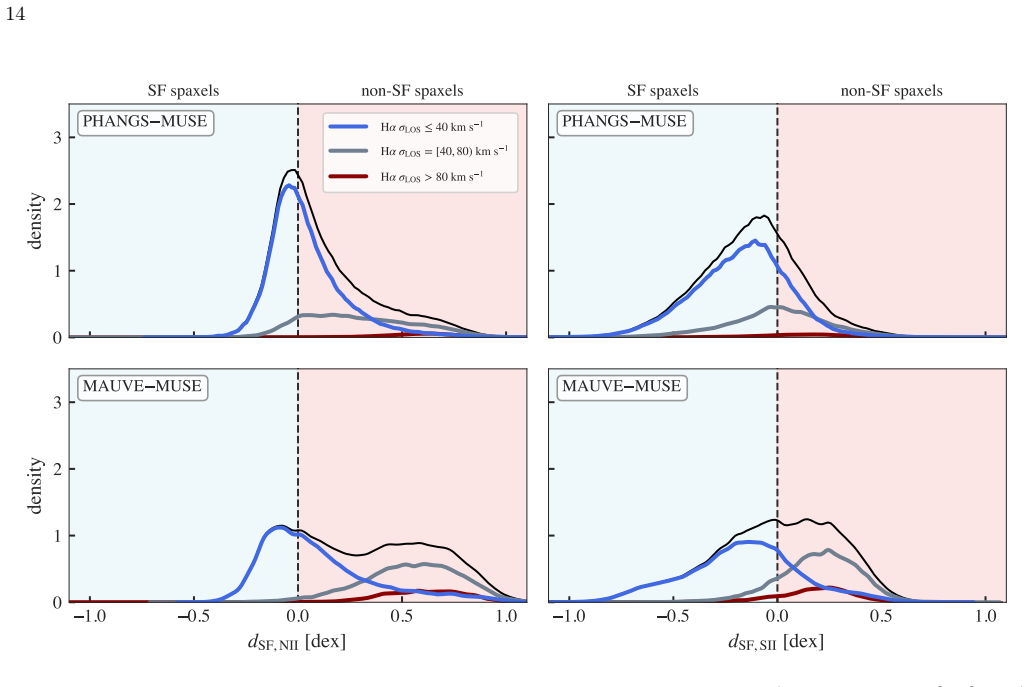
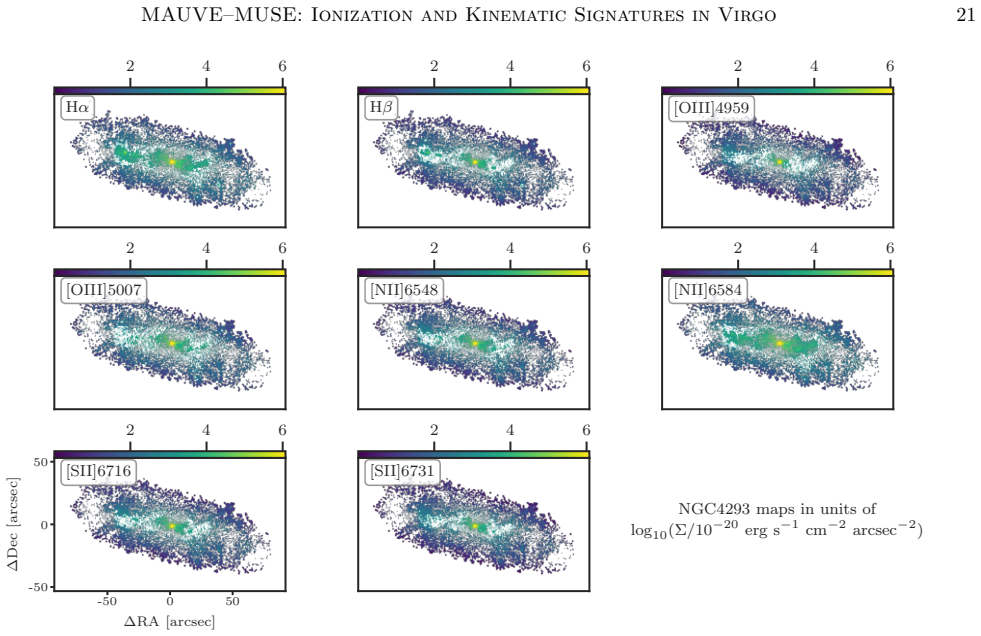
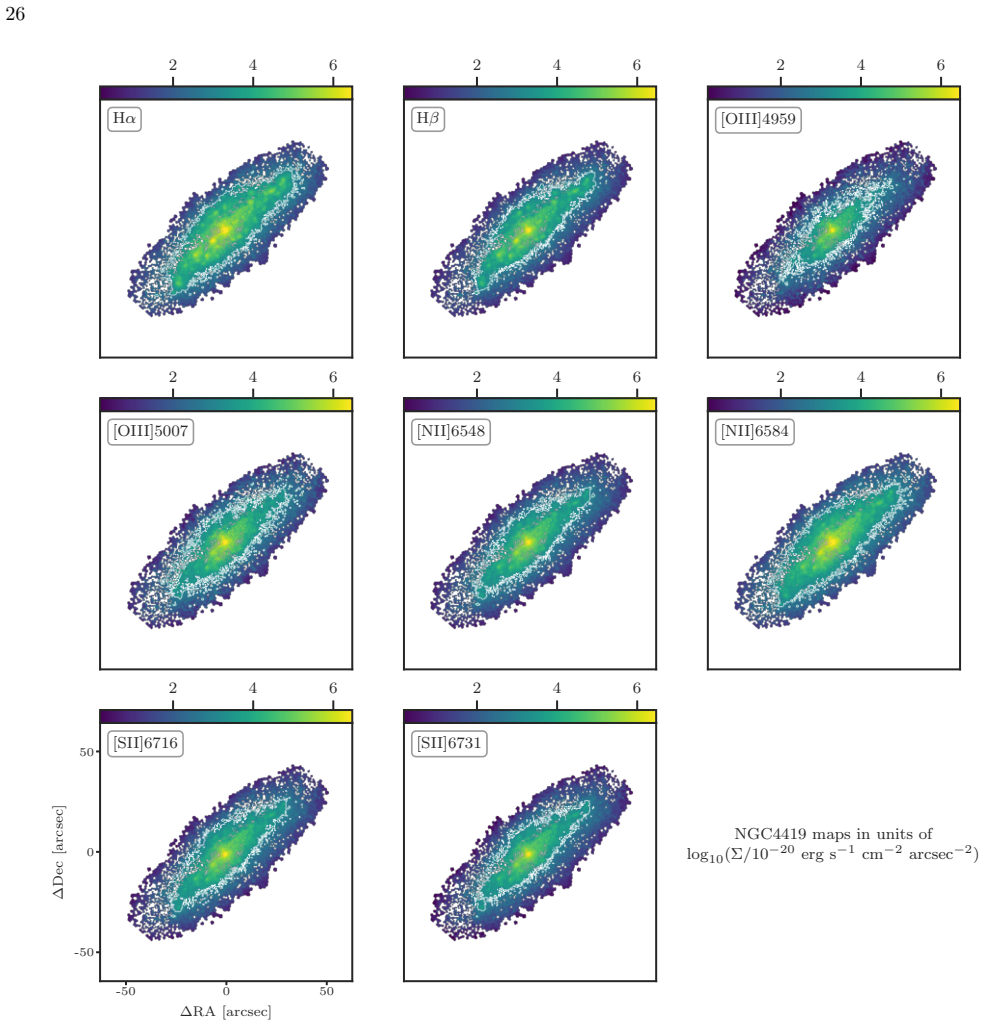
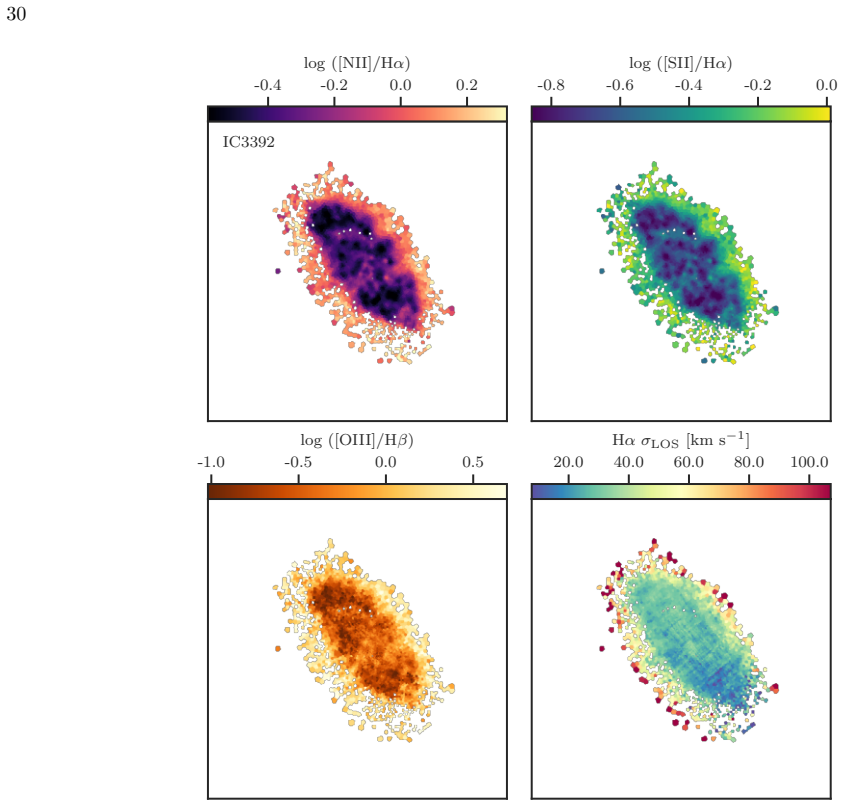
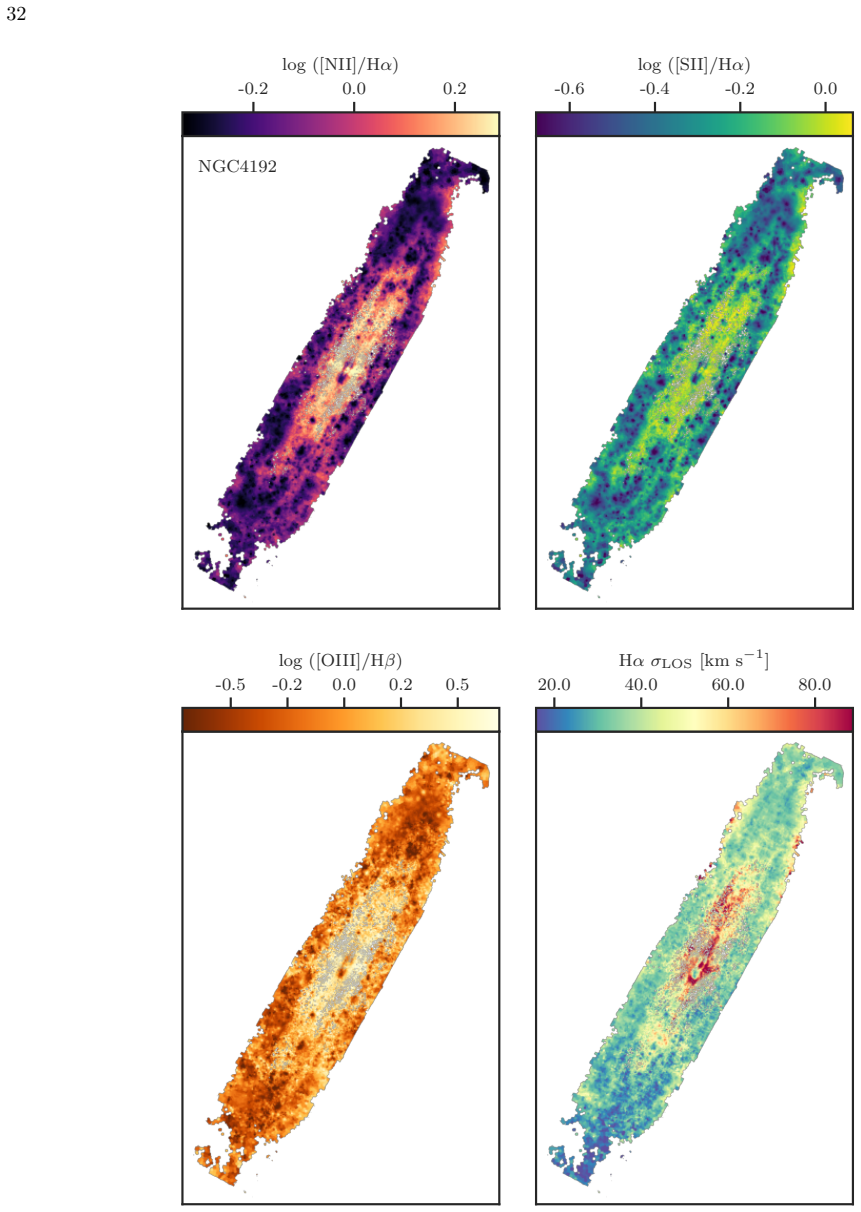
We present early science results from the MAUVE (Multiphase Astrophysics to Unveil the Virgo Environment) program which targets 40 Virgo Cluster galaxies to investigate the effect of environment on the interstellar medium (ISM) at ~100 pc scales. From 12 galaxies in the MAUVE-MUSE early sample, we find systematically elevated line ratios compared to PHANGS-MUSE field disks, with higher medians of [N II]/H$\alpha$ (0.75 vs. 0.50), [S II]/H$\alpha$ (0.57 vs. 0.49), and [O III]/H$\beta$ (1.04 vs. 0.68). Spatially resolved BPT diagrams show 74% of MAUVE-MUSE spaxels ionized by sources other than H II regions, versus 61% in the field, and we find these ionization differences to be closely coupled to broadened kinematics. 44% of MAUVE-MUSE spaxels exceed H$\alpha$ $\sigma_{LOS} = 40$ km/s (vs. 26% in the field), driven mainly by non-star-forming gas with $\sigma_{LOS}$ between 40 and 80 km/s, consistent with enhanced contribution of diffuse ionized gas (DIG). A subdominant tail of 5% of spaxels at $\sigma_{LOS} > 100$ km/s, largely absent in PHANGS-MUSE (1%), points to shocks or turbulent mixing layers from intracluster interactions. Our results show that environmental quenching primarily suppresses star formation, unveiling DIG as the dominant ionized component in cluster disks. The elevated line ratios and broadened kinematics observed in the MAUVE sample reflect the physical state of the ISM in the absence of vigorous star formation, rather than widespread direct environmental excitation. The observed shock-like emission provides an additional, secondary contribution likely driven by active interactions with the intracluster medium.
Editorial analysis
A structured set of objections, weighed in public.
Referee Report
Summary. The manuscript presents early results from the MAUVE-MUSE program targeting Virgo cluster galaxies with MUSE integral-field spectroscopy. From an initial sample of 12 disk galaxies, it reports systematically higher median emission-line ratios ([N II]/Hα = 0.75 vs. 0.50, [S II]/Hα = 0.57 vs. 0.49, [O III]/Hβ = 1.04 vs. 0.68) relative to the PHANGS-MUSE field sample, a higher fraction of spaxels ionized by non-H II sources (74% vs. 61%), and a larger fraction of spaxels with Hα velocity dispersion σ_LOS > 40 km/s (44% vs. 26%). These differences are interpreted as arising primarily from environmental quenching that suppresses star formation and increases the relative contribution of diffuse ionized gas (DIG), with a secondary ~5% tail of high-σ_LOS (>100 km/s) spaxels attributed to shocks or turbulent mixing from intracluster medium interactions.
Significance. If the sample comparison holds, the work provides valuable ~100 pc-scale constraints on how cluster environments modify the ionized ISM, supporting the view that quenching acts mainly by reducing the H II region contribution rather than through widespread direct excitation. The reported coupling between elevated line ratios and broadened kinematics offers a useful observational diagnostic for DIG dominance in quenched disks. The use of a dedicated MUSE program on a well-studied cluster is a clear strength for future multi-phase studies.
major comments (2)
- [Abstract and sample description] The central claim that environmental effects are responsible for the reported offsets in line ratios, non-H II fraction (74% vs. 61%), and kinematics requires that the MAUVE-MUSE early sample of 12 galaxies is statistically comparable to the PHANGS-MUSE field sample. The manuscript provides no explicit matching or comparison of stellar mass, SFR, morphological type, or inclination distributions, nor a selection function for the 12 galaxies out of the 40 targeted. Without these controls, the differences could originate from intrinsic galaxy properties rather than environment.
- [BPT analysis and ionization diagnostics] The non-H II spaxel fractions and median line ratios depend on the precise BPT classification boundaries and S/N cuts applied to spaxels. It is unclear whether identical selection criteria and error propagation were used for both MAUVE-MUSE and PHANGS-MUSE datasets, which could affect the 74% vs. 61% comparison and the attribution to DIG.
minor comments (2)
- [Introduction and sample selection] Clarify in the methods or results section how the 12-galaxy early sample was chosen from the full 40-galaxy target list and whether any bias toward particular morphologies or star-formation rates was introduced.
- [Figures] Ensure that all figures comparing MAUVE and PHANGS data use identical color bars, binning, and axis ranges to facilitate direct visual assessment of the reported offsets.
Simulated Author's Rebuttal
We thank the referee for their constructive comments and positive assessment of the work's significance. We address each of the major comments below.
read point-by-point responses
-
Referee: [Abstract and sample description] The central claim that environmental effects are responsible for the reported offsets in line ratios, non-H II fraction (74% vs. 61%), and kinematics requires that the MAUVE-MUSE early sample of 12 galaxies is statistically comparable to the PHANGS-MUSE field sample. The manuscript provides no explicit matching or comparison of stellar mass, SFR, morphological type, or inclination distributions, nor a selection function for the 12 galaxies out of the 40 targeted. Without these controls, the differences could originate from intrinsic galaxy properties rather than environment.
Authors: We agree that demonstrating sample comparability is essential for the central claim. In the revised manuscript we will add an explicit comparison of the stellar mass, SFR, morphological type, and inclination distributions between the MAUVE-MUSE early sample and the PHANGS-MUSE field sample. We will also describe the selection of the 12 galaxies (the first observed targets in the 40-galaxy program, chosen for disk morphology and observational accessibility) so that readers can evaluate whether the reported differences are attributable to environment. revision: yes
-
Referee: [BPT analysis and ionization diagnostics] The non-H II spaxel fractions and median line ratios depend on the precise BPT classification boundaries and S/N cuts applied to spaxels. It is unclear whether identical selection criteria and error propagation were used for both MAUVE-MUSE and PHANGS-MUSE datasets, which could affect the 74% vs. 61% comparison and the attribution to DIG.
Authors: We confirm that identical BPT boundaries and S/N thresholds were applied to both datasets, with the PHANGS-MUSE data re-analyzed using the same pipeline and error-propagation procedures as MAUVE-MUSE. We will expand the methods section to state these criteria explicitly and to detail the error handling for line ratios and spaxel classifications. revision: yes
Circularity Check
No circularity: purely observational comparison of measured line ratios and kinematics
full rationale
The paper reports direct measurements of emission-line ratios, BPT classifications, and Hα velocity dispersions from MUSE data on 12 Virgo galaxies, then compares medians and fractions to the PHANGS-MUSE field sample. No derivations, model fits, predictive equations, or self-referential definitions appear in the abstract or described results; the central claim follows immediately from the observed offsets without any step that reduces to a fitted parameter or prior self-citation by construction. The analysis is therefore self-contained against external benchmarks.
Axiom & Free-Parameter Ledger
axioms (2)
- domain assumption BPT line-ratio diagnostics reliably separate HII-region ionization from other sources such as DIG and shocks
- domain assumption Line-of-sight velocity dispersion thresholds (40 km/s, 100 km/s) trace distinct physical components (DIG vs shocks)
Forward citations
Cited by 1 Pith paper
-
A Virgo Environmental Survey Tracing Ionised Gas Emission (VESTIGE). XXI. Statistical properties of individual HII regions in perturbed galaxies
HI-deficient perturbed galaxies show steeper faint-end slopes in HII region luminosity functions, brighter characteristic luminosities, and fewer HII regions per unit stellar mass and disk area than unperturbed system...
Reference graph
Works this paper leans on
-
[1]
Abramson, A., Kenney, J. D. P., Crowl, H. H., et al. 2011, AJ, 141, 164, doi: 10.1088/0004-6256/141/5/164
-
[2]
Allen, M. G., Groves, B. A., Dopita, M. A., Sutherland, R. S., & Kewley, L. J. 2008, ApJS, 178, 20, doi: 10.1086/589652 Astropy Collaboration, Robitaille, T. P., Tollerud, E. J., et al. 2013, A&A, 558, A33, doi: 10.1051/0004-6361/201322068
-
[3]
2025, arXiv e-prints, arXiv:2512.10574, doi: 10.48550/arXiv.2512.10574
Attwater, A., Catinella, B., Cortese, L., et al. 2025, arXiv e-prints, arXiv:2512.10574, doi: 10.48550/arXiv.2512.10574
-
[4]
Bacon, R., Accardo, M., Adjali, L., et al. 2010, in Society of Photo-Optical Instrumentation Engineers (SPIE) Conference Series, Vol. 7735, Ground-based and Airborne Instrumentation for Astronomy III, ed. I. S. McLean, S. K. Ramsay, & H. Takami, 773508, doi: 10.1117/12.856027
-
[5]
Baldwin, J. A., Phillips, M. M., & Terlevich, R. 1981, PASP, 93, 5, doi: 10.1086/130766
-
[6]
2016, MNRAS, 461, 3111, doi: 10.1093/mnras/stw1234
Belfiore, F., Maiolino, R., Maraston, C., et al. 2016, MNRAS, 461, 3111, doi: 10.1093/mnras/stw1234
-
[7]
2022, A&A, 659, A26, doi: 10.1051/0004-6361/202141859
Belfiore, F., Santoro, F., Groves, B., et al. 2022, A&A, 659, A26, doi: 10.1051/0004-6361/202141859
-
[8]
Bertola, F., Corsini, E. M., Beltr´ an, J. C. V., et al. 1999, ApJL, 519, L127, doi: 10.1086/312111
-
[9]
G., Stasi´ nska, G., & Bruzual, A
Binette, L., Magris, C. G., Stasi´ nska, G., & Bruzual, A. G. 1994, A&A, 292, 13
1994
-
[10]
Boselli, A., Cortese, L., Boquien, M., et al. 2014, A&A, 564, A67, doi: 10.1051/0004-6361/201322313
-
[11]
Boselli, A., Fossati, M., & Sun, M. 2022, A&A Rv, 30, 3, doi: 10.1007/s00159-022-00140-3
-
[12]
Boselli, A., & Gavazzi, G. 2006, PASP, 118, 517, doi: 10.1086/500691
-
[13]
2020, astropy/photutils: 1.0.0 , 1.0.0, Zenodo, 10.5281/zenodo.4044744
Bradley, L., Sip˝ ocz, B., Robitaille, T., et al. 2020, astropy/photutils: 1.0.0, 1.0.0, Zenodo, doi: 10.5281/zenodo.4044744
-
[14]
2017, MNRAS, 466, 1275, doi: 10.1093/mnras/stw2991
Brown, T., Catinella, B., Cortese, L., et al. 2017, MNRAS, 466, 1275, doi: 10.1093/mnras/stw2991
-
[15]
Brown, T., Wilson, C. D., Zabel, N., et al. 2021, ApJS, 257, 21, doi: 10.3847/1538-4365/ac28f5
-
[16]
Improving the Full Spectrum Fitting Method: Accurate Convolution with
Cappellari, M. 2017, MNRAS, 466, 798, doi: 10.1093/mnras/stw3020 —. 2023, MNRAS, 526, 3273, doi: 10.1093/mnras/stad2597
work page internal anchor Pith review doi:10.1093/mnras/stw3020 2017
-
[17]
Cappellari, M., & Copin, Y. 2003, MNRAS, 342, 345, doi: 10.1046/j.1365-8711.2003.06541.x
-
[18]
Cappellari, M., & Emsellem, E. 2004, PASP, 116, 138, doi: 10.1086/381875
-
[19]
Cardelli, J. A., Clayton, G. C., & Mathis, J. S. 1989, ApJ, 345, 245, doi: 10.1086/167900
-
[20]
2025, The Messenger, 195, 15, doi: 10.18727/0722-6691/5393
Catinella, B., Cortese, L., Sun, J., et al. 2025, The Messenger, 195, 15, doi: 10.18727/0722-6691/5393
-
[21]
H., Balkowski, C., & Kotanyi, C
Cayatte, V., van Gorkom, J. H., Balkowski, C., & Kotanyi, C. 1990, AJ, 100, 604, doi: 10.1086/115545
-
[22]
Chung, A., van Gorkom, J. H., Kenney, J. D. P., Crowl, H., & Vollmer, B. 2009, AJ, 138, 1741, doi: 10.1088/0004-6256/138/6/1741
-
[23]
Collins, J. A., & Rand, R. J. 2001, ApJ, 551, 57, doi: 10.1086/320072
-
[24]
Cortese, L., Catinella, B., & Smith, R. 2021, PASA, 38, e035, doi: 10.1017/pasa.2021.18
-
[25]
2012, A&A, 544, A101, doi: 10.1051/0004-6361/201219312
Cortese, L., Boissier, S., Boselli, A., et al. 2012, A&A, 544, A101, doi: 10.1051/0004-6361/201219312
-
[26]
Cowie, L. L., & Songaila, A. 1977, Nature, 266, 501, doi: 10.1038/266501a0 den Brok, M., Carollo, C. M., Erroz-Ferrer, S., et al. 2020, MNRAS, 491, 4089, doi: 10.1093/mnras/stz3184
-
[27]
Dressler, A. 1980, ApJ, 236, 351, doi: 10.1086/157753
-
[28]
W., de Gasperin, F., Shimwell, T
Edler, H. W., de Gasperin, F., Shimwell, T. W., et al. 2023, A&A, 676, A24, doi: 10.1051/0004-6361/202346458
-
[29]
and Congiu, Enrico and Groves, Brent and Ho, I
Emsellem, E., Schinnerer, E., Santoro, F., et al. 2022, A&A, 659, A191, doi: 10.1051/0004-6361/202141727
-
[30]
Erroz-Ferrer, S., Carollo, C. M., den Brok, M., et al. 2019, MNRAS, 484, 5009, doi: 10.1093/mnras/stz194
-
[31]
Hunter, D. A. 1996, AJ, 111, 2265, doi: 10.1086/117961
-
[32]
, archivePrefix = "arXiv", eprint =
Flores-Fajardo, N., Morisset, C., Stasi´ nska, G., & Binette, L. 2011, MNRAS, 415, 2182, doi: 10.1111/j.1365-2966.2011.18848.x
-
[33]
2016, MNRAS, 455, 2028, doi: 10.1093/mnras/stv2400
Fossati, M., Fumagalli, M., Boselli, A., et al. 2016, MNRAS, 455, 2028, doi: 10.1093/mnras/stv2400
-
[34]
Fossati, M., Mendel, J. T., Boselli, A., et al. 2018, A&A, 614, A57, doi: 10.1051/0004-6361/201732373
-
[35]
Fraser-McKelvie, A., van de Sande, J., Gadotti, D. A., et al. 2024, arXiv e-prints, arXiv:2411.03430, doi: 10.48550/arXiv.2411.03430
-
[36]
2025, nGIST: The new Galaxy Integral-field Spectroscopy Tool, Astrophysics Source Code Library, record ascl:2507.015
Fraser-McKelvie, A., van de Sande, J., Brown, T., et al. 2025, nGIST: The new Galaxy Integral-field Spectroscopy Tool, Astrophysics Source Code Library, record ascl:2507.015
2025
-
[37]
Giovanelli, R., & Haynes, M. P. 1983, AJ, 88, 881, doi: 10.1086/113376
-
[38]
, year = 1972, month = aug, volume =
Gunn, J. E., & Gott, III, J. R. 1972, ApJ, 176, 1, doi: 10.1086/151605
-
[39]
Haynes, M. P., & Giovanelli, R. 1986, ApJ, 306, 466, doi: 10.1086/164357
-
[40]
P., Giovanelli, R., & Chincarini, G
Haynes, M. P., Giovanelli, R., & Chincarini, G. L. 1984, ARA&A, 22, 445, doi: 10.1146/annurev.aa.22.090184.002305 MAUVE–MUSE: Ionization and Kinematic Signatures in Virgo43
-
[41]
Hunter, J. D. 2007, Computing in Science & Engineering, 9, 90, doi: 10.1109/MCSE.2007.55
-
[42]
Kauffmann, G., Heckman, T. M., Tremonti, C., et al. 2003, MNRAS, 346, 1055, doi: 10.1111/j.1365-2966.2003.07154.x
-
[43]
Kenney, J. D. P., & Koopmann, R. A. 1999, AJ, 117, 181, doi: 10.1086/300683
-
[44]
Kewley, L. J., Dopita, M. A., Sutherland, R. S., Heisler, C. A., & Trevena, J. 2001, ApJ, 556, 121, doi: 10.1086/321545
-
[45]
Koopmann, R. A., & Kenney, J. D. P. 2004, ApJ, 613, 866, doi: 10.1086/423191
-
[46]
Koopmann, R. A., Kenney, J. D. P., & Young, J. 2001, ApJS, 135, 125, doi: 10.1086/323532
-
[47]
2001, MNRAS, 322, 231, doi: 10.1046/j.1365-8711.2001.04022.x
Kroupa, P. 2001, MNRAS, 322, 231, doi: 10.1046/j.1365-8711.2001.04022.x
-
[48]
2018, ApJL, 866, L10, doi: 10.3847/2041-8213/aae4d9
Lee, B., & Chung, A. 2018, ApJL, 866, L10, doi: 10.3847/2041-8213/aae4d9
-
[49]
Leroy, A. K., Sandstrom, K. M., Lang, D., et al. 2019, ApJS, 244, 24, doi: 10.3847/1538-4365/ab3925
-
[50]
2020, A&A, 644, A161, doi: 10.1051/0004-6361/202039020
Longobardi, A., Boselli, A., Fossati, M., et al. 2020, A&A, 644, A161, doi: 10.1051/0004-6361/202039020
-
[51]
Mei, S., Blakeslee, J. P., Cˆ ot´ e, P., et al. 2007, ApJ, 655, 144, doi: 10.1086/509598
-
[52]
Molina, M., Eracleous, M., Barth, A. J., et al. 2018, ApJ, 864, 90, doi: 10.3847/1538-4357/aad5ed
-
[53]
1996, Nature, 379, 613, doi: 10.1038/379613a0
Moore, B., Katz, N., Lake, G., Dressler, A., & Oemler, A. 1996, Nature, 379, 613, doi: 10.1038/379613a0
-
[54]
2016, A&A, 587, A108, doi: 10.1051/0004-6361/201527021
Nehlig, F., Vollmer, B., & Braine, J. 2016, A&A, 587, A108, doi: 10.1051/0004-6361/201527021
-
[55]
2022, MNRAS, 511, 5180, doi: 10.1093/mnras/stac345
Pedrini, A., Fossati, M., Gavazzi, G., et al. 2022, MNRAS, 511, 5180, doi: 10.1093/mnras/stac345
-
[56]
W., Reissl, S., Rahner, D., et al
Pellegrini, E. W., Reissl, S., Rahner, D., et al. 2020, MNRAS, 498, 3193, doi: 10.1093/mnras/staa2555
-
[57]
Peng, Y.-j., Lilly, S. J., Kovaˇ c, K., et al. 2010, ApJ, 721, 193, doi: 10.1088/0004-637X/721/1/193
-
[58]
and Moretti, Alessia and Gullieuszik, Marco and Fritz, Jacopo and Jaff
Poggianti, B. M., Moretti, A., Gullieuszik, M., et al. 2017, ApJ, 844, 48, doi: 10.3847/1538-4357/aa78ed
-
[59]
The Astronomical Journal , author =
Price-Whelan, A. M., Sip˝ ocz, B. M., G¨ unther, H. M., et al. 2018, AJ, 156, 123, doi: 10.3847/1538-3881/aabc4f
-
[60]
Rich, J. A., Kewley, L. J., & Dopita, M. A. 2011, ApJ, 734, 87, doi: 10.1088/0004-637X/734/2/87
-
[61]
2022, A&A, 658, A188, doi: 10.1051/0004-6361/202141907
Santoro, F., Kreckel, K., Belfiore, F., et al. 2022, A&A, 658, A188, doi: 10.1051/0004-6361/202141907
-
[62]
2013, A&A, 558, A43, doi: 10.1051/0004-6361/201322062
Singh, R., van de Ven, G., Jahnke, K., et al. 2013, A&A, 558, A43, doi: 10.1051/0004-6361/201322062
-
[63]
M., Manrique, A., Garc´ ıa-G´ omez, C., et al
Solanes, J. M., Manrique, A., Garc´ ıa-G´ omez, C., et al. 2001, ApJ, 548, 97, doi: 10.1086/318672
-
[64]
Tonnesen, S., & Bryan, G. L. 2012, MNRAS, 422, 1609, doi: 10.1111/j.1365-2966.2012.20737.x van Driel, W., & van Woerden, H. 1989, A&A, 225, 317
-
[65]
Vazdekis, A., S´ anchez-Bl´ azquez, P., Falc´ on-Barroso, J., et al. 2010, MNRAS, 404, 1639, doi: 10.1111/j.1365-2966.2010.16407.x
-
[66]
Veilleux, S., & Osterbrock, D. E. 1987, ApJS, 63, 295, doi: 10.1086/191166
-
[67]
Virtanen, P., Gommers, R., Oliphant, T. E., et al. 2020, Nature Methods, 17, 261, doi: 10.1038/s41592-019-0686-2
-
[68]
2008a, A&A, 491, 455, doi: 10.1051/0004-6361:200810432
Vollmer, B., Braine, J., Pappalardo, C., & Hily-Blant, P. 2008a, A&A, 491, 455, doi: 10.1051/0004-6361:200810432
-
[69]
2013, A&A, 553, A116, doi: 10.1051/0004-6361/201321163
Vollmer, B., Soida, M., Beck, R., et al. 2013, A&A, 553, A116, doi: 10.1051/0004-6361/201321163
-
[70]
2008b, A&A, 483, 89, doi: 10.1051/0004-6361:20078139
Vollmer, B., Soida, M., Chung, A., et al. 2008b, A&A, 483, 89, doi: 10.1051/0004-6361:20078139
-
[71]
2021, A&A, 645, A121, doi: 10.1051/0004-6361/202038507
Vollmer, B., Fossati, M., Boselli, A., et al. 2021, A&A, 645, A121, doi: 10.1051/0004-6361/202038507
-
[72]
Waskom, M. L. 2021, Journal of Open Source Software, 6, 3021, doi: 10.21105/joss.03021
-
[73]
Watts, A. B., Cortese, L., Catinella, B., et al. 2024, MNRAS, 530, 1968, doi: 10.1093/mnras/stae898
-
[74]
Weilbacher, P. M., Palsa, R., Streicher, O., et al. 2020, A&A, 641, A28, doi: 10.1051/0004-6361/202037855 Wes McKinney. 2010, in Proceedings of the 9th Python in Science Conference, ed. St´ efan van der Walt & Jarrod Millman, 56 – 61, doi: 10.25080/Majora-92bf1922-00a
-
[75]
and Cappellari, Michele and Bershady, Matthew A
Westfall, K. B., Cappellari, M., Bershady, M. A., et al. 2019, AJ, 158, 231, doi: 10.3847/1538-3881/ab44a2
-
[76]
Yoon, H., Chung, A., Smith, R., & Jaff´ e, Y. L. 2017, ApJ, 838, 81, doi: 10.3847/1538-4357/aa6579
-
[77]
2012, ApJ, 749, 43, doi: 10.1088/0004-637X/749/1/43
Yoshida, M., Yagi, M., Komiyama, Y., et al. 2012, ApJ, 749, 43, doi: 10.1088/0004-637X/749/1/43
-
[78]
Zabel, N., Brown, T., Wilson, C. D., et al. 2022, ApJ, 933, 10, doi: 10.3847/1538-4357/ac6e68
-
[79]
2017, MNRAS, 466, 3217, doi: 10.1093/mnras/stw3308
Zhang, K., Yan, R., Bundy, K., et al. 2017, MNRAS, 466, 3217, doi: 10.1093/mnras/stw3308
discussion (0)
Sign in with ORCID, Apple, or X to comment. Anyone can read and Pith papers without signing in.