Recognition: 3 theorem links
· Lean TheoremA Statistical Survey of Faint Solar X-ray Transients Observed by NuSTAR
Pith reviewed 2026-05-08 18:07 UTC · model grok-4.3
The pith
NuSTAR survey finds no quiet-Sun X-ray transients above 3 x 10^27 erg
A machine-rendered reading of the paper's core claim, the machinery that carries it, and where it could break.
Core claim
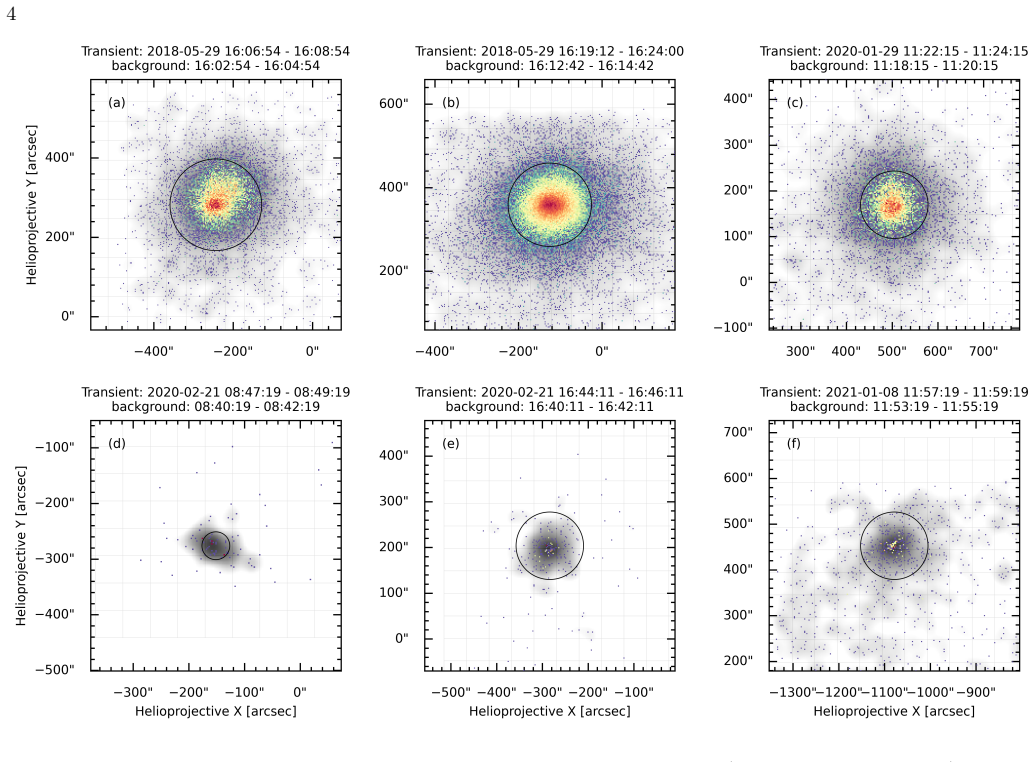
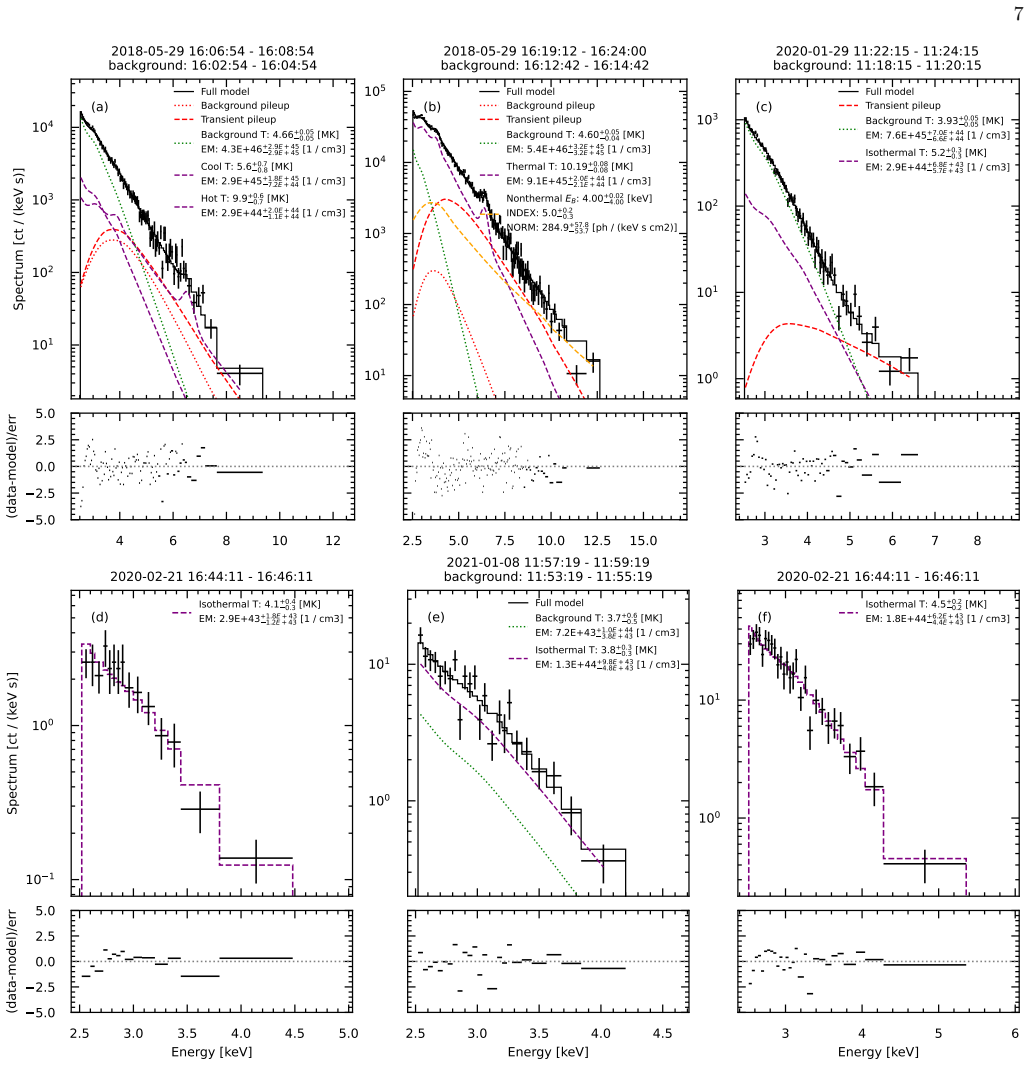
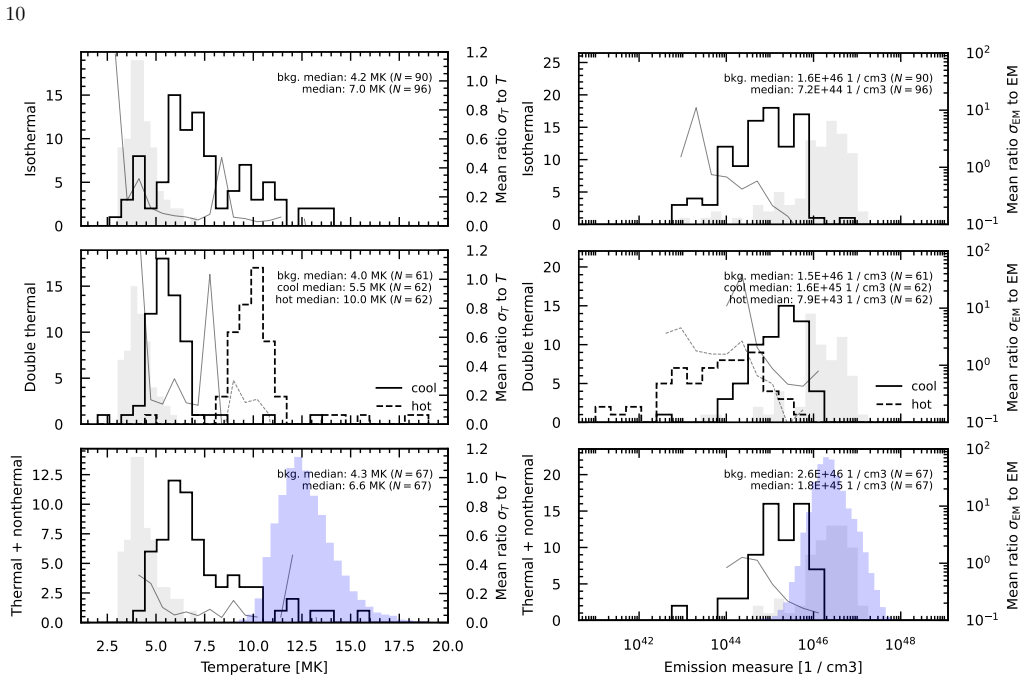
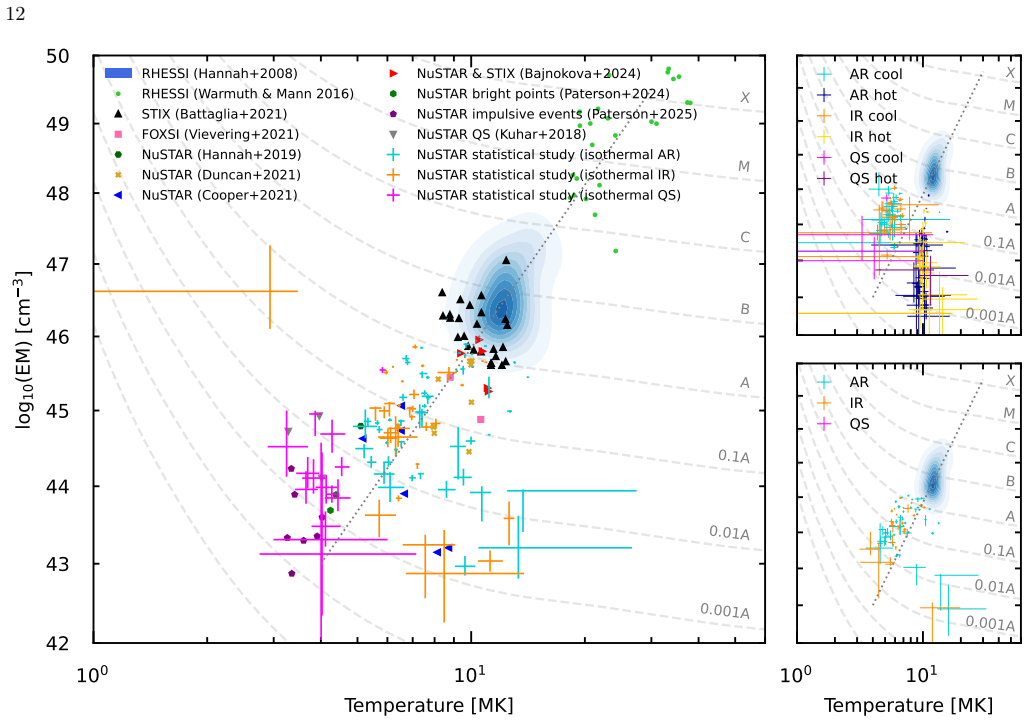
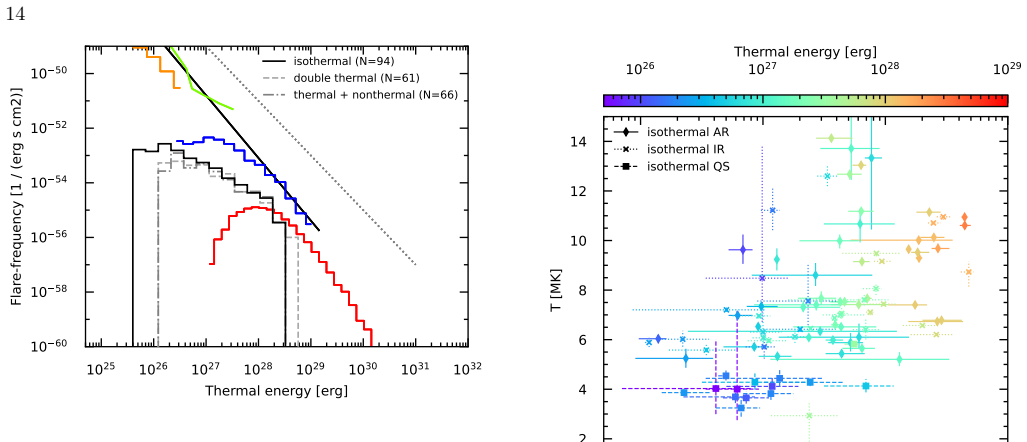
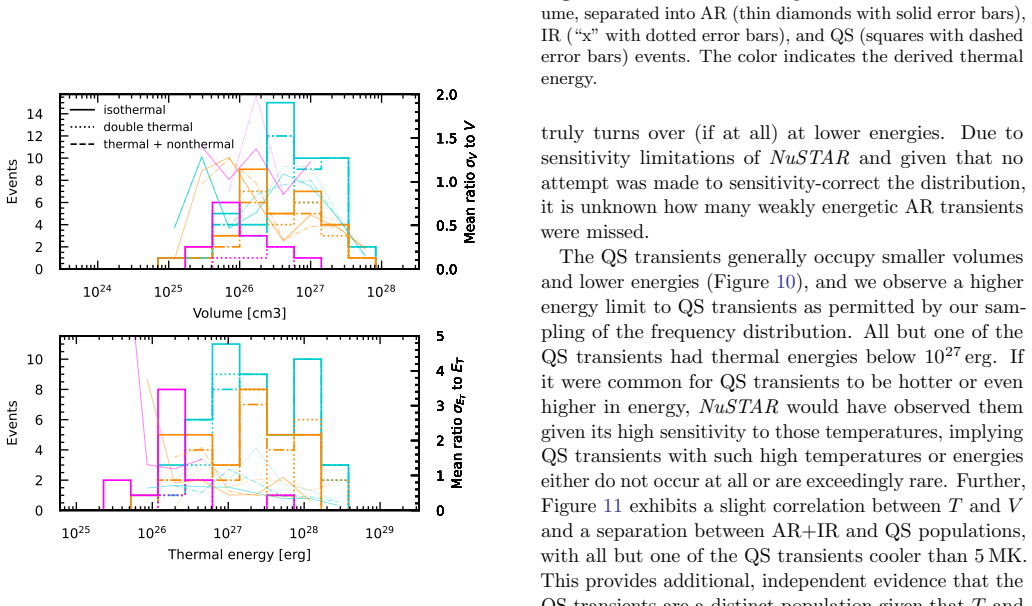
We present the first statistical survey of NuSTAR solar observations, characterizing the thermal and possibly nonthermal properties of 113 weakly energetic transients down to 10^26 erg, making this the first to directly compare events from the quiet Sun to those in active regions. Relative to RHESSI microflares, our NuSTAR transients are generally cooler, dimmer, and have slightly steeper spectra. Thermal energy content of active region transients appears to be independent of the volume of emitting plasma for transients produced by active regions. This is in contrast to those from the quiet corona, which on average have lower energy content, smaller emission volumes, and appear cool but dim,
What carries the argument
Statistical survey of 113 NuSTAR solar X-ray transients with derived thermal energies and volumes, separated into quiet-Sun and active-region groups for direct comparison.
If this is right
- Thermal energy in active-region transients does not depend on the volume of emitting plasma.
- Quiet-Sun transients have lower thermal energies, smaller volumes, and cooler but brighter character than active-region ones.
- NuSTAR transients are cooler, dimmer, and have steeper spectra than RHESSI microflares.
- Quiescent processes release no more than 3 x 10^27 erg into plasma above 3 MK.
Where Pith is reading between the lines
- Coronal heating models for the quiet Sun must accommodate this energy ceiling for plasma above 3 MK.
- More NuSTAR or next-generation hard X-ray observations could test whether still-fainter events exist below the current detection threshold.
- The differing energy-volume trends suggest distinct energy-release physics in quiet versus active solar regions.
Load-bearing premise
The detected X-ray brightenings are solar transients with thermal energies and volumes correctly derived from the spectra without major misclassification, background contamination, or selection biases.
What would settle it
A single confirmed quiet-Sun transient with thermal energy above 3 x 10^27 erg in comparable NuSTAR data would falsify the upper limit.
Figures


read the original abstract
In this paper, we use a highly sensitive telescope to characterize solar X-ray transients ranging from microflares in active regions down to weakly energetic brightenings in the quiet Sun. X-rays are closely linked to the initial energy release and immediate heating of solar flares, making them invaluable in understanding their driving processes. NuSTAR is the first long-term, direct focusing hard X-ray observatory to have observed the Sun, offering a unique opportunity to search for and characterize X-ray events from inside and outside active regions that would be otherwise unobservable. We present the first statistical survey of NuSTAR solar observations, characterizing the thermal and possibly nonthermal properties of 113 weakly energetic transients down to $10^{26}$ erg, making this the first to directly compare events from the quiet Sun to those in active regions. Relative to RHESSI microflares, our NuSTAR transients are generally cooler, dimmer, and have slightly steeper spectra. Thermal energy content of active region transients appears to be independent of the volume of emitting plasma for transients produced by active regions. This is in contrast to those from the quiet corona, which on average have lower energy content, smaller emission volumes, and appear cool but bright rather than hot but dim, suggesting a break in trends from traditional microflares. We found no quiet Sun transients with a thermal energy content above $3^{27}$ erg, implying an upper limit on the amount of energy released in plasma above 3 MK by quiescent processes.
Editorial analysis
A structured set of objections, weighed in public.
Referee Report
Summary. The paper presents the first statistical survey of NuSTAR solar X-ray observations, analyzing 113 faint transients (down to 10^{26} erg) from both active regions and the quiet Sun. It characterizes their thermal and possibly nonthermal properties, compares them to RHESSI microflares (finding NuSTAR events generally cooler, dimmer, and with steeper spectra), notes that active-region transient energies appear independent of emitting volume while quiet-Sun events are cooler, smaller, and bright rather than hot and dim, and concludes that the absence of quiet-Sun events above 3×10^{27} erg implies an upper limit on energy release in plasma above 3 MK by quiescent processes.
Significance. If the detection, classification, and energy estimates prove robust, this work provides the first direct comparison of low-energy X-ray transients across quiet-Sun and active-region environments using NuSTAR's sensitivity, extending the observed range below previous microflare studies and offering constraints on coronal heating mechanisms. The large sample and multi-context analysis are notable strengths for an observational survey.
major comments (1)
- [Abstract] Abstract: The headline implication of an upper limit on energy released above 3 MK by quiescent processes rests on the absence of quiet-Sun transients above 3×10^{27} erg. This requires explicit demonstration that the detection pipeline is complete for such events (including thresholds, background subtraction, and volume estimation) and that derived thermal energies are not systematically underestimated due to unaccounted nonthermal components or differing spectral assumptions. The abstract's own qualifiers ('possibly nonthermal' properties and 'cool but bright' quiet-Sun events) indicate potential selection or modeling biases that differ between samples and must be addressed with quantitative tests before the upper-limit claim can be considered load-bearing.
minor comments (2)
- [Abstract] Abstract: The notation '3^{27} erg' is nonstandard and should be written as 3×10^{27} erg for clarity (similarly confirm consistency with 10^{26} erg).
- The manuscript would benefit from a dedicated table or figure summarizing key parameters (temperature, emission measure, volume, energy) for the 113 events, separated by quiet-Sun vs. active-region subsets, to allow direct assessment of the reported trends.
Simulated Author's Rebuttal
We thank the referee for their constructive review and for highlighting the need to strengthen the support for the upper-limit claim. We have revised the manuscript to include additional quantitative demonstrations of detection completeness, background handling, and energy estimation robustness, while preserving the original scientific conclusions.
read point-by-point responses
-
Referee: [Abstract] Abstract: The headline implication of an upper limit on energy released above 3 MK by quiescent processes rests on the absence of quiet-Sun transients above 3×10^{27} erg. This requires explicit demonstration that the detection pipeline is complete for such events (including thresholds, background subtraction, and volume estimation) and that derived thermal energies are not systematically underestimated due to unaccounted nonthermal components or differing spectral assumptions. The abstract's own qualifiers ('possibly nonthermal' properties and 'cool but bright' quiet-Sun events) indicate potential selection or modeling biases that differ between samples and must be addressed with quantitative tests before the upper-limit claim can be considered load-bearing.
Authors: We agree that the upper-limit statement requires robust supporting evidence and have added a dedicated subsection (now Section 3.4) that quantifies the detection pipeline completeness. This includes: (i) explicit energy-dependent detection thresholds derived from injected-source simulations showing >95% recovery for events above 3×10^{27} erg in quiet-Sun fields; (ii) a description of the background-subtraction procedure and its impact on faint-event recovery; and (iii) volume estimates based on AIA-constrained source sizes with Monte Carlo error propagation. For thermal-energy underestimation, we performed a direct comparison of energies derived from purely thermal versus thermal-plus-nonthermal spectral models on the subset of events with sufficient counts; the median difference is <15% and does not alter the absence of quiet-Sun events above the threshold. The abstract qualifiers reflect the inherent modeling uncertainties but are now cross-referenced to these new tests. We have also revised the abstract wording to read 'providing evidence for an upper limit' rather than a direct implication, pending the added validation. revision: yes
Circularity Check
No circularity: purely observational survey with empirical findings
full rationale
The paper is a data-driven statistical survey of 113 NuSTAR-detected solar X-ray transients. Thermal energies, volumes, temperatures, and classifications are obtained by applying standard spectral fitting and imaging analysis directly to the observed counts, with no model parameters fitted to a subset and then re-used as 'predictions.' The key claim (no quiet-Sun events above 3e27 erg, implying an upper limit) is an empirical statement about the observed sample; it does not reduce to any self-defined quantity, self-citation chain, or ansatz smuggled from prior work. Detection completeness, background subtraction, and possible non-thermal contributions are discussed as observational caveats rather than being defined circularly. No load-bearing step matches any of the enumerated circularity patterns.
Axiom & Free-Parameter Ledger
axioms (2)
- domain assumption NuSTAR solar data can be reduced using established calibration and background models to isolate true solar transients.
- domain assumption X-ray spectra of these faint events are dominated by thermal emission from optically thin plasma.
Lean theorems connected to this paper
-
Cost.FunctionalEquation (J(x)=½(x+x⁻¹)−1)washburn_uniqueness_aczel — no contact: paper uses standard XSPEC thermal/power-law spectral fitting, not ratio-symmetric cost functions unclearEach transient was independently fit to three models: an isothermal (vapec) model, a double isothermal (vapec+vapec) model, and a thermal with nonthermal (vapec+bknpower) model.
Reference graph
Works this paper leans on
-
[1]
Arnaud, K. A. 1996, in Astronomical Society of the Pacific Conference Series, Vol. 101, Astronomical Data Analysis Software and Systems V, ed. G. H. Jacoby & J. Barnes, 17
1996
-
[2]
J., & Parnell, C
Aschwanden, M. J., & Parnell, C. E. 2002, The Astrophysical Journal, 572, 1048
2002
-
[3]
Athiray, P., & Winebarger, A. R. 2024, The Astrophysical Journal, 961, 181 Bajnokov´ a, N., Hannah, I. G., Cooper, K., et al. 2024, Monthly Notices of the Royal Astronomical Society, 533, 3742
2024
-
[4]
C., Bobra, M
Barnes, W., Cheung, M. C., Bobra, M. G., et al. 2020, Journal of Open Source Software (JOSS), 5, 2801
2020
-
[5]
T., Bobra, M
Barnes, W. T., Bobra, M. G., Christe, S. D., et al. 2020, The Astrophysical Journal, 890, 68
2020
-
[6]
F., Saqri, J., Massa, P., et al
Battaglia, A. F., Saqri, J., Massa, P., et al. 2021, Astronomy & Astrophysics, 656, A4
2021
-
[7]
2011, The Astrophysical Journal, 736, 75
Baylor, R., Cassak, P., Christe, S., et al. 2011, The Astrophysical Journal, 736, 75
2011
-
[8]
Benz, A. O. 2016, Living Reviews in Solar Physics, 14, doi: 10.1007/s41116-016-0004-3
-
[9]
1999, Solar Physics, 186, 207
Berghmans, D., & Clette, F. 1999, Solar Physics, 186, 207
1999
-
[10]
Bhalerao, V. B. 2012, PhD thesis, California Institute of Technology, doi: 10.7907/CVT1-VR08
-
[11]
1946, Naturwissenschaften, 33, 118
Biermann, L. 1946, Naturwissenschaften, 33, 118
1946
-
[12]
G., Krucker, S., McTiernan, J., & Lin, R
Christe, S., Hannah, I. G., Krucker, S., McTiernan, J., & Lin, R. P. 2008, Astrophys. J., 677, 1385, doi: 10.1086/529011
-
[13]
G., Glesener, L., & Grefenstette, B
Cooper, K., Hannah, I. G., Glesener, L., & Grefenstette, B. W. 2024, Monthly Notices of the Royal Astronomical Society, stae348
2024
-
[14]
G., Grefenstette, B
Cooper, K., Hannah, I. G., Grefenstette, B. W., et al. 2020, The Astrophysical Journal Letters, 893, L40
2020
-
[15]
Cooper, K., Hannah, I. G., Grefenstette, B. W., et al. 2021, Monthly Notices of the Royal Astronomical Society, 507, 3936, doi: 10.1093/mnras/stab2283 Del Zanna, G. 2013, Astronomy & Astrophysics, 558, A73
-
[16]
Duncan, J., Glesener, L., Grefenstette, B. W., et al. 2021, The Astrophysical Journal, 908, 29, doi: 10.3847/1538-4357/abca3d
-
[17]
B., Shih, A
Duncan, J., Masek, R. B., Shih, A. Y., et al. 2024, The Astrophysical Journal, 966, 197
2024
-
[18]
1992, Physica Scripta, 46, 202
Feldman, U. 1992, Physica Scripta, 46, 202
1992
-
[19]
1986, Astrophysical Journal, Part 1 (ISSN 0004-637X), vol
Gehrels, N. 1986, Astrophysical Journal, Part 1 (ISSN 0004-637X), vol. 303, April 1, 1986, p. 336-346., 303, 336
1986
-
[20]
G., et al
Glesener, L., Krucker, S., Hannah, I. G., et al. 2017, The Astrophysical Journal, 845, 122
2017
-
[21]
2020, The Astrophysical Journal, 891, L34, doi: 10.3847/2041-8213/ab7341
Glesener, L., Krucker, S., Duncan, J., et al. 2020, The Astrophysical Journal, 891, L34, doi: 10.3847/2041-8213/ab7341
-
[22]
W., Glesener, L., Krucker, S., et al
Grefenstette, B. W., Glesener, L., Krucker, S., et al. 2016, The Astrophysical Journal, 826, 20, doi: 10.3847/0004-637x/826/1/20
-
[23]
G., Hudson, H., Battaglia, M., et al
Hannah, I. G., Hudson, H., Battaglia, M., et al. 2011, Space science reviews, 159, 263
2011
-
[24]
G., Kleint, L., Krucker, S., et al
Hannah, I. G., Kleint, L., Krucker, S., et al. 2019, The Astrophysical Journal, 881, 109
2019
-
[25]
Hannah, I. G., et al. 2008, Astrophys. J., 677, 704–718, doi: 10.1086/529012
-
[26]
Hannah, I. G., Grefenstette, B. W., Smith, D. M., et al. 2016, ApJL, 820, L14, doi: 10.3847/2041-8205/820/1/L14
-
[27]
R., Millman, K
Harris, C. R., Millman, K. J., Van Der Walt, S. J., et al. 2020, Nature, 585, 357
2020
-
[28]
Harrison, F. A., Craig, W. W., Christensen, F. E., et al. 2013, The Astrophysical Journal, 770, 103, doi: 10.1088/0004-637x/770/2/103
-
[29]
Hudson, H. S. 1991, Sol Phys, 133, 357, doi: 10.1007/BF00149894
-
[30]
Hunter, J. D. 2007, Computing in science & engineering, 9, 90
2007
-
[31]
2014, The Astrophysical Journal, 789, 116
Inglis, A., & Christe, S. 2014, The Astrophysical Journal, 789, 116
2014
-
[32]
2017, Nature Astronomy, 1, doi: 10.1038/s41550-017-0269-z
Ishikawa, S., et al. 2017, Nature Astronomy, 1, doi: 10.1038/s41550-017-0269-z
-
[33]
R., & McKenzie, D
Kobelski, A. R., & McKenzie, D. E. 2014, The Astrophysical Journal, 794, 119
2014
-
[34]
Kobelski, A. R., et al. 2014, Astrophys. J., 786, 82, doi: 10.1088/0004-637x/786/2/82
-
[35]
Kuhar, M., et al. 2018, Astrophys. J., 856, L32, doi: 10.3847/2041-8213/aab889 Ku´ zma, B., W´ ojcik, D., & Murawski, K. 2019, The Astrophysical Journal, 878, 81
-
[36]
Lemen, J. R., Title, A. M., Akin, D. J., et al. 2012, SoPh, 275, 17, doi: 10.1007/s11207-011-9776-8
-
[37]
P., Dennis, B
Lin, R. P., Dennis, B. R., Hurford, G. J., et al. 2003, The Reuven Ramaty High-Energy Solar Spectroscopic Imager (RHESSI) Mission Description and Early Results, 3
2003
-
[38]
J., Smith, D
Marsh, A. J., Smith, D. M., Glesener, L., et al. 2017, The Astrophysical Journal, 849, 131
2017
-
[39]
J., Smith, D
Marsh, A. J., Smith, D. M., Glesener, L., et al. 2018, The Astrophysical Journal, 864, 5
2018
-
[40]
2020, The Astrophysical Journal Letters, 895, L39
Mondal, S., Oberoi, D., & Mohan, A. 2020, The Astrophysical Journal Letters, 895, L39
2020
-
[41]
Parker, E. N. 1988, ApJ, 330, 474, doi: 10.1086/166485
-
[42]
G., Grefenstette, B
Paterson, S., Hannah, I. G., Grefenstette, B. W., et al. 2023, Solar Physics, 298, 47
2023
-
[43]
G., Grefenstette, B
Paterson, S., Hannah, I. G., Grefenstette, B. W., et al. 2024, Monthly Notices of the Royal Astronomical Society, 528, 6398 34
2024
-
[44]
2023, Frontiers in Astronomy and Space Sciences, 10, 1214901
Polito, V., Peterson, M., Glesener, L., et al. 2023, Frontiers in Astronomy and Space Sciences, 10, 1214901
2023
-
[45]
Pontieu, B. D., McIntosh, S. W., Carlsson, M., et al. 2007, Science, 318, 1574, doi: 10.1126/science.1151747
-
[46]
M., Lim, P
Price-Whelan, A. M., Lim, P. L., Earl, N., et al. 2022, The Astrophysical Journal, 935, 167
2022
-
[47]
Purkhart, S., & Veronig, A. M. 2022, Astronomy & Astrophysics, 661, A149, doi: 10.1051/0004-6361/202243234 Van Doorsselaere, T., Srivastava, A. K., Antolin, P., et al. 2020, Space Science Reviews, 216, 1
-
[48]
E., et al
Virtanen, P., Gommers, R., Oliphant, T. E., et al. 2020, Nature methods, 17, 261
2020
-
[49]
2020, Astronomy & Astrophysics, 644, A172
Warmuth, A., & Mann, G. 2020, Astronomy & Astrophysics, 644, A172
2020
-
[50]
R., Warren, H
Winebarger, A. R., Warren, H. P., Schmelz, J. T., et al. 2012, The Astrophysical Journal Letters, 746, L17
2012
-
[51]
Wright, P. J., Hannah, I. G., Grefenstette, B. W., et al. 2017, The Astrophysical Journal, 844, 132, doi: 10.3847/1538-4357/aa7a59
discussion (0)
Sign in with ORCID, Apple, or X to comment. Anyone can read and Pith papers without signing in.