Recognition: unknown
Graph Convolutional Support Vector Regression for Robust Spatiotemporal Forecasting of Urban Air Pollution
Pith reviewed 2026-05-07 16:24 UTC · model grok-4.3
The pith
A hybrid model using graphs to link pollution stations and support vector regression for time trends delivers more accurate and stable forecasts for urban air quality than existing methods.
A machine-rendered reading of the paper's core claim, the machinery that carries it, and where it could break.
Core claim
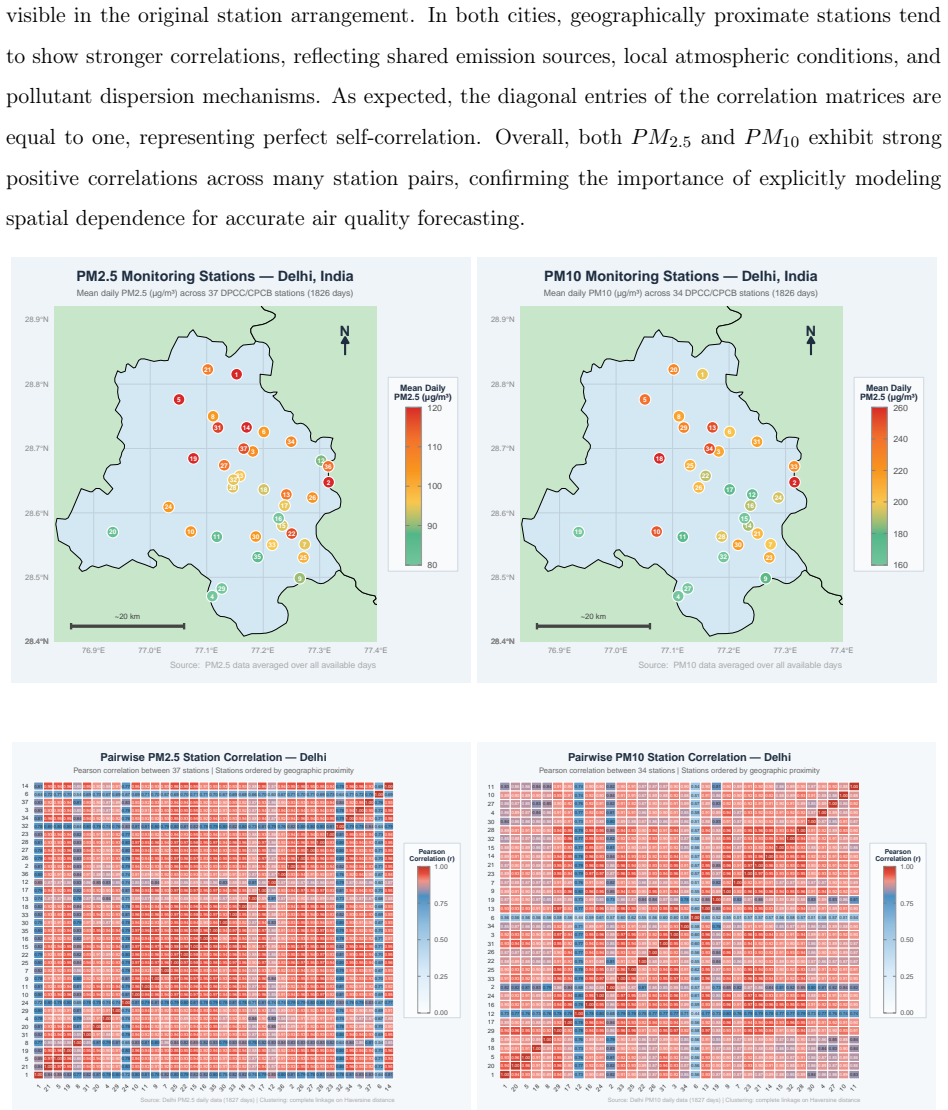
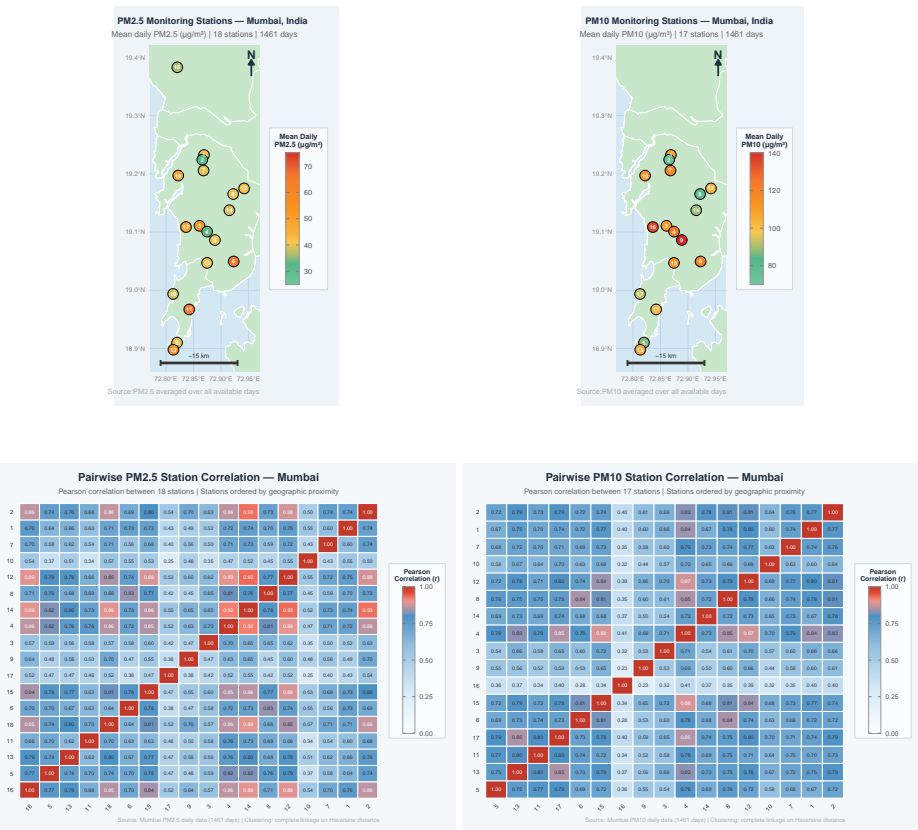
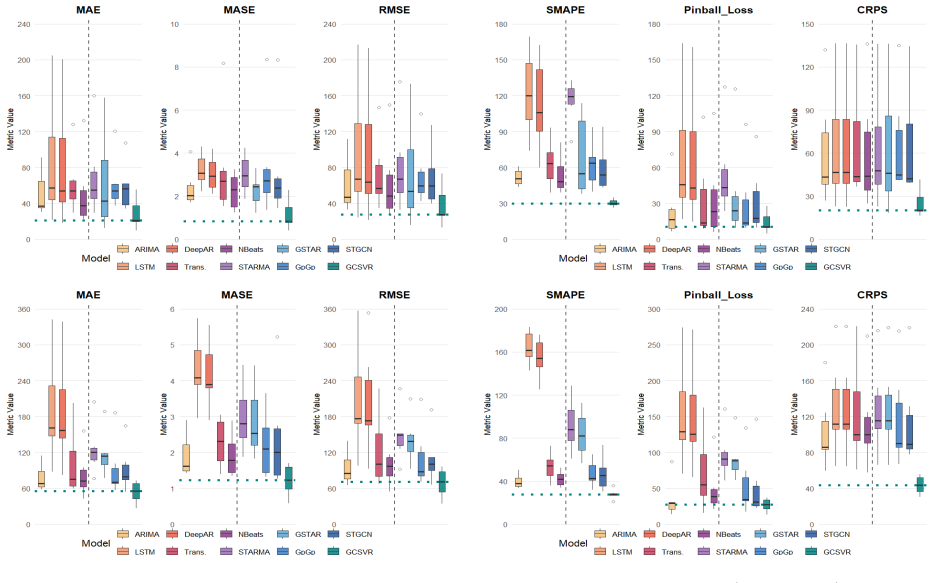
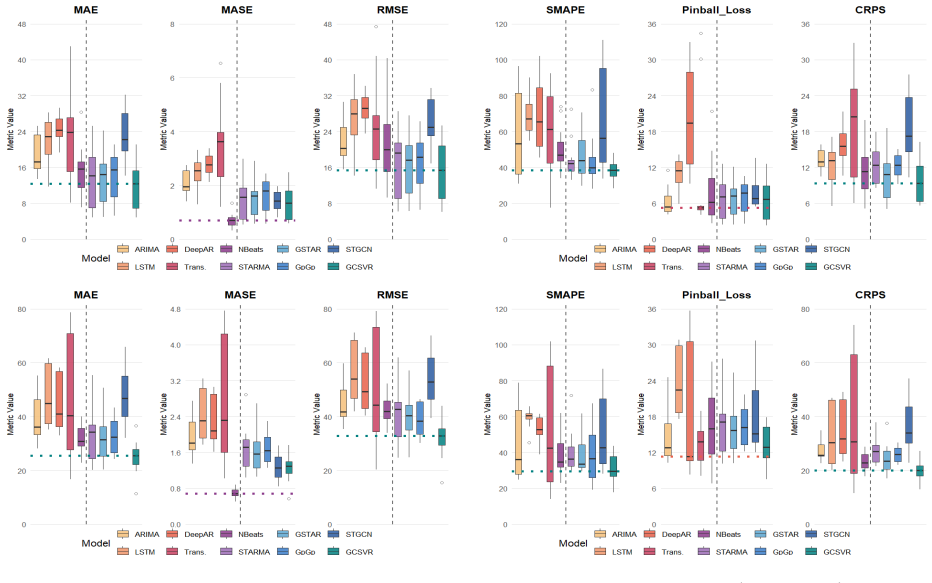
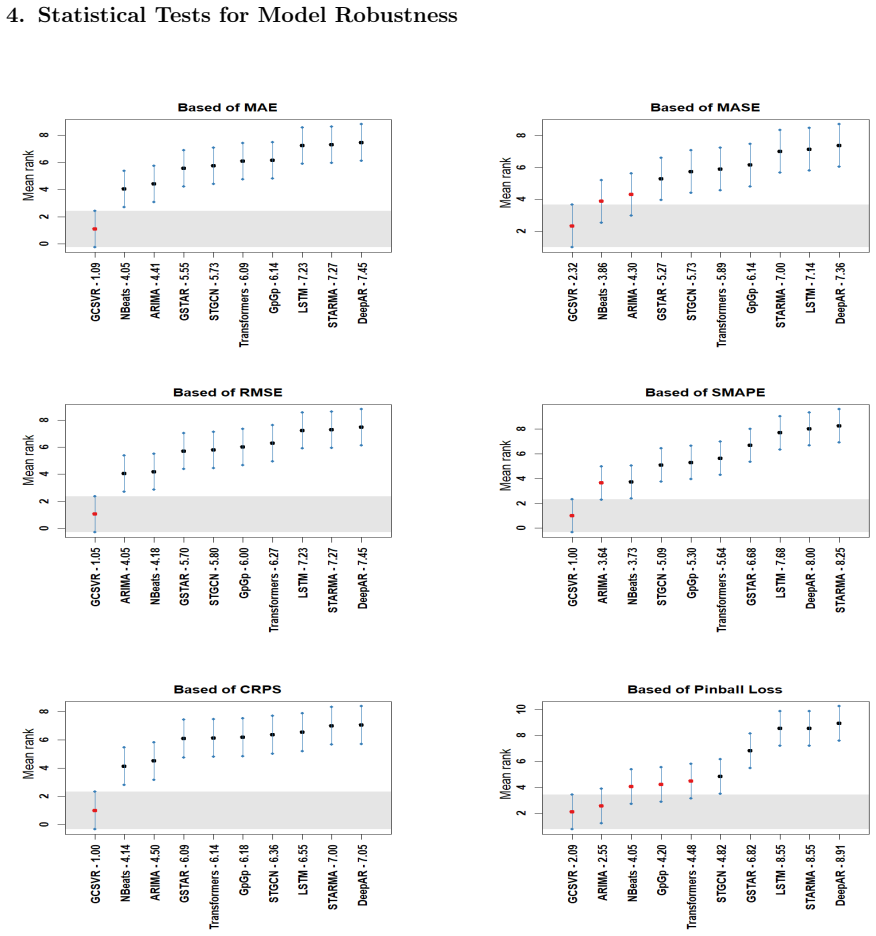
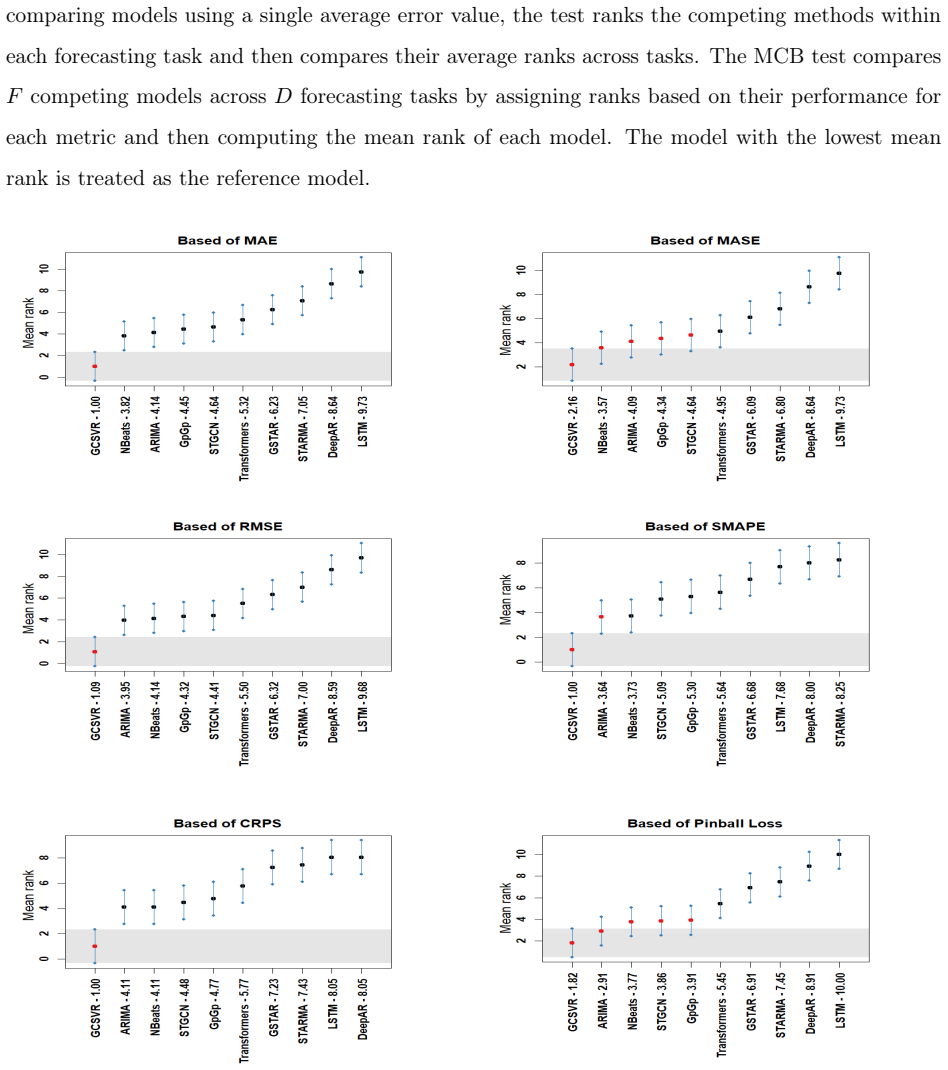
The GCSVR framework captures inter-station spatial dependence via graph convolutional learning and nonlinear temporal dynamics via support vector regression, reducing sensitivity to outliers, and demonstrates consistent improvements in forecasting performance on air quality data from 37 stations in Delhi and 18 in Mumbai across multiple horizons and conditions.
What carries the argument
Graph Convolutional Support Vector Regression (GCSVR) that integrates graph convolutions for spatial dependencies between stations with support vector regression for robust temporal modeling.
Load-bearing premise
The chosen graph structure based on station locations or correlations correctly captures the true spatial dependencies between pollutant concentrations at different sites.
What would settle it
Demonstrating no improvement in accuracy or stability when applying GCSVR to a dataset from a different urban area with mismatched spatial station arrangements would challenge the central claim.
Figures


read the original abstract
Urban air quality forecasting is challenging because pollutant concentrations are nonlinear, nonstationary, spatiotemporally dependent, and often affected by anomalous observations caused by traffic congestion, industrial emissions, and seasonal meteorological variability. This study proposes a Graph Convolutional Support Vector Regression (GCSVR) framework for robust spatiotemporal forecasting of urban air pollution. The model combines graph convolutional learning to capture inter-station spatial dependence with support vector regression to model nonlinear temporal dynamics while reducing sensitivity to outlier observations. The proposed framework is evaluated using air quality records from 37 monitoring stations in Delhi and 18 stations in Mumbai, representing inland and coastal metropolitan environments in India. Forecasting performance is assessed across multiple horizons and compared with established temporal and spatiotemporal benchmarks. The results show that GCSVR consistently improves predictive accuracy and maintains stable performance across seasons and outlier-prone pollution episodes. Statistical test further confirms the reliability of the proposed approach across the two cities. Finally, conformal prediction is integrated with GCSVR to generate calibrated prediction intervals, enhancing its practical value for uncertainty-aware air quality monitoring and public health decision-making.
Editorial analysis
A structured set of objections, weighed in public.
Referee Report
Summary. The paper proposes a Graph Convolutional Support Vector Regression (GCSVR) framework that combines graph convolutional layers to capture spatial dependencies across air quality monitoring stations with support vector regression to model nonlinear temporal dynamics while providing robustness to outliers. It evaluates the approach on real-world datasets from 37 stations in Delhi and 18 stations in Mumbai, reporting consistent improvements in predictive accuracy over temporal and spatiotemporal baselines across multiple forecasting horizons, stability across seasons and pollution episodes, confirmation via statistical tests, and integration with conformal prediction for calibrated uncertainty intervals.
Significance. If the performance gains and attribution to the spatiotemporal components hold after full methodological disclosure, the work offers a practical hybrid model for robust urban air pollution forecasting that addresses nonlinearity, nonstationarity, and anomalies common in environmental time series. The addition of conformal prediction enhances deployability for public health applications. The use of two distinct metropolitan datasets (inland vs. coastal) and statistical validation are positive elements, but the absence of architecture details, training procedures, exact baselines, error bars, and graph validation checks currently limits assessment of whether the claimed improvements exceed what SVR alone could achieve.
major comments (3)
- [Methods] Methods section (graph construction and GCN component): The adjacency matrix or Laplacian construction (whether distance-based, correlation-based, or thresholded) is not described with sufficient specificity, and no ablation studies, random-graph controls, or sensitivity analyses to alternative graphs are reported. This is load-bearing for the central claim, as the headline improvements in accuracy and stability are attributed to the GCN capturing inter-station spatial dependence; without evidence that the fixed graph encodes actual pollutant transport rather than spurious correlations, gains could derive solely from the SVR's outlier robustness (consistent with the stress-test concern on graph misspecification).
- [Results] Results and evaluation sections: Performance claims (consistent improvement, stability across seasons/outliers, statistical confirmation) are stated without reporting exact baseline implementations, hyperparameter tuning details, training/validation splits, error bars, or preprocessing steps for the Delhi and Mumbai datasets. This prevents independent verification of the abstract's assertion that 'GCSVR consistently improves predictive accuracy' and undermines the reliability of the cross-city and cross-horizon comparisons.
- [Results] Table or figure presenting comparative metrics (e.g., any RMSE/MAE tables across horizons): Without these details or controls for graph quality, the statistical tests confirming reliability cannot be evaluated for whether they isolate the contribution of the graph convolutional component versus the SVR kernel and regularization.
minor comments (2)
- [Abstract] The abstract mentions 'established temporal and spatiotemporal benchmarks' but does not name them explicitly (e.g., ARIMA, LSTM, ST-GCN variants); adding this list in the introduction or methods would improve clarity.
- [Methods] Notation for the graph convolutional operation and SVR formulation should be introduced with explicit equations early in the methods to aid reproducibility.
Simulated Author's Rebuttal
We thank the referee for the constructive and detailed review, which highlights important areas for improving clarity and reproducibility. We will make the requested revisions to address all major comments.
read point-by-point responses
-
Referee: [Methods] Methods section (graph construction and GCN component): The adjacency matrix or Laplacian construction (whether distance-based, correlation-based, or thresholded) is not described with sufficient specificity, and no ablation studies, random-graph controls, or sensitivity analyses to alternative graphs are reported. This is load-bearing for the central claim, as the headline improvements in accuracy and stability are attributed to the GCN capturing inter-station spatial dependence; without evidence that the fixed graph encodes actual pollutant transport rather than spurious correlations, gains could derive solely from the SVR's outlier robustness (consistent with the stress-test concern on graph misspecification).
Authors: We agree that the Methods section requires greater specificity on graph construction and supporting analyses to substantiate the contribution of the GCN. In the revised manuscript, we will fully specify the adjacency matrix and Laplacian construction procedure. We will also add ablation studies incorporating random-graph controls and sensitivity analyses to alternative constructions (such as correlation-based graphs) to better isolate the role of the spatial dependencies. revision: yes
-
Referee: [Results] Results and evaluation sections: Performance claims (consistent improvement, stability across seasons/outliers, statistical confirmation) are stated without reporting exact baseline implementations, hyperparameter tuning details, training/validation splits, error bars, or preprocessing steps for the Delhi and Mumbai datasets. This prevents independent verification of the abstract's assertion that 'GCSVR consistently improves predictive accuracy' and undermines the reliability of the cross-city and cross-horizon comparisons.
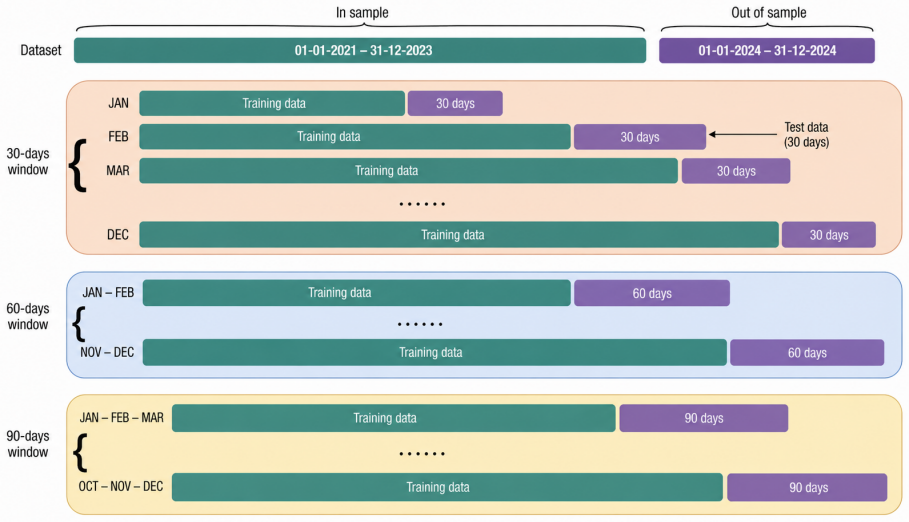
Authors: We acknowledge that additional experimental details are necessary for independent verification. The revised Results and evaluation sections will report the exact baseline implementations, hyperparameter tuning procedures and ranges, training/validation/test splits (with temporal safeguards), error bars from repeated runs, and all preprocessing steps for both the Delhi and Mumbai datasets. revision: yes
-
Referee: [Results] Table or figure presenting comparative metrics (e.g., any RMSE/MAE tables across horizons): Without these details or controls for graph quality, the statistical tests confirming reliability cannot be evaluated for whether they isolate the contribution of the graph convolutional component versus the SVR kernel and regularization.
Authors: We agree that expanded tables and controls are needed to strengthen evaluation of the statistical tests. The revision will include comprehensive tables of RMSE, MAE, and related metrics across all horizons and cities, with error bars. The ablation studies noted above will provide controls for graph quality, and we will describe the statistical tests in greater detail to clarify their evaluation of the GCN component relative to the SVR. revision: yes
Circularity Check
No significant circularity in derivation chain
full rationale
The abstract describes GCSVR as a hybrid of standard graph convolutional learning for spatial dependencies and SVR for nonlinear temporal modeling with outlier robustness, evaluated empirically on independent air quality datasets from 37 Delhi stations and 18 Mumbai stations against temporal and spatiotemporal benchmarks. No equations, derivations, or self-referential steps are presented that reduce claimed predictive improvements to fitted parameters or inputs by construction. The central claims rest on external validation and statistical tests rather than internal redefinitions or self-citation chains. This matches the default expectation of self-contained empirical work with no load-bearing circular reductions.
Axiom & Free-Parameter Ledger
free parameters (2)
- SVR regularization and kernel parameters
- Graph adjacency or Laplacian construction
Reference graph
Works this paper leans on
-
[1]
Stochastic Environmental Research and Risk Assessment , volume=
An integrated fuzzy-stochastic modeling approach for assessing health-impact risk from air pollution , author=. Stochastic Environmental Research and Risk Assessment , volume=. 2008 , publisher=
2008
-
[2]
Stochastic Environmental Research and Risk Assessment , volume=
A stochastic epidemic model coupled with seasonal air pollution: analysis and data fitting , author=. Stochastic Environmental Research and Risk Assessment , volume=. 2020 , publisher=
2020
-
[3]
The Lancet Planetary Health , volume=
The impact of air pollution on deaths, disease burden, and life expectancy across the states of India: the Global Burden of Disease Study 2017 , author=. The Lancet Planetary Health , volume=. 2019 , publisher=
2017
-
[4]
Environmental Pollution , volume=
Association between ambient fine particulate matter and preterm birth or term low birth weight: an updated systematic review and meta-analysis , author=. Environmental Pollution , volume=. 2017 , publisher=
2017
-
[5]
Environmental monitoring and assessment , volume=
Role of meteorology in seasonality of air pollution in megacity Delhi, India , author=. Environmental monitoring and assessment , volume=. 2012 , publisher=
2012
-
[6]
Public health , volume=
Monetary burden of health impacts of air pollution in Mumbai, India: implications for public health policy , author=. Public health , volume=. 2011 , publisher=
2011
-
[7]
arXiv preprint arXiv:2603.07108 , year=
Deep Generative Spatiotemporal Engression for Probabilistic Forecasting of Epidemics , author=. arXiv preprint arXiv:2603.07108 , year=
-
[8]
Journal of the Royal Statistical Society Series A: Statistics in Society , pages=
E-STGCN: extreme spatio-temporal graph convolutional networks for air quality forecasting , author=. Journal of the Royal Statistical Society Series A: Statistics in Society , pages=. 2026 , publisher=
2026
-
[9]
Semi-Supervised Classification with Graph Convolutional Networks
Semi-supervised classification with graph convolutional networks , author=. arXiv preprint arXiv:1609.02907 , year=
work page internal anchor Pith review arXiv
-
[10]
Proceedings of the 34th International Conference on Machine Learning , pages =
Neural Message Passing for Quantum Chemistry , author =. Proceedings of the 34th International Conference on Machine Learning , pages =. 2017 , editor =
2017
-
[11]
Spatio-temporal graph convolutional networks: A deep learning framework for traffic forecasting , author=. arXiv preprint arXiv:1709.04875 , year=
-
[12]
Advances in neural information processing systems , volume=
Support vector method for function approximation, regression estimation and signal processing , author=. Advances in neural information processing systems , volume=
-
[13]
Statistics and computing , volume=
A tutorial on support vector regression , author=. Statistics and computing , volume=. 2004 , publisher=
2004
-
[14]
2018 , edition =
Forecasting: Principles and Practice , author =. 2018 , edition =
2018
-
[15]
Journal of the American Statistical Association , volume =
Strictly Proper Scoring Rules, Prediction, and Estimation , author =. Journal of the American Statistical Association , volume =
-
[16]
and Lerch, Sebastian and Phipps, Kira and others , title =
Gneiting, Tilmann and Wolffram, David and Resin, Jakob and Kraus, Konrad and Bracher, Johannes and Dimitriadis, Timo and Hagenmeyer, Veit and Jordan, Alexander I. and Lerch, Sebastian and Phipps, Kira and others , title =. Annual Review of Statistics and Its Application , volume =
-
[17]
International journal of forecasting , volume=
The M3 competition: Statistical tests of the results , author=. International journal of forecasting , volume=. 2005 , publisher=
2005
-
[18]
Journal of Business & economic statistics , volume=
Comparing predictive accuracy , author=. Journal of Business & economic statistics , volume=. 2002 , publisher=
2002
-
[19]
Algorithmic Learning in a Random World
Vladimir Vovk and Alex Gammerman and Glenn Shafer. Algorithmic Learning in a Random World. 2005
2005
-
[20]
JACC: Advances , volume=
Environmental pollution and cardiovascular disease: part 1 of 2: air pollution , author=. JACC: Advances , volume=. 2024 , publisher=
2024
-
[21]
2024 , url =
World Heart Report 2024 , institution =. 2024 , url =
2024
-
[22]
2024 , url =
World Air Quality Report 2023 , institution =. 2024 , url =
2023
-
[23]
Urban Climate , volume=
Development of emission inventory for air quality assessment and mitigation strategies over most populous Indian megacity, Mumbai , author=. Urban Climate , volume=. 2024 , publisher=
2024
-
[24]
Neurocomputing , volume=
Support vector machines experts for time series forecasting , author=. Neurocomputing , volume=. 2003 , publisher=
2003
-
[25]
Omega , volume=
A hybrid ARIMA and support vector machines model in stock price forecasting , author=. Omega , volume=. 2005 , publisher=
2005
-
[26]
IEEE transactions on neural networks , volume=
An overview of statistical learning theory , author=. IEEE transactions on neural networks , volume=. 1999 , publisher=
1999
-
[27]
2002 , publisher=
Learning with kernels: support vector machines, regularization, optimization, and beyond , author=. 2002 , publisher=
2002
-
[28]
2015 , publisher=
Time series analysis: forecasting and control , author=. 2015 , publisher=
2015
-
[29]
Machine Learning , volume=
Epidemic-guided deep learning for spatiotemporal forecasting of tuberculosis outbreak , author=. Machine Learning , volume=. 2025 , publisher=
2025
-
[30]
IEEE Access , volume=
Spatiotemporal forecasting of traffic flow using wavelet-based temporal attention , author=. IEEE Access , volume=. 2024 , publisher=
2024
-
[31]
Scientific Reports , volume=
Advanced air quality prediction using multimodal data and dynamic modeling techniques , author=. Scientific Reports , volume=. 2025 , publisher=
2025
-
[32]
Engineering Applications of Artificial Intelligence , volume=
Air quality index prediction based on spatio-temporal graph neural networks: An empirical study of Xi’an, China , author=. Engineering Applications of Artificial Intelligence , volume=. 2026 , publisher=
2026
-
[33]
Artificial Intelligence Review , year=
Harnessing deep learning for air pollution forecasting: trends, techniques, and future prospects , author=. Artificial Intelligence Review , year=
-
[34]
Air Quality, Atmosphere & Health , volume=
A hybrid model based on convolutional neural networks and long short-term memory for ozone concentration prediction , author=. Air Quality, Atmosphere & Health , volume=. 2018 , publisher=
2018
-
[35]
5 prediction considering the spatiotemporal correlations: A case study of Beijing, China , author=
Deep learning-based PM2. 5 prediction considering the spatiotemporal correlations: A case study of Beijing, China , author=. Science of the Total Environment , volume=. 2020 , publisher=
2020
-
[36]
Technometrics , volume=
A three-stage iterative procedure for space-time modeling phillip , author=. Technometrics , volume=. 1980 , publisher=
1980
-
[37]
Journal of the Royal Statistical Society: Series B (Methodological) , volume=
Model building and the analysis of spatial pattern in human geography , author=. Journal of the Royal Statistical Society: Series B (Methodological) , volume=. 1975 , publisher=
1975
-
[38]
Applied Sciences , volume=
Machine learning approaches for outdoor air quality modelling: A systematic review , author=. Applied Sciences , volume=. 2018 , publisher=
2018
-
[39]
Advances in neural information processing systems , volume=
Support vector regression machines , author=. Advances in neural information processing systems , volume=
-
[40]
Machine Learning , volume =
Breiman, Leo , title =. Machine Learning , volume =. 2001 , publisher =
2001
-
[41]
5 concentrations in Italy, 2013--2015, using a spatiotemporal land-use random-forest model , author=
Estimation of daily PM10 and PM2. 5 concentrations in Italy, 2013--2015, using a spatiotemporal land-use random-forest model , author=. Environment international , volume=. 2019 , publisher=
2013
-
[42]
, author=
Geoman: Multi-level attention networks for geo-sensory time series prediction. , author=. Ijcai , volume=
-
[43]
Neural computation , volume=
Long short-term memory , author=. Neural computation , volume=. 1997 , publisher=
1997
-
[44]
International journal of forecasting , volume=
DeepAR: Probabilistic forecasting with autoregressive recurrent networks , author=. International journal of forecasting , volume=. 2020 , publisher=
2020
-
[45]
arXiv preprint arXiv:2001.08317 , year=
Deep transformer models for time series forecasting: The influenza prevalence case , author=. arXiv preprint arXiv:2001.08317 , year=
-
[46]
N., Carpov, D., Chapados, N., and Bengio, Y
N-BEATS: Neural basis expansion analysis for interpretable time series forecasting , author=. arXiv preprint arXiv:1905.10437 , year=
-
[47]
Technometrics , volume=
Permutation and grouping methods for sharpening Gaussian process approximations , author=. Technometrics , volume=. 2018 , publisher=
2018
-
[48]
Proceedings of the Twenty-Seventh International Joint Conference on Artificial Intelligence (IJCAI-18) , pages =
Yu, Bing and Yin, Haoteng and Zhu, Zhanxing , title =. Proceedings of the Twenty-Seventh International Joint Conference on Artificial Intelligence (IJCAI-18) , pages =
-
[49]
Theoretical and Applied Climatology , volume=
A hybrid spatio-temporal modelling: an application to space-time rainfall forecasting , author=. Theoretical and Applied Climatology , volume=. 2020 , publisher=
2020
-
[50]
Spatial Statistics , volume=
Spatio-temporal deepkriging for interpolation and probabilistic forecasting , author=. Spatial Statistics , volume=. 2023 , publisher=
2023
-
[51]
5) forecasting in smart cities , author=
A deep CNN-LSTM model for particulate matter (PM2. 5) forecasting in smart cities , author=. Sensors , volume=. 2018 , publisher=
2018
-
[52]
5 based on graph convolutional neural network and long short-term memory , author=
A hybrid model for spatiotemporal forecasting of PM2. 5 based on graph convolutional neural network and long short-term memory , author=. Science of the Total Environment , volume=. 2019 , publisher=
2019
discussion (0)
Sign in with ORCID, Apple, or X to comment. Anyone can read and Pith papers without signing in.