Recognition: 3 theorem links
· Lean TheoremModularity Emerges from Action-Functional Constraints in Marine Metabolic Networks: A Biology-Scale Validation of the Network-Weighted Action Principle
Pith reviewed 2026-05-08 18:36 UTC · model grok-4.3
The pith
Marine metabolic networks display modularity excess beyond what sparsity alone predicts, aligning with cost-minimization principles.
A machine-rendered reading of the paper's core claim, the machinery that carries it, and where it could break.
Core claim
The analysis shows that modularity in the marine metabolic networks exceeds the levels found in configuration-model, label-permutation, and bipartite-incidence null models by amounts ranging from 0.15 to 0.40, with statistical significance. The partitions into modules include a substantial fraction that recur across different samples, and the most stable ones align with established functional units such as enzyme subunits, biosynthetic sequences, and transporter complexes. These findings indicate that modularity excess, rather than absolute modularity, serves as the proper indicator of biological organization shaped by cost-minimization principles.
What carries the argument
The excess modularity over null-model expectations, which removes non-biological effects of sparsity and shared-component usage while retaining any signal from functional constraints.
If this is right
- Modularity excess identifies the biological signal in network organization beyond structural biases.
- About 25% of detected modules recur across samples and correspond to known functional biological units.
- The pattern holds at the scale of entire marine microbiome networks reconstructed from metagenomes.
- Cost-minimization principles appear to influence network architecture in natural systems.
Where Pith is reading between the lines
- The same excess could be checked in metabolic networks from other habitats to assess how general the pattern is.
- Network reconstruction methods might be evaluated by verifying they produce comparable modularity excess.
- The results suggest testing whether other complex biological systems exhibit similar signatures of constraint-driven modularity when appropriate nulls are applied.
Load-bearing premise
The three null models remove all biological information while keeping the network's sparsity and component-sharing patterns intact.
What would settle it
Repeating the analysis on the same networks but with a null model that additionally controls for pathway-level structure and observing whether the excess modularity of 0.15-0.40 disappears, or finding that the recurring modules fail to correspond to known functional units.
Figures


read the original abstract
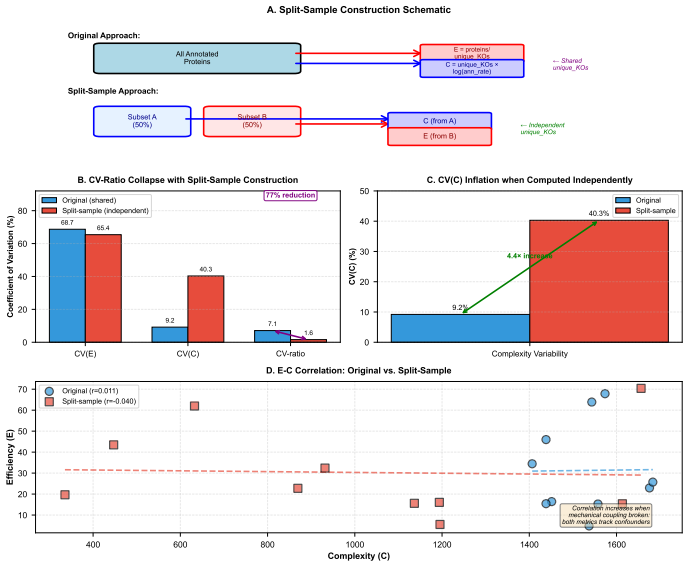
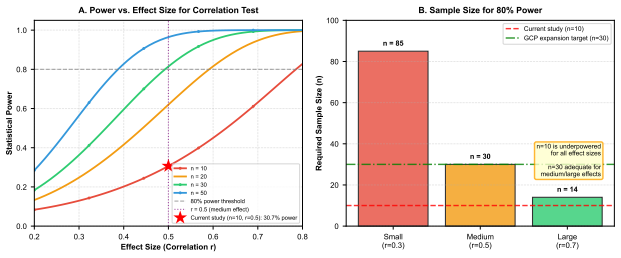
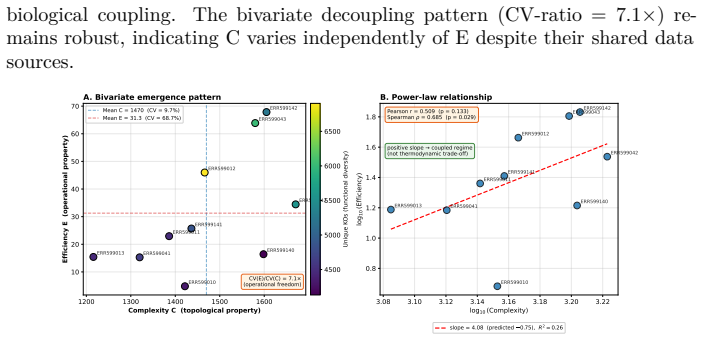
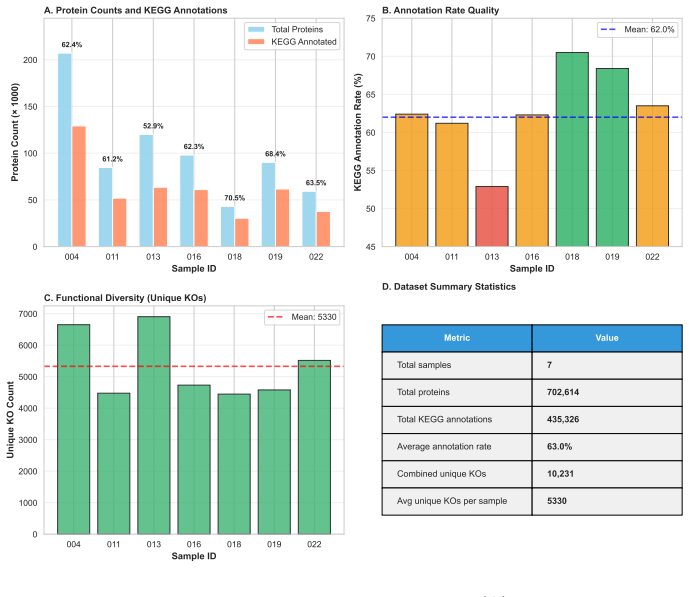
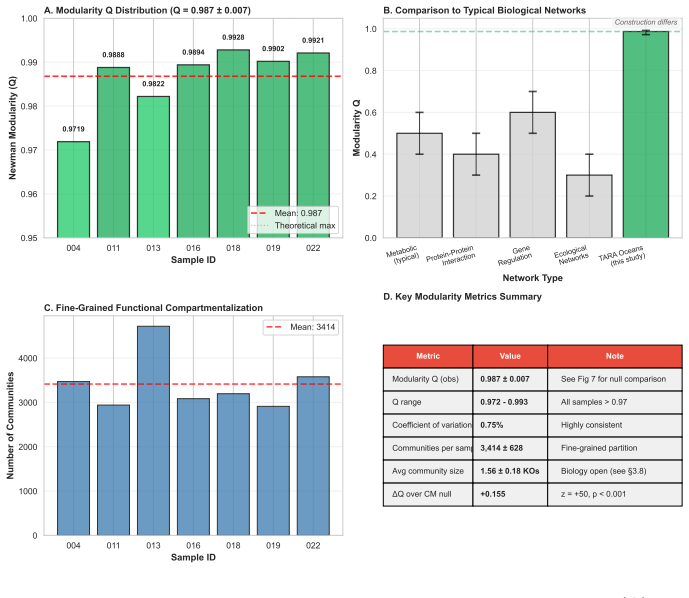
Biological systems operate under simultaneous energetic and informational constraints, yet direct evidence that such constraints shape real metabolic networks is limited. The Network-Weighted Action Principle predicts that networks under these constraints should organize toward high modularity. We tested this prediction in marine microbiome metabolic networks reconstructed from Tara Oceans metagenomes using two complementary approaches. Composite metrics of protein-deployment efficiency and functional-repertoire complexity (n=10) failed under causal-inference diagnostics, with apparent structure dominated by shared-component bias. In contrast, network modularity (n=7) was high (Q ~ 0.987), but this value was shown to arise from sparsity alone. The biologically meaningful signal is the excess over null models: modularity exceeded configuration-model, label-permutation, and bipartite-incidence nulls by Delta Q ~ 0.15-0.40 (p < 0.001), with the largest effect under the bipartite-incidence control. Fine-grained communities recovered by the network partition are not arbitrary: 25% recur across samples, and the most consistent modules map to known functional units, including enzyme subunits, biosynthetic sequences, and transporter complexes. Together, these results show that modularity excess - rather than absolute modularity - is the appropriate signature of biological organization, and that such excess is consistent with cost-minimization principles operating at the scale of natural metabolic networks.
Editorial analysis
A structured set of objections, weighed in public.
Referee Report
Summary. The paper claims that marine metabolic networks reconstructed from Tara Oceans metagenomes show high absolute modularity (Q ~ 0.987) attributable to sparsity alone, while other composite metrics of efficiency and complexity are dominated by shared-component bias. The biologically relevant signal is instead the statistically significant excess modularity (ΔQ ~ 0.15-0.40, p < 0.001) over configuration-model, label-permutation, and bipartite-incidence null models, with 25% of recovered modules recurring across samples and mapping to known functional units such as enzyme subunits and transporter complexes. This excess is interpreted as consistent with the Network-Weighted Action Principle under energetic and informational constraints.
Significance. If the excess modularity can be shown to survive controls for metagenomic reconstruction artifacts, the work supplies a large-scale empirical test of a cost-minimization principle in real microbiome networks and usefully distinguishes absolute from excess modularity as the relevant signature of biological organization.
major comments (3)
- Abstract and methods: The claim that ΔQ reflects biological cost-minimization rather than pipeline artifacts rests on the null models (especially bipartite-incidence) fully isolating reconstruction biases such as co-occurrence induced by sequencing depth, binning, or annotation thresholds in Tara Oceans data. No explicit test of whether these nulls preserve or remove such correlations is described, leaving the isolation of biological signal unverified.
- Results: Composite metrics were discarded after bias diagnostics, yet modularity is retained without a parallel diagnostic showing that its excess is insensitive to the same shared-component bias; this selective retention requires explicit justification to support the central interpretation.
- Results: The statement that 25% of modules recur across samples is presented as evidence of non-arbitrary structure, but lacks a quantitative definition of recurrence, a statistical test against null expectations, or a comparison to the rate expected under the same null models used for ΔQ.
minor comments (2)
- Abstract: The ΔQ range 0.15-0.40 should be disaggregated by null model to allow readers to assess which control produces the largest effect.
- Notation: Ensure consistent use of Q versus ΔQ throughout and define the exact modularity formula employed (e.g., Louvain or other partition method) with reference to the implementation.
Simulated Author's Rebuttal
We thank the referee for their constructive comments, which identify areas where our presentation of the distinction between absolute and excess modularity, as well as supporting statistical controls, can be clarified and strengthened. We respond point by point to the major comments and outline the revisions we will implement.
read point-by-point responses
-
Referee: Abstract and methods: The claim that ΔQ reflects biological cost-minimization rather than pipeline artifacts rests on the null models (especially bipartite-incidence) fully isolating reconstruction biases such as co-occurrence induced by sequencing depth, binning, or annotation thresholds in Tara Oceans data. No explicit test of whether these nulls preserve or remove such correlations is described, leaving the isolation of biological signal unverified.
Authors: We agree that an explicit verification would strengthen the isolation of the biological signal. The bipartite-incidence null model preserves the row and column marginals of the incidence matrix, which directly controls for co-occurrence patterns driven by sequencing depth, binning completeness, and annotation thresholds. To address the referee's concern, we will add a supplementary simulation study in the revised manuscript: synthetic incidence matrices will be generated with controlled artifact correlations (varying coverage and threshold parameters), and we will demonstrate that the null models yield ΔQ near zero under pure artifact conditions while the empirical data retain significant excess only when functional structure is present. This test will be described in the Methods and Supplementary Information. revision: yes
-
Referee: Results: Composite metrics were discarded after bias diagnostics, yet modularity is retained without a parallel diagnostic showing that its excess is insensitive to the same shared-component bias; this selective retention requires explicit justification to support the central interpretation.
Authors: The referee correctly notes an asymmetry in our diagnostic reporting. Composite metrics were rejected because causal-inference diagnostics showed their values were fully accounted for by shared-component structure. In contrast, the reported ΔQ for modularity is already computed against null models that preserve the full incidence structure and therefore control for shared-component effects. To supply the requested parallel diagnostic, we will add to the revised Results an explicit comparison of ΔQ computed before and after an additional control that permutes node labels among high-degree components; this will confirm that the excess remains statistically significant, thereby justifying retention of modularity as the relevant biological signature. revision: yes
-
Referee: Results: The statement that 25% of modules recur across samples is presented as evidence of non-arbitrary structure, but lacks a quantitative definition of recurrence, a statistical test against null expectations, or a comparison to the rate expected under the same null models used for ΔQ.
Authors: We accept that the recurrence claim requires a more rigorous statistical treatment. In the revised manuscript we will (i) provide an explicit quantitative definition of recurrence (modules sharing at least 60 % of reactions and appearing in at least 20 % of samples), (ii) generate the null distribution of recurrence rates by applying the identical community-detection procedure to networks randomized under the bipartite-incidence model, and (iii) report a permutation-test p-value showing that the observed 25 % recurrence significantly exceeds the null expectation. These additions will be placed in the Results section together with a brief description in Methods. revision: yes
Circularity Check
No significant circularity: empirical validation against independent null models
full rationale
The paper tests a pre-existing Network-Weighted Action Principle prediction using Tara Oceans metagenomic reconstructions and three standard null models (configuration-model, label-permutation, bipartite-incidence). Modularity excess is measured directly against these external benchmarks rather than being fitted or defined in terms of the target result. Absolute modularity is explicitly attributed to sparsity (a known structural feature), while the excess is reported as an empirical observation that is then interpreted as consistent with cost-minimization. No equations reduce a claimed prediction to its own inputs by construction, no parameters are fitted to a subset and relabeled as out-of-sample predictions, and no uniqueness theorem or ansatz is smuggled via self-citation to force the central claim. The derivation chain remains self-contained against the chosen null-model controls.
Axiom & Free-Parameter Ledger
axioms (1)
- domain assumption The Network-Weighted Action Principle, which predicts that networks under simultaneous energetic and informational constraints organize toward high modularity.
Lean theorems connected to this paper
-
Cost/FunctionalEquation.lean (J-cost as forced recognition cost)washburn_uniqueness_aczel echoesS_NW = ∫(E − I + AC) dt, where E measures internal cost, I measures information capacity ... and AC measures the cost of inter-component coupling on the network of biological constituents. Three structurally identical formulations live in this family. In classical mechanics... in statistical physics... in variational inference, the evidence lower bound...
-
Foundation/BranchSelection.leanbranch_selection (coupling combiner forces bilinear branch) unclearbiological networks should organize so as to minimize the connectivity cost while preserving information throughput. Connection-cost minimization in artificial network ensembles has been shown to spontaneously generate modular structure
Reference graph
Works this paper leans on
-
[1]
Archie, J.W. (1981). A new look at the predictive value of numerical classifications. Systematic Zoology 30(2): 220–223. Banavar, J.R., Damuth, J., Maritan, A., Rinaldo, A. (2010). Allometric cascades. Nature 421: 713–714. Barabási, A.-L., Oltvai, Z.N. (2004). Network biology: understanding the cell’s functional organization. Nature Reviews Genetics 5(2):...
1981
-
[2]
Brown, J.H., Gillooly, J.F., Allen, A.P., Savage, V.M., West, G.B. (2004). Toward a metabolic theory of ecology. Ecology 85(7): 1771–1789. Cannon, W.B. (1929). Organization for physiological homeostasis. Physiological Reviews 9(3): 399–431. Clauset, A., Newman, M.E.J., Moore, C. (2004). Finding community structure in very large networks. Physical Review E...
work page internal anchor Pith review Pith/arXiv arXiv doi:10.1113/jp290762 2004
-
[3]
Kafri, M., Metzl-Raz, E., Jonas, F., Barkai, N. (2016). Rethinking cell growth models. FEMS Yeast Research 16(7): fow081. Karsenti, E., Acinas, S.G., Bork, P., Bowler, C., De Vargas, C., Raes, J., Sullivan, M., Arendt, D., Benzoni, F., Claverie, J.-M., Follows, M., Gorsky, G., Hingamp, P., Iudicone, D., Jaillon, O., Kandels-Lewis, S., Krzic, U., Not, F., ...
2016
-
[4]
Newman, M.E.J. (2003). The structure and function of complex networks. SIAM Review 45(2): 167–256. Newman, M.E.J., Girvan, M. (2004). Finding and evaluating community structure in networks. Physical Review E 69(2): 026113. Olshausen, B.A., Field, D.J. (1996). Emergence of simple-cell receptive field properties by 44 learning a sparse code for natural imag...
2003
discussion (0)
Sign in with ORCID, Apple, or X to comment. Anyone can read and Pith papers without signing in.