Recognition: unknown
Causal Inference of Blood Pressure Reduction and Coronary Heart Disease Risk in the Framingham Study
Pith reviewed 2026-05-08 03:54 UTC · model grok-4.3
The pith
A 20 mmHg systolic blood pressure reduction lowers coronary heart disease risk by 3.4 percentage points in the Framingham cohort, but naive observational estimates overstate this absolute benefit by 22 percent.
A machine-rendered reading of the paper's core claim, the machinery that carries it, and where it could break.
Core claim
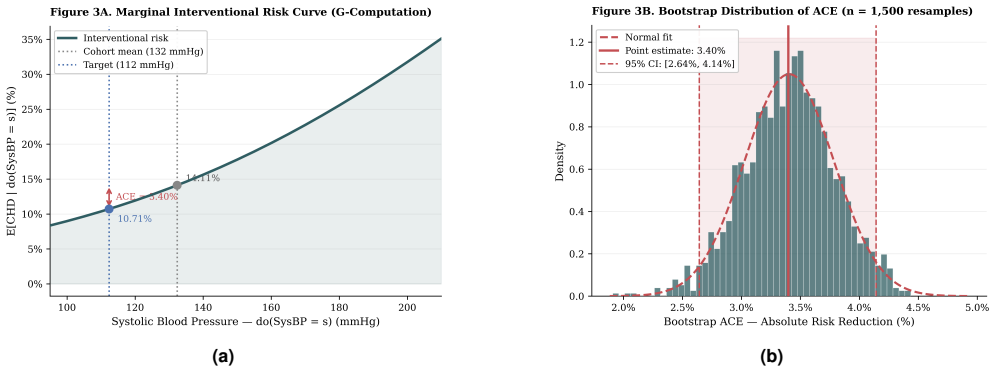
G-computation on a structurally corrected DAG yields an average causal effect of 3.40 percent absolute risk reduction (95 percent CI 2.64 to 4.14) for a 20 mmHg systolic blood pressure drop, against a naive observational estimate of 4.14 percent that overstates the benefit by roughly 21.8 percent. Propensity score matching and inverse probability weighting corroborate the result, while metalearners recover conditional average treatment effects.
What carries the argument
G-computation applied to a directed acyclic graph encoding systolic blood pressure as an intervention on coronary heart disease, with the do-operator removing confounding paths and conditional independence tests validating the graph structure.
If this is right
- Standard cardiovascular risk calculators that rely on conditional probabilities may systematically overstate the absolute benefit of blood pressure lowering.
- Prescribing thresholds for antihypertensive therapy could be adjusted if absolute risk reductions are smaller than those reported by observational tools.
- Risk stratification in primary prevention should incorporate interventional estimates to set more accurate expectations for patients.
- Metalearner methods can identify subgroups with differing causal benefits, informing personalized treatment decisions.
Where Pith is reading between the lines
- If the same pattern appears in other large cohorts, hypertension guidelines might raise the blood pressure level at which absolute benefit justifies treatment.
- The same causal framework could be applied to cholesterol or glucose reduction to recalibrate other preventive interventions.
- Longer-term follow-up data might reveal whether the overestimation grows or shrinks with extended observation periods.
Load-bearing premise
The directed acyclic graph correctly specifies all causal relationships and contains no unmeasured confounding between systolic blood pressure and coronary heart disease.
What would settle it
A new analysis that adds previously omitted variables such as unmeasured lifestyle factors or genetic instruments and finds the average causal effect estimate shifts outside the reported confidence interval.
Figures


read the original abstract
Standard cardiovascular risk calculators, including the Framingham Risk Score and the ACC/AHA Pooled Cohort Equations, estimate the conditional probability P(CHD | SysBP = s) rather than the interventional quantity P(CHD | do(SysBP = s)). When confounding is present, this distinction has direct clinical consequences: observational estimates may systematically overstate the absolute benefit of antihypertensive treatment. We applied Pearl's do-calculus to the Framingham Heart Study Offspring Cohort (n = 4,240; primary analysis on 3,776 complete cases; 574 ten-year coronary heart disease events). A structurally corrected directed acyclic graph (DAG) was specified and evaluated using conditional independence testing. The average causal effect (ACE) of a 20 mmHg systolic blood pressure reduction was estimated by g-computation with bootstrap confidence intervals, corroborated by propensity score matching and inverse probability weighting. G-computation yielded an ACE of 3.40 percent absolute risk reduction (95 percent CI: 2.64 to 4.14), compared with a naive observational estimate of 4.14 percent, corresponding to an approximate 21.8 percent relative overestimation. Conditional average treatment effects were estimated using R-Learner and T-Learner metalearners. These findings suggest that observational cardiovascular risk tools may overestimate the absolute benefit of blood pressure reduction, with implications for clinical risk stratification and prescribing thresholds.
Editorial analysis
A structured set of objections, weighed in public.
Referee Report
Summary. The manuscript applies causal inference methods to the Framingham Heart Study Offspring Cohort (n=4240, primary analysis n=3776 complete cases) to estimate the interventional effect of a 20 mmHg reduction in systolic blood pressure on 10-year coronary heart disease risk. Using a directed acyclic graph evaluated by conditional independence testing, g-computation yields an average causal effect of 3.40% absolute risk reduction (95% CI 2.64-4.14), compared with a naive observational estimate of 4.14% (implying ~21.8% relative overestimation). Results are corroborated via propensity score matching and inverse probability weighting; conditional average treatment effects are estimated with R-Learner and T-Learner metalearners. The central claim is that standard cardiovascular risk calculators overestimate the absolute benefit of antihypertensive treatment due to confounding.
Significance. If the identifying assumptions hold, the findings suggest that observational risk tools may overstate the absolute risk reduction from blood pressure lowering by roughly one-fifth, with direct implications for clinical risk stratification and treatment thresholds. Strengths include the multi-method identification strategy (g-computation, PSM, IPW) and the estimation of heterogeneous effects via metalearners; these provide internal consistency checks within the observed data. The work is a clear application of do-calculus to a well-known public cohort.
major comments (2)
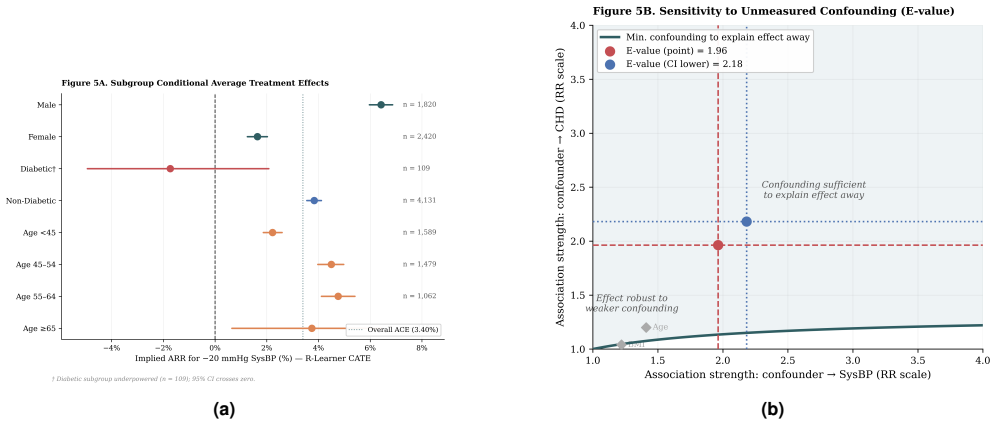
- [Methods (DAG specification and evaluation)] Methods (DAG specification and evaluation): The g-computation identification of P(CHD | do(SysBP = s-20)) requires that the structurally corrected DAG blocks all backdoor paths, including the assumption of no unmeasured confounding. Conditional independence testing on observed variables cannot detect or refute unmeasured common causes (e.g., diet, exercise, adherence, or socioeconomic factors). This assumption is load-bearing for both the reported ACE and the claimed 21.8% overestimation relative to the naive estimate; without sensitivity analyses (e.g., e-value or simulation of residual confounding), the gap between causal and observational estimates cannot be interpreted as a true causal difference.
- [Results (complete-case analysis)] Results (complete-case analysis): The primary analysis restricts to 3,776 complete cases out of 4,240 participants. No details are provided on the missing-data mechanism, patterns of missingness, or robustness checks via multiple imputation or inverse-probability-of-missingness weighting. If missingness is related to blood pressure, CHD events, or confounders, the estimated ACE and its comparison to the naive estimate could be biased.
minor comments (2)
- [Abstract and Methods] Abstract and Methods: The 21.8% relative overestimation is reported without an explicit formula (e.g., (naive - causal)/causal). Adding the exact definition would improve transparency.
- [Methods] Methods: The implementation of the 20 mmHg intervention in g-computation (e.g., how the counterfactual distribution is constructed and whether positivity is checked) should be described in more detail, including any software code or pseudocode.
Simulated Author's Rebuttal
We thank the referee for their constructive and detailed comments. We address each major comment below, indicating where we will revise the manuscript to incorporate the suggestions.
read point-by-point responses
-
Referee: Methods (DAG specification and evaluation): The g-computation identification of P(CHD | do(SysBP = s-20)) requires that the structurally corrected DAG blocks all backdoor paths, including the assumption of no unmeasured confounding. Conditional independence testing on observed variables cannot detect or refute unmeasured common causes (e.g., diet, exercise, adherence, or socioeconomic factors). This assumption is load-bearing for both the reported ACE and the claimed 21.8% overestimation relative to the naive estimate; without sensitivity analyses (e.g., e-value or simulation of residual confounding), the gap between causal and observational estimates cannot be interpreted as a true causal difference.
Authors: We agree that unmeasured confounding cannot be ruled out by conditional independence tests on observed variables and remains a key assumption. The DAG was constructed from established cardiovascular epidemiology literature and domain knowledge, with consistency checks via observed conditional independencies. Triangulation across g-computation, propensity score matching, and inverse probability weighting provides internal validation of the results. To strengthen interpretation of the causal-observational gap, we will add e-value sensitivity analyses for the average causal effect in the revised manuscript. revision: yes
-
Referee: Results (complete-case analysis): The primary analysis restricts to 3,776 complete cases out of 4,240 participants. No details are provided on the missing-data mechanism, patterns of missingness, or robustness checks via multiple imputation or inverse-probability-of-missingness weighting. If missingness is related to blood pressure, CHD events, or confounders, the estimated ACE and its comparison to the naive estimate could be biased.
Authors: We acknowledge that restricting to complete cases (n=3776) could introduce bias under non-random missingness. In the revised manuscript we will describe the observed missingness patterns and the assumed mechanism. We will also add multiple imputation as a sensitivity analysis and report the resulting ACE estimates alongside the complete-case results to evaluate robustness. revision: yes
Circularity Check
No significant circularity; standard causal methods applied to external cohort data
full rationale
The paper applies Pearl's do-calculus and g-computation (along with PSM and IPW) to the public Framingham Offspring Cohort to estimate the interventional ACE of a 20 mmHg SBP reduction on 10-year CHD risk. The reported 3.40% ARR is obtained by fitting the outcome model on observed data under the identifying assumptions encoded in the author-specified DAG; it is not algebraically equivalent to any fitted parameter or naive observational quantity by construction. Conditional independence tests are used only to check the DAG on observed variables and do not enter the g-computation formula itself. No self-citations are load-bearing, no ansatz is smuggled, and no uniqueness theorem from prior author work is invoked. The derivation therefore remains self-contained against external benchmarks and does not reduce the target causal quantity to its inputs.
Axiom & Free-Parameter Ledger
axioms (1)
- domain assumption The structurally corrected DAG correctly represents the causal structure with no unmeasured confounding.
Reference graph
Works this paper leans on
-
[1]
Prediction of coronary heart disease using risk factor categories.Circulation.1998;97(18):1837–1847
Wilson PWF, D’Agostino RB, Levy D, Belanger AM, Silbershatz H, Kannel WB. Prediction of coronary heart disease using risk factor categories.Circulation.1998;97(18):1837–1847
1998
-
[2]
SCORE2 risk prediction algorithms: new models to estimate 10-year risk of cardiovascular disease in Europe.Eur Heart J.2021;42(25):2439–2454
SCORE2 Working Group; ESC Cardiovascular Risk Collaboration. SCORE2 risk prediction algorithms: new models to estimate 10-year risk of cardiovascular disease in Europe.Eur Heart J.2021;42(25):2439–2454
2021
-
[3]
2013 ACC/AHA guideline on the assessment of cardiovascular risk.J Am Coll Cardiol.2014;63(25 Pt B):2935–2959
Goff DC Jr, Lloyd-Jones DM, Bennett G, et al. 2013 ACC/AHA guideline on the assessment of cardiovascular risk.J Am Coll Cardiol.2014;63(25 Pt B):2935–2959. 4.Pearl J.Causality: Models, Reasoning, and Inference.2nd ed. Cambridge: Cambridge University Press; 2009. 5.Hern ´an MA, Robins JM.Causal Inference: What If.Boca Raton: Chapman & Hall/CRC; 2020
2013
-
[4]
Factors of risk in the development of coronary heart disease—six year follow-up experience: the Framingham Study.Ann Intern Med.1961;55(1):33–50
Kannel WB, Dawber TR, Kagan A, Revotskie N, Stokes J III. Factors of risk in the development of coronary heart disease—six year follow-up experience: the Framingham Study.Ann Intern Med.1961;55(1):33–50
1961
-
[5]
On model selection and model misspecification in causal inference.Stat Methods Med Res.2012;21(1):7–30
Vansteelandt S, Bekaert M, Claeskens G. On model selection and model misspecification in causal inference.Stat Methods Med Res.2012;21(1):7–30. 8.Mansournia MA, Altman DG. Inverse probability weighting.BMJ.2016;352:i189. 9.Naimi AI, Cole SR, Kennedy EH. An introduction to g methods.Int J Epidemiol.2017;46(2):756–762
2012
-
[6]
Sensitivity analysis in observational research: introducing the E-value.Ann Intern Med
VanderWeele TJ, Ding P. Sensitivity analysis in observational research: introducing the E-value.Ann Intern Med. 2017;167(4):268–274. 11.Little RJA, Rubin DB.Statistical Analysis with Missing Data.3rd ed. Hoboken: Wiley; 2019
2017
-
[7]
The risk of hypertension in men: direct and indirect effects of chronic smoking.J Hypertens.2002;20(2):187–193
Halimi JM, Giraudeau B, V ol S, et al. The risk of hypertension in men: direct and indirect effects of chronic smoking.J Hypertens.2002;20(2):187–193
2002
-
[8]
Trends in lifetime risk and years of life lost due to diabetes in the USA, 1985–2011: a modelling study.Lancet Diabetes Endocrinol.2014;2(11):867–874
Gregg EW, Zhuo X, Cheng YJ, Albright AL, Narayan KMV , Thompson TJ. Trends in lifetime risk and years of life lost due to diabetes in the USA, 1985–2011: a modelling study.Lancet Diabetes Endocrinol.2014;2(11):867–874
1985
-
[9]
Assessment of frequency of progression to hypertension in non-hypertensive participants in the Framingham Heart Study: a cohort study.Lancet.2001;358(9294):1682–1686
Vasan RS, Larson MG, Leip EP, et al. Assessment of frequency of progression to hypertension in non-hypertensive participants in the Framingham Heart Study: a cohort study.Lancet.2001;358(9294):1682–1686. 15.Nie X, Wager S. Quasi-oracle estimation of heterogeneous treatment effects.Biometrika.2021;108(2):299–319
2001
-
[10]
Metalearners for estimating heterogeneous treatment effects using machine learning.Proc Natl Acad Sci USA.2019;116(10):4156–4165
K¨unzel SR, Sekhon JS, Bickel PJ, Yu B. Metalearners for estimating heterogeneous treatment effects using machine learning.Proc Natl Acad Sci USA.2019;116(10):4156–4165
2019
-
[11]
A randomized trial of intensive versus standard blood-pressure control.N Engl J Med.2015;373(22):2103–2116
SPRINT Research Group; Wright JT Jr, Williamson JD, Whelton PK, et al. A randomized trial of intensive versus standard blood-pressure control.N Engl J Med.2015;373(22):2103–2116
2015
-
[12]
Blood pressure lowering for prevention of cardiovascular disease and death: a systematic review and meta-analysis.Lancet.2016;387(10022):957–967
Ettehad D, Emdin CA, Kiran A, et al. Blood pressure lowering for prevention of cardiovascular disease and death: a systematic review and meta-analysis.Lancet.2016;387(10022):957–967
2016
-
[13]
2017 ACC/AHA guideline for the prevention, detection, evaluation, and management of high blood pressure in adults.J Am Coll Cardiol.2018;71(19):e127–e248
Whelton PK, Carey RM, Aronow WS, et al. 2017 ACC/AHA guideline for the prevention, detection, evaluation, and management of high blood pressure in adults.J Am Coll Cardiol.2018;71(19):e127–e248. 13/13
2017
discussion (0)
Sign in with ORCID, Apple, or X to comment. Anyone can read and Pith papers without signing in.