Recognition: unknown
SpatialEpiBench: Benchmarking Spatial Information and Epidemic Priors in Forecasting
Pith reviewed 2026-05-08 09:35 UTC · model grok-4.3
The pith
A new benchmark shows most spatiotemporal epidemic models underperform a simple last-value baseline even with priors and during outbreaks.
A machine-rendered reading of the paper's core claim, the machinery that carries it, and where it could break.
Core claim
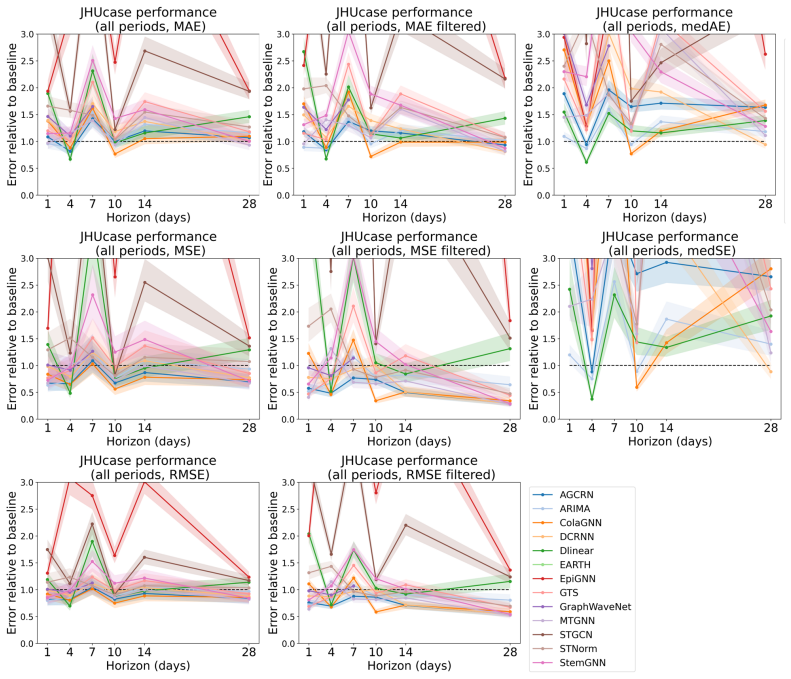
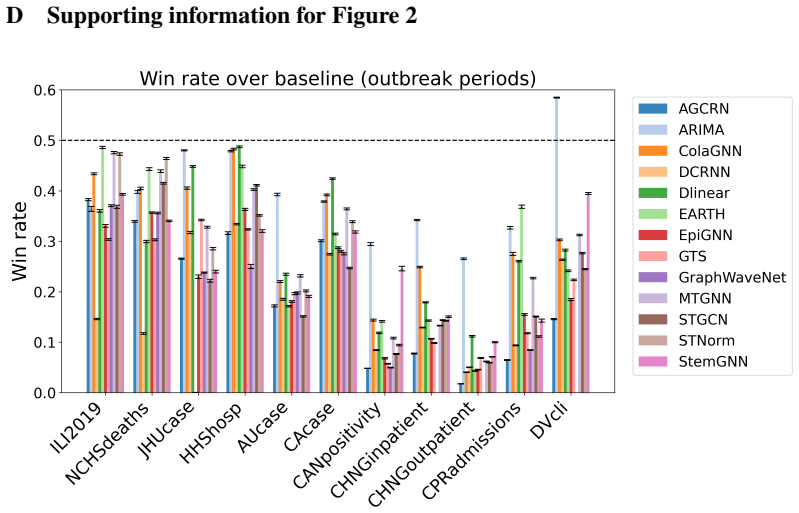
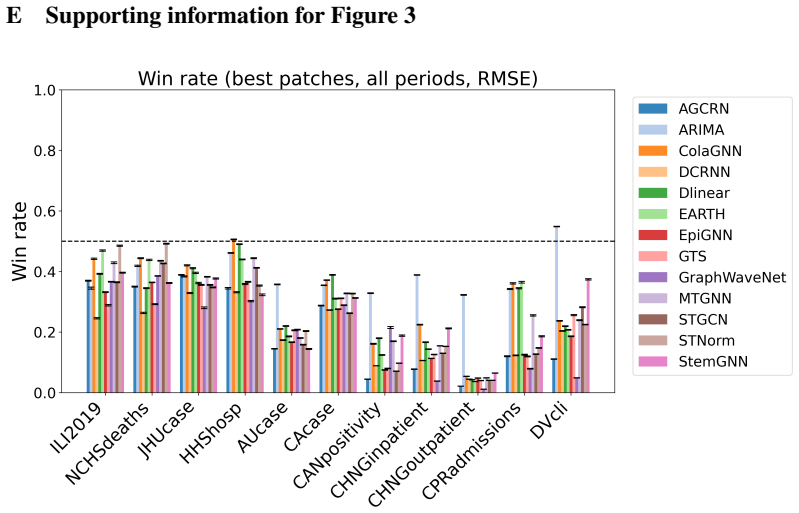
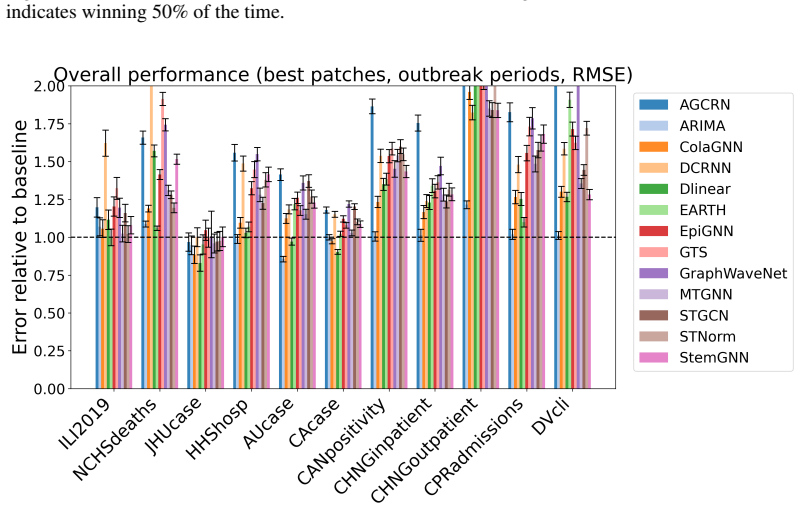
SpatialEpiBench demonstrates that adjacency-informed forecasting models equipped with widely used epidemic priors mostly underperform the last-value baseline from one day to one month ahead across eleven datasets, even during outbreaks, because of three failure modes: poor anticipation of new outbreaks, difficulty with sparsity and noise, and limited utility of common geographic adjacency for capturing epidemiological spatial information.
What carries the argument
SpatialEpiBench, a collection of eleven epidemic datasets together with standardized rolling evaluations and outbreak-specific metrics designed to assess the added value of spatial adjacency and epidemic priors.
Load-bearing premise
The standardized rolling evaluations and outbreak-specific metrics accurately reflect the challenges of real-time public health forecasting, and the selected models and adjacency representation adequately test the utility of spatial information.
What would settle it
A forecasting method that consistently outperforms the last-value baseline across all eleven datasets, multiple horizons from one day to one month, and both outbreak and non-outbreak periods in SpatialEpiBench would falsify the reported underperformance.
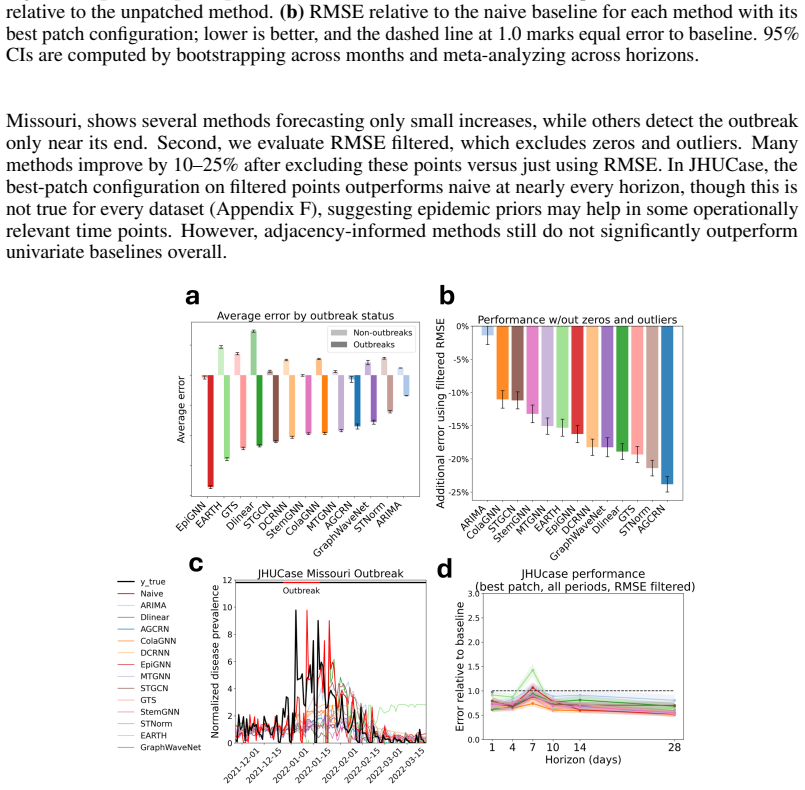
Figures


read the original abstract
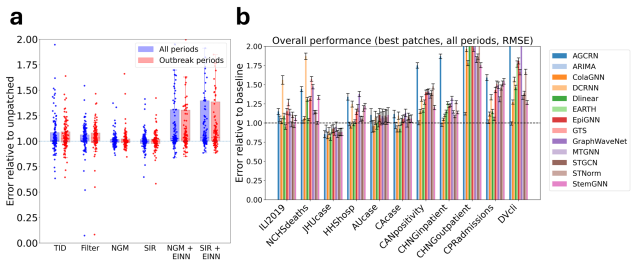
Accurate epidemic forecasting is crucial for public health response, resource allocation, and outbreak intervention, but remains difficult with sparse, noisy, and highly non-stationary data. Because epidemics unfold across interacting regions, spatiotemporal methods are natural candidates for improving forecasts. Despite growing interest in spatial information, no standardized benchmark exists, and current evaluations often use simple chronological train-test splits that do not reflect real-time forecasting practice. We address this gap with SpatialEpiBench, a challenging benchmark for spatiotemporal epidemic forecasting in realistic public-health settings. SpatialEpiBench includes 11 epidemic datasets with standardized rolling evaluations and outbreak-specific metrics. We evaluate adjacency-informed forecasting models with widely used epidemic priors that adapt general models to epidemiology, but find that most methods underperform a simple last-value baseline from 1 day to 1 month ahead, even during outbreaks and with these priors. We identify three major failure modes: (1) poor outbreak anticipation, (2) difficulty handling sparsity and noise, and (3) limited utility of common geographic adjacency for epidemiological spatial information. We release benchmark data, code, and instructions at https://github.com/Rachel-Lyu/SpatialEpiBench to support development of operationally useful epidemic forecasting models.
Editorial analysis
A structured set of objections, weighed in public.
Referee Report
Summary. The manuscript introduces SpatialEpiBench, a benchmark comprising 11 epidemic datasets with standardized rolling-window evaluations and outbreak-specific metrics. It evaluates adjacency-informed spatiotemporal forecasting models augmented with common epidemic priors and reports that the majority underperform a simple last-value baseline across 1-day to 1-month horizons, including during outbreaks. Three failure modes are identified: poor anticipation of outbreaks, difficulty with sparsity and noise, and limited utility of standard geographic adjacency for capturing epidemiological spatial structure. The benchmark data, code, and instructions are released publicly.
Significance. If the empirical findings prove robust, the work provides a valuable standardized challenge that documents concrete limitations of current spatial and prior-augmented approaches to epidemic forecasting. The public release of data and code is a clear strength that enables reproducibility and community follow-up. The results, if confirmed under more operationally realistic conditions, would usefully redirect attention toward methods that better handle non-stationarity, data revisions, and true spatial epidemiological signals rather than simple geographic adjacency.
major comments (2)
- [Abstract and benchmark evaluation description] Abstract and evaluation protocol: The central claim that adjacency-informed models with epidemic priors underperform the last-value baseline 'in realistic public-health settings' rests on rolling evaluations performed on finalized, complete time series. No simulation of reporting lags, backfills, or partial data availability is described, which directly affects whether the observed underperformance and the three failure modes (especially sparsity/noise) would hold under the operational conditions the benchmark purports to represent.
- [Results] Results section: The abstract states that 'most methods underperform' the baseline, yet no statistical significance tests, confidence intervals, or details on hyperparameter selection and exact train/validation/test splits are provided. Without these, it is impossible to determine whether the reported gaps are reliable or could be explained by optimization differences or particular data partitions.
minor comments (2)
- [Discussion] The three failure modes are listed but would benefit from quantitative backing (e.g., specific error breakdowns or dataset-level examples) to make the post-hoc diagnosis more falsifiable.
- [Methods] Notation for the adjacency matrices and the precise form of the epidemic priors should be defined once in a dedicated subsection rather than scattered across model descriptions.
Simulated Author's Rebuttal
We thank the referee for the constructive feedback on our manuscript. The comments highlight important aspects of operational realism and statistical rigor that we will address in revision. We respond to each major comment below.
read point-by-point responses
-
Referee: [Abstract and benchmark evaluation description] Abstract and evaluation protocol: The central claim that adjacency-informed models with epidemic priors underperform the last-value baseline 'in realistic public-health settings' rests on rolling evaluations performed on finalized, complete time series. No simulation of reporting lags, backfills, or partial data availability is described, which directly affects whether the observed underperformance and the three failure modes (especially sparsity/noise) would hold under the operational conditions the benchmark purports to represent.
Authors: We agree that our rolling-window evaluations are conducted on finalized, complete time series and do not simulate reporting lags, backfills, or partial data availability. This represents a genuine limitation relative to fully operational public-health conditions. The rolling protocol is intended to approximate real-time forecasting by restricting training data to information available at each forecast origin, but it does not capture data revisions or delayed reporting. We note that the observed underperformance of adjacency-informed models even under these idealized data conditions suggests the identified failure modes (particularly sparsity/noise handling) are likely to be at least as severe in operational settings. In revision we will (1) qualify the abstract language to specify that the benchmark assumes complete data while using rolling windows, (2) add an explicit limitations paragraph discussing the idealized data assumption, and (3) outline planned future extensions that incorporate simulated reporting delays. We do not claim the current results fully replicate operational conditions. revision: partial
-
Referee: [Results] Results section: The abstract states that 'most methods underperform' the baseline, yet no statistical significance tests, confidence intervals, or details on hyperparameter selection and exact train/validation/test splits are provided. Without these, it is impossible to determine whether the reported gaps are reliable or could be explained by optimization differences or particular data partitions.
Authors: We accept that the current manuscript lacks statistical significance tests, confidence intervals, and sufficient detail on hyperparameter selection and data splits. These omissions weaken the ability to assess the reliability of the performance gaps. In the revised manuscript we will add (1) paired statistical tests (Wilcoxon signed-rank tests across horizons and datasets) comparing each method against the last-value baseline, (2) bootstrap-derived 95% confidence intervals for all reported metrics, and (3) expanded methods text that fully documents the hyperparameter search ranges, validation strategy, and the precise rolling train/validation/test window definitions for every dataset and forecast horizon. These additions will be placed in the Results and Methods sections and will be accompanied by supplementary tables containing the raw per-dataset, per-horizon scores. revision: yes
Circularity Check
No circularity: pure empirical benchmark with direct comparisons
full rationale
This is an empirical benchmarking paper that evaluates existing spatiotemporal models against a simple last-value baseline on 11 epidemic datasets using standardized rolling evaluations and outbreak-specific metrics. The abstract and description contain no derivations, first-principles predictions, fitted parameters renamed as forecasts, or self-citation chains that justify a mathematical claim. All reported findings are direct empirical results from model runs on external data, with the last-value baseline serving as an independent comparator. No load-bearing step reduces to its own inputs by construction, satisfying the criteria for a self-contained empirical study.
Axiom & Free-Parameter Ledger
axioms (2)
- domain assumption Rolling chronological train-test splits reflect real-time forecasting practice
- domain assumption Geographic adjacency provides relevant spatial information for epidemic spread
Reference graph
Works this paper leans on
-
[1]
Estee Y . Cramer et. al. Evaluation of individual and ensemble probabilistic forecasts of covid-19 mortality in the united states.Proceedings of the National Academy of Sciences, 119(15): 9 e2113561119, 2022. doi: 10.1073/pnas.2113561119. URL https://www.pnas.org/doi/ abs/10.1073/pnas.2113561119
-
[2]
outbreak science
Caitlin Rivers, Jean-Paul Chretien, Steven Riley, Julie A Pavlin, Alexandra Woodward, David Brett-Major, Irina Maljkovic Berry, Lindsay Morton, Richard G Jarman, Matthew Biggerstaff, et al. Using “outbreak science” to strengthen the use of models during epidemics.Nature communications, 10(1):3102, 2019
2019
-
[3]
Quantifying the information in noisy epidemic curves.Nature Computational Science, 2(9):584–594, 2022
Kris V Parag, Christl A Donnelly, and Alexander E Zarebski. Quantifying the information in noisy epidemic curves.Nature Computational Science, 2(9):584–594, 2022
2022
-
[4]
Machine learning for data-centric epidemic forecasting.Nature Machine Intelligence, 6(10):1122–1131, 2024
Alexander Rodriguez, Harshavardhan Kamarthi, Pulak Agarwal, Javen Ho, Mira Patel, Suchet Sapre, and B Aditya Prakash. Machine learning for data-centric epidemic forecasting.Nature Machine Intelligence, 6(10):1122–1131, 2024
2024
-
[5]
Adaptive graph convolutional recurrent network for traffic forecasting.Advances in neural information processing systems, 33:17804–17815, 2020
Lei Bai, Lina Yao, Can Li, Xianzhi Wang, and Can Wang. Adaptive graph convolutional recurrent network for traffic forecasting.Advances in neural information processing systems, 33:17804–17815, 2020
2020
-
[6]
Yaguang Li, Rose Yu, Cyrus Shahabi, and Yan Liu. Diffusion convolutional recurrent neural network: Data-driven traffic forecasting.arXiv preprint arXiv:1707.01926, 2017
-
[7]
Connecting the dots: Multivariate time series forecasting with graph neural networks
Zonghan Wu, Shirui Pan, Guodong Long, Jing Jiang, Xiaojun Chang, and Chengqi Zhang. Connecting the dots: Multivariate time series forecasting with graph neural networks. In Proceedings of the 26th ACM SIGKDD international conference on knowledge discovery & data mining, pages 753–763, 2020
2020
-
[8]
Zewen Liu, Guancheng Wan, B. Aditya Prakash, Max S.Y . Lau, and Wei Jin. A review of graph neural networks in epidemic modeling. InProceedings of the 30th ACM SIGKDD Conference on Knowledge Discovery and Data Mining, KDD ’24, page 6577–6587, New York, NY , USA, 2024. Association for Computing Machinery. ISBN 9798400704901. doi: 10.1145/3637528.3671455. UR...
-
[9]
Do we really need foundation models for multi-step-ahead epidemic forecasting? InNeurIPS Workshop on Time Series in the Age of Large Models, 2024
Mrinmoy Dey, Aprameyo Chakrabartty, Dhruv Sarkar, and Tanujit Chakraborty. Do we really need foundation models for multi-step-ahead epidemic forecasting? InNeurIPS Workshop on Time Series in the Age of Large Models, 2024
2024
-
[10]
Zero-shot forecasting of epidemics
Madhurima Panja, Ojas Modak, Grace Younes, and Tanujit Chakraborty. Zero-shot forecasting of epidemics. InRecent Advances in Time Series Foundation Models Have We Reached the’BERT Moment’?, 2025
2025
-
[11]
IDOBE: Infectious Disease Outbreak forecasting Benchmark Ecosystem
Aniruddha Adiga, Jingyuan Chou, Anshul Chiranth, Bryan Lewis, Ana I Bento, Shaun Truelove, Geoffrey Fox, Madhav Marathe, Harry Hochheiser, and Srini Venkatramanan. Idobe: Infectious disease outbreak forecasting benchmark ecosystem.arXiv preprint arXiv:2604.18521, 2026
work page internal anchor Pith review Pith/arXiv arXiv 2026
-
[12]
Cola-gnn: Cross-location attention based graph neural networks for long-term ili prediction
Songgaojun Deng, Shusen Wang, Huzefa Rangwala, Lijing Wang, and Yue Ning. Cola-gnn: Cross-location attention based graph neural networks for long-term ili prediction. InProceedings of the 29th ACM international conference on information & knowledge management, pages 245–254, 2020
2020
-
[13]
Earth: Epidemiology-aware neural ode with continuous disease transmission graph
Guancheng Wan, Zewen Liu, Xiaojun Shan, Max SY Lau, B Aditya Prakash, and Wei Jin. Earth: Epidemiology-aware neural ode with continuous disease transmission graph. InForty-second International Conference on Machine Learning, 2025
2025
-
[14]
Epignn: Exploring spatial transmission with graph neural network for regional epidemic forecasting
Feng Xie, Zhong Zhang, Liang Li, Bin Zhou, and Yusong Tan. Epignn: Exploring spatial transmission with graph neural network for regional epidemic forecasting. InJoint European Conference on Machine Learning and Knowledge Discovery in Databases, pages 469–485. Springer, 2022
2022
-
[15]
Epidemiology-aware deep learning for infectious disease dynamics prediction
Mutong Liu, Yang Liu, and Jiming Liu. Epidemiology-aware deep learning for infectious disease dynamics prediction. InProceedings of the 32nd ACM International Conference on Information and Knowledge Management, pages 4084–4088, 2023. 10
2023
-
[16]
Fair allocation of scarce medical resources in the time of covid-19, 2020
Ezekiel J Emanuel, Govind Persad, Ross Upshur, Beatriz Thome, Michael Parker, Aaron Glickman, Cathy Zhang, Connor Boyle, Maxwell Smith, and James P Phillips. Fair allocation of scarce medical resources in the time of covid-19, 2020
2020
-
[17]
The mathematics of infectious diseases.SIAM review, 42(4):599–653, 2000
Herbert W Hethcote. The mathematics of infectious diseases.SIAM review, 42(4):599–653, 2000
2000
-
[18]
Inferring change points in the spread of covid-19 reveals the effectiveness of interventions.Science, 369(6500):eabb9789, 2020
Jonas Dehning, Johannes Zierenberg, F Paul Spitzner, Michael Wibral, Joao Pinheiro Neto, Michael Wilczek, and Viola Priesemann. Inferring change points in the spread of covid-19 reveals the effectiveness of interventions.Science, 369(6500):eabb9789, 2020
2020
-
[19]
Forecasting traffic congestion using arima modeling
Taghreed Alghamdi, Khalid Elgazzar, Magdi Bayoumi, Taysseer Sharaf, and Sumit Shah. Forecasting traffic congestion using arima modeling. In2019 15th international wireless communications & mobile computing conference (IWCMC), pages 1227–1232. IEEE, 2019
2019
-
[20]
Are transformers effective for time series forecasting? InProceedings of the AAAI conference on artificial intelligence, volume 37, pages 11121–11128, 2023
Ailing Zeng, Muxi Chen, Lei Zhang, and Qiang Xu. Are transformers effective for time series forecasting? InProceedings of the AAAI conference on artificial intelligence, volume 37, pages 11121–11128, 2023
2023
-
[21]
The united states covid-19 forecast hub dataset.Scientific data, 9(1):462, 2022
Estee Y Cramer, Yuxin Huang, Yijin Wang, Evan L Ray, Matthew Cornell, Johannes Bracher, Andrea Brennen, Alvaro J Castro Rivadeneira, Aaron Gerding, Katie House, et al. The united states covid-19 forecast hub dataset.Scientific data, 9(1):462, 2022
2022
-
[22]
Spatial temporal graph convolutional networks for skeleton-based action recognition
Sijie Yan, Yuanjun Xiong, and Dahua Lin. Spatial temporal graph convolutional networks for skeleton-based action recognition. InProceedings of the AAAI conference on artificial intelligence, volume 32, 2018
2018
-
[23]
Graph wavenet for deep spatial-temporal graph model- ing.arXiv preprint arXiv:1906.00121,
Zonghan Wu, Shirui Pan, Guodong Long, Jing Jiang, and Chengqi Zhang. Graph wavenet for deep spatial-temporal graph modeling.arXiv preprint arXiv:1906.00121, 2019
-
[24]
St-norm: Spatial and temporal normalization for multi-variate time series forecasting
Jinliang Deng, Xiusi Chen, Renhe Jiang, Xuan Song, and Ivor W Tsang. St-norm: Spatial and temporal normalization for multi-variate time series forecasting. InProceedings of the 27th ACM SIGKDD conference on knowledge discovery & data mining, pages 269–278, 2021
2021
-
[25]
Chao Shang, Jie Chen, and Jinbo Bi. Discrete graph structure learning for forecasting multiple time series.arXiv preprint arXiv:2101.06861, 2021
-
[26]
Spectral temporal graph neural network for multivariate time-series forecasting.Advances in neural information processing systems, 33:17766–17778, 2020
Defu Cao, Yujing Wang, Juanyong Duan, Ce Zhang, Xia Zhu, Congrui Huang, Yunhai Tong, Bixiong Xu, Jing Bai, Jie Tong, et al. Spectral temporal graph neural network for multivariate time-series forecasting.Advances in neural information processing systems, 33:17766–17778, 2020
2020
-
[27]
Basicts: An open source fair multivariate time series prediction benchmark
Yubo Liang, Zezhi Shao, Fei Wang, Zhao Zhang, Tao Sun, and Yongjun Xu. Basicts: An open source fair multivariate time series prediction benchmark. InInternational symposium on benchmarking, measuring and optimization, pages 87–101. Springer, 2022
2022
-
[28]
Causalgnn: Causal-based graph neural networks for spatio-temporal epidemic forecasting
Lijing Wang, Aniruddha Adiga, Jiangzhuo Chen, Adam Sadilek, Srinivasan Venkatramanan, and Madhav Marathe. Causalgnn: Causal-based graph neural networks for spatio-temporal epidemic forecasting. InProceedings of the AAAI conference on artificial intelligence, volume 36, pages 12191–12199, 2022
2022
-
[29]
Stan: spatio-temporal attention network for pandemic prediction using real-world evidence.Journal of the American Medical Informatics Association, 28(4): 733–743, 2021
Junyi Gao, Rakshith Sharma, Cheng Qian, Lucas M Glass, Jeffrey Spaeder, Justin Romberg, Jimeng Sun, and Cao Xiao. Stan: spatio-temporal attention network for pandemic prediction using real-world evidence.Journal of the American Medical Informatics Association, 28(4): 733–743, 2021
2021
-
[30]
Prior knowledge-enhanced spatio-temporal epidemic forecasting.arXiv preprint arXiv:2602.22270, 2026
Sijie Ruan, Jinyu Li, Jia Wei, Zenghao Xu, Jie Bao, Junshi Xu, Junyang Qiu, Hanning Yuan, Xiaoxiao Wang, and Shuliang Wang. Prior knowledge-enhanced spatio-temporal epidemic forecasting.arXiv preprint arXiv:2602.22270, 2026
-
[31]
Evidence- driven spatiotemporal covid-19 hospitalization prediction with ising dynamics.Nature commu- nications, 14(1):3093, 2023
Junyi Gao, Joerg Heintz, Christina Mack, Lucas Glass, Adam Cross, and Jimeng Sun. Evidence- driven spatiotemporal covid-19 hospitalization prediction with ising dynamics.Nature commu- nications, 14(1):3093, 2023. 11
2023
-
[32]
A review of graph neural networks in epidemic modeling
Zewen Liu, Guancheng Wan, B Aditya Prakash, Max SY Lau, and Wei Jin. A review of graph neural networks in epidemic modeling. InProceedings of the 30th ACM SIGKDD conference on knowledge discovery and data mining, pages 6577–6587, 2024
2024
-
[33]
Ruiqi Lyu, Alistair Turcan, and Bryan Wilder. Combining digital data streams and epidemic networks for real time outbreak detection.arXiv preprint arXiv:2511.07163, 2025
-
[34]
Delphi epidata api.The Lancet Infectious Diseases, 2015
David C Farrow, Logan C Brooks, Aaron Rumack, Ryan J Tibshirani, and Roni Rosenfeld. Delphi epidata api.The Lancet Infectious Diseases, 2015
2015
-
[35]
An interactive web-based dashboard to track covid-19 in real time.The Lancet infectious diseases, 20(5):533–534, 2020
Ensheng Dong, Hongru Du, and Lauren Gardner. An interactive web-based dashboard to track covid-19 in real time.The Lancet infectious diseases, 20(5):533–534, 2020
2020
-
[36]
Us influenza surveillance: purpose and methods
Centers for Disease Control, Prevention, et al. Us influenza surveillance: purpose and methods. National Center for Immunization and Respiratory Diseases (NCIRD)[cited 2024 Apr 29]. https://www. cdc. gov/flu/weekly/overview. htm, 2024
2024
-
[37]
Accuracy of real-time multi-model ensemble forecasts for seasonal influenza in the us
Nicholas G Reich, Craig J McGowan, Teresa K Yamana, Abhinav Tushar, Evan L Ray, Dave Osthus, Sasikiran Kandula, Logan C Brooks, Willow Crawford-Crudell, Graham Casey Gibson, et al. Accuracy of real-time multi-model ensemble forecasts for seasonal influenza in the us. PLoS computational biology, 15(11):e1007486, 2019
2019
-
[38]
Deepar: Probabilistic forecasting with autoregressive recurrent networks.International journal of forecasting, 36(3): 1181–1191, 2020
David Salinas, Valentin Flunkert, Jan Gasthaus, and Tim Januschowski. Deepar: Probabilistic forecasting with autoregressive recurrent networks.International journal of forecasting, 36(3): 1181–1191, 2020
2020
-
[39]
PhD thesis, Carnegie Mellon University, 2023
Aaron Rumack.Modeling Epidemiological Time Series. PhD thesis, Carnegie Mellon University, 2023
2023
-
[40]
Einns: epidemiologically-informed neural networks
Alexander Rodríguez, Jiaming Cui, Naren Ramakrishnan, Bijaya Adhikari, and B Aditya Prakash. Einns: epidemiologically-informed neural networks. InProceedings of the AAAI conference on artificial intelligence, volume 37, pages 14453–14460, 2023
2023
-
[41]
The construction of next-generation matrices for compartmental epidemic models.Journal of the royal society interface, 7(47):873–885, 2010
Odo Diekmann, Johan Andre Peter Heesterbeek, and Michael G Roberts. The construction of next-generation matrices for compartmental epidemic models.Journal of the royal society interface, 7(47):873–885, 2010
2010
-
[42]
Tusoai: Agentic optimization for scientific methods.arXiv preprint arXiv:2509.23986, 2025
Alistair Turcan, Kexin Huang, Lei Li, and Martin Jinye Zhang. Tusoai: Agentic optimization for scientific methods.arXiv preprint arXiv:2509.23986, 2025
-
[43]
we were unable to find the license for the dataset we used
Gabrielle Thivierge, Aaron Rumack, and F William Townes. Does spatial information improve forecasting of influenza-like illness?Epidemics, 51:100820, 2025. 12 A Data overview Our benchmark aggregates public and semi-public epidemiological surveillance signals spanning syndromic surveillance, mortality, confirmed cases, testing, hospitalization, claims-bas...
2025
-
[44]
Guidelines: • The answer [N/A] means that the paper does not involve crowdsourcing nor research with human subjects
Institutional review board (IRB) approvals or equivalent for research with human subjects Question: Does the paper describe potential risks incurred by study participants, whether such risks were disclosed to the subjects, and whether Institutional Review Board (IRB) approvals (or an equivalent approval/review based on the requirements of your country or ...
discussion (0)
Sign in with ORCID, Apple, or X to comment. Anyone can read and Pith papers without signing in.