Recognition: unknown
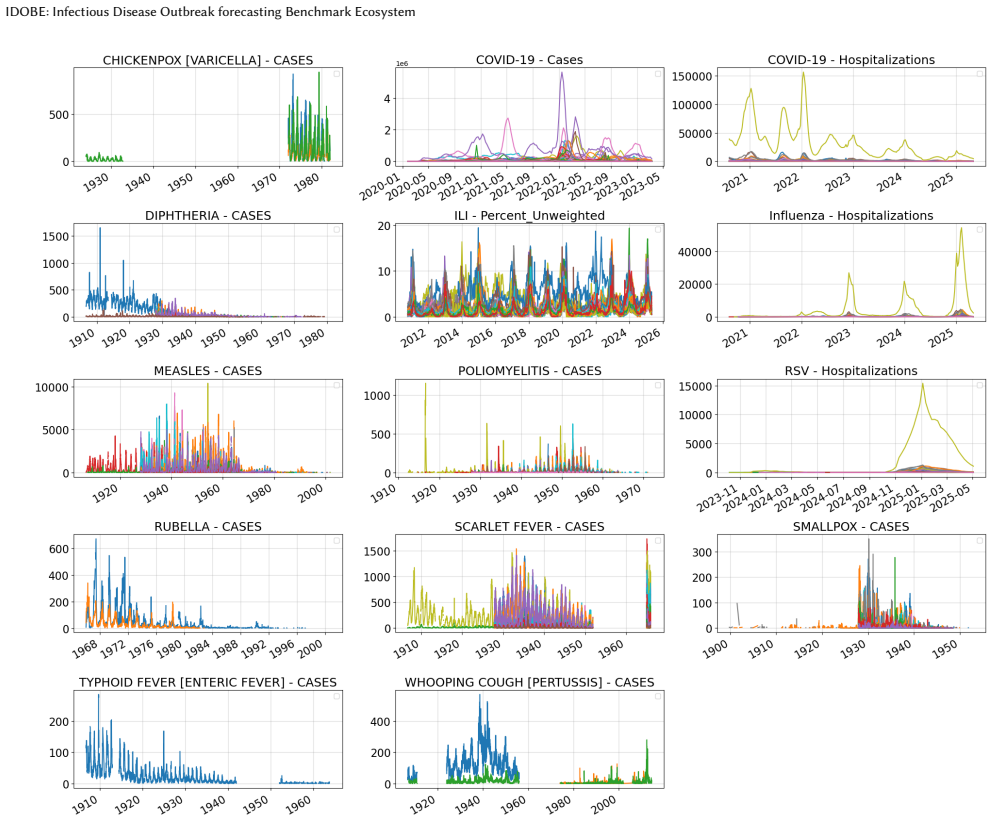
IDOBE: Infectious Disease Outbreak forecasting Benchmark Ecosystem
Pith reviewed 2026-05-10 05:23 UTC · model grok-4.3
The pith
A benchmark dataset of over 10,000 segmented infectious disease outbreaks reveals MLP models as most robust for short-term forecasting.
A machine-rendered reading of the paper's core claim, the machinery that carries it, and where it could break.
Core claim
IDOBE compiles epidemiological time series from multiple sources over a century, applies derivative-based segmentation to create over 10,000 outbreaks for 13 diseases with outcomes like cases and hospitalizations, quantifies diversity with information-theoretic measures, and benchmarks 11 models for 1- to 4-week forecasts, finding MLP-based methods have the most robust performance overall with statistical methods slightly better in the pre-peak phase.
What carries the argument
The derivative-based segmentation method that isolates individual outbreaks from continuous time series data by detecting changes in the rate of case increases.
If this is right
- Standardized benchmarking becomes possible for comparing new forecasting algorithms against established baselines.
- Focus on pre-peak performance can be prioritized for statistical methods in early detection scenarios.
- Models can be tested on diverse outbreak shapes and scales from historical data.
- Probabilistic forecasts can be evaluated using scores like NWIS in addition to point forecast metrics.
Where Pith is reading between the lines
- Releasing the dataset publicly could accelerate development of ensemble methods tailored to outbreak dynamics.
- Similar segmentation approaches might apply to other time series domains like financial crashes or ecological population booms.
- Extending to real-time data integration could test how well models handle reporting delays.
Load-bearing premise
The derivative-based segmentation reliably isolates true outbreaks without systematic bias from noise, reporting delays, or varying surveillance intensity.
What would settle it
If re-running the segmentation with added noise or different derivative thresholds produces substantially different sets of outbreaks and changes the relative performance rankings of the models.
Figures


read the original abstract
Epidemic forecasting has become an integral part of real-time infectious disease outbreak response. While collaborative ensembles composed of statistical and machine learning models have become the norm for real-time forecasting, standardized benchmark datasets for evaluating such methods are lacking. Further, there is limited understanding on performance of these methods for novel outbreaks with limited historical data. In this paper, we propose IDOBE, a curated collection of epidemiological time series focused on outbreak forecasting. IDOBE compiles from multiple data repositories spanning over a century of surveillance and across U.S. states and global locations. We perform derivative-based segmentation to generate over 10,000 outbreaks covering multiple outcomes such as cases and hospitalizations for 13 diseases. We consider a variety of information-theoretic and distributional measures to quantify the epidemiological diversity of the dataset. Finally, we perform multi-horizon short-term forecasting (1- to 4-week-ahead) through the progression of the outbreak using 11 baseline models and report on their performance. In addition to standard metrics such as NMSE and MAPE for point forecasts, we include probabilistic scoring rules such as Normalized Weighted Interval Score (NWIS) to quantify the performance. We find that MLP-based methods have the most robust performance, with statistical methods having a slight edge during the pre-peak phase. IDOBE dataset along with baselines are released publicly on https://github.com/NSSAC/IDOBE to enable standardized, reproducible benchmarking of outbreak forecasting methods.
Editorial analysis
A structured set of objections, weighed in public.
Referee Report
Summary. The manuscript introduces IDOBE, a benchmark dataset for infectious disease outbreak forecasting. It compiles multi-source epidemiological time series spanning over a century, applies derivative-based segmentation to produce over 10,000 outbreak segments for 13 diseases and multiple outcomes (cases, hospitalizations), quantifies diversity with information-theoretic and distributional metrics, evaluates 11 baseline models on 1-4 week ahead forecasting using NMSE, MAPE, and NWIS, and finds MLP methods most robust overall while statistical methods edge out in pre-peak phase. The dataset and baselines are released publicly.
Significance. Should the segmentation be shown to produce representative outbreaks without systematic bias, this work would provide a valuable public resource for standardized benchmarking of forecasting methods, particularly for novel outbreaks with limited data. The scale (>10k segments), diversity quantification, inclusion of probabilistic scoring, and public release are positive aspects that could facilitate reproducible research in epidemic forecasting.
major comments (2)
- [Abstract and Methods] Abstract and Methods (segmentation procedure): The derivative-based segmentation to generate over 10,000 outbreaks is presented without validation against known historical outbreaks, sensitivity analysis to noise/reporting delays/surveillance intensity, or details on threshold selection (noted as free parameters). This is load-bearing for the central claim of a reliable benchmark for novel outbreaks, as unvalidated segments risk including spurious events or missing real ones.
- [Results] Results (baseline evaluations): The claim that MLP-based methods have the most robust performance (with statistical methods edging pre-peak) is reported without error bars, confidence intervals, or statistical significance tests across segments. Combined with missing implementation details, this makes the performance comparisons only moderately verifiable and weakens support for the empirical conclusions.
minor comments (2)
- [Abstract] The abstract states that diversity is quantified but does not specify how the measures address potential inconsistencies in century-spanning multi-source data (e.g., changes in reporting practices).
- [Methods] Implementation details for the 11 baselines and exact segmentation code would improve reproducibility, even with the GitHub release.
Simulated Author's Rebuttal
We thank the referee for the constructive feedback and for recognizing the potential value of IDOBE as a standardized benchmark for infectious disease forecasting. We address each major comment point by point below, indicating revisions where appropriate to strengthen the manuscript while maintaining its core contributions.
read point-by-point responses
-
Referee: [Abstract and Methods] The derivative-based segmentation to generate over 10,000 outbreaks is presented without validation against known historical outbreaks, sensitivity analysis to noise/reporting delays/surveillance intensity, or details on threshold selection (noted as free parameters). This is load-bearing for the central claim of a reliable benchmark for novel outbreaks, as unvalidated segments risk including spurious events or missing real ones.
Authors: We acknowledge the referee's concern regarding the segmentation procedure's validation. In the revised manuscript, we will expand the Methods section with: (i) explicit details on threshold selection, including the specific values chosen and their epidemiological rationale; (ii) a sensitivity analysis examining the impact of threshold variations, added noise, and simulated reporting delays on the number and characteristics of generated segments; and (iii) qualitative examples demonstrating that the segmentation recovers well-known historical outbreaks for multiple diseases. While exhaustive quantitative validation against every documented outbreak in the literature is beyond the scope of a single revision (given the dataset scale and focus on novel outbreaks), these additions will address the core issues of transparency and robustness. We will also discuss limitations of the approach for surveillance intensity variations. revision: partial
-
Referee: [Results] The claim that MLP-based methods have the most robust performance (with statistical methods edging pre-peak) is reported without error bars, confidence intervals, or statistical significance tests across segments. Combined with missing implementation details, this makes the performance comparisons only moderately verifiable and weakens support for the empirical conclusions.
Authors: We agree that the results would benefit from greater statistical rigor and transparency. In the revision, we will add error bars (standard deviation across segments) and confidence intervals to all reported performance metrics (NMSE, MAPE, NWIS). We will also include statistical significance tests (e.g., Wilcoxon signed-rank tests with multiple-comparison correction) to evaluate differences between model classes, particularly for the pre-peak phase comparison. Implementation details for all 11 baselines (hyperparameters, training procedures, and code) will be expanded in the main text and fully documented in the public repository. These changes will make the empirical claims more verifiable and strengthen support for the conclusions. revision: yes
Circularity Check
No circularity: empirical data compilation and baseline evaluation
full rationale
The paper compiles time series from external repositories, applies a described derivative-based segmentation procedure to extract >10,000 outbreak segments, computes standard information-theoretic diversity measures on those segments, and evaluates 11 off-the-shelf baseline models using conventional point and probabilistic metrics. No equation or result is obtained by fitting a parameter to the target quantity itself, no self-citation chain supplies a load-bearing uniqueness theorem, and no ansatz is smuggled in to redefine the output as the input. The segmentation step is a preprocessing choice whose validity can be assessed externally; it does not reduce the benchmark's reported performance numbers to a tautology by construction. This is a standard self-contained empirical benchmark paper.
Axiom & Free-Parameter Ledger
free parameters (1)
- derivative thresholds for segmentation
axioms (1)
- domain assumption Surveillance data from the compiled repositories accurately reflect underlying incidence without major systematic biases
Forward citations
Cited by 2 Pith papers
-
EpiCastBench: Datasets and Benchmarks for Multivariate Epidemic Forecasting
EpiCastBench supplies 40 curated multivariate epidemic datasets and evaluates 15 forecasting models under unified preprocessing, horizons, metrics, and significance tests.
-
SpatialEpiBench: Benchmarking Spatial Information and Epidemic Priors in Forecasting
SpatialEpiBench shows adjacency-informed models with epidemic priors underperform a last-value baseline across 11 datasets from 1 day to 1 month ahead, identifying failures in outbreak anticipation, sparsity handling,...
Reference graph
Works this paper leans on
-
[1]
En- hancing covid-19 ensemble forecasting model performance using auxiliary data sources
Aniruddha Adiga, Gursharn Kaur, Benjamin Hurt, Lijing Wang, Przemyslaw Porebski, Srinivasan Venkatramanan, Bryan Lewis, and Madhav Marathe. En- hancing covid-19 ensemble forecasting model performance using auxiliary data sources. In2022 IEEE International Conference on Big Data (Big Data), pages 1594–1603. IEEE, 2022
2022
-
[2]
En- hancing covid-19 ensemble forecasting model performance using auxiliary data sources
Aniruddha Adiga, Gursharn Kaur, Benjamin Hurt, Lijing Wang, Przemyslaw Porebski, Srinivasan Venkatramanan, Bryan Lewis, and Madhav Marathe. En- hancing covid-19 ensemble forecasting model performance using auxiliary data sources. In2022 IEEE International Conference on Big Data (Big Data), pages 1594–1603, 2022
2022
-
[3]
All models are useful: Bayesian ensembling for robust high resolution covid-19 forecasting
Aniruddha Adiga, Lijing Wang, Benjamin Hurt, Akhil Peddireddy, Przemyslaw Porebski, Srinivasan Venkatramanan, Bryan Leroy Lewis, and Madhav Marathe. All models are useful: Bayesian ensembling for robust high resolution covid-19 forecasting. InProceedings of the 27th ACM SIGKDD Conference on Knowledge Discovery & Data Mining, pages 2505–2513, 2021
2021
-
[4]
Optuna: A next-generation hyperparameter optimization framework
Takuya Akiba, Shotaro Sano, Toshihiko Yanase, Takeru Ohta, and Masanori Koyama. Optuna: A next-generation hyperparameter optimization framework. InProceedings of the 25th ACM SIGKDD international conference on knowledge discovery & data mining, pages 2623–2631, 2019
2019
-
[5]
arXiv preprint arXiv:2410.10393 , year=
Taha Aksu, Gerald Woo, Juncheng Liu, Xu Liu, Chenghao Liu, Silvio Savarese, Caiming Xiong, and Doyen Sahoo. Gift-eval: A benchmark for general time series forecasting model evaluation.arXiv preprint arXiv:2410.10393, 2024
-
[6]
Permutation entropy: a natural complexity measure for time series.Physical review letters, 88(17):174102, 2002
Christoph Bandt and Bernd Pompe. Permutation entropy: a natural complexity measure for time series.Physical review letters, 88(17):174102, 2002
2002
-
[7]
Results from the centers for disease control and prevention’s predict the 2013–2014 influenza season challenge.BMC infectious diseases, 16:1– 10, 2016
Matthew Biggerstaff, David Alper, Mark Dredze, Spencer Fox, Isaac Chun-Hai Fung, Kyle S Hickmann, Bryan Lewis, Roni Rosenfeld, Jeffrey Shaman, Ming- Hsiang Tsou, et al. Results from the centers for disease control and prevention’s predict the 2013–2014 influenza season challenge.BMC infectious diseases, 16:1– 10, 2016
2013
-
[8]
Public health impact of the us scenario modeling hub.Epidemics, 44:100705, 2023
Rebecca K Borchering, Jessica M Healy, Betsy L Cadwell, Michael A Johansson, Rachel B Slayton, Megan Wallace, and Matthew Biggerstaff. Public health impact of the us scenario modeling hub.Epidemics, 44:100705, 2023
2023
-
[9]
Evaluating forecasts with scoringutils in r.arXiv preprint arXiv:2205.07090, 2022
Nikos I Bosse, Hugo Gruson, Anne Cori, Edwin van Leeuwen, Sebastian Funk, and Sam Abbott. Evaluating forecasts with scoringutils in r.arXiv preprint arXiv:2205.07090, 2022
-
[10]
Evalu- ating epidemic forecasts in an interval format.arXiv preprint arXiv:2005.12881, 2020
Johannes Bracher, Evan L Ray, Tilmann Gneiting, and Nicholas G Reich. Evalu- ating epidemic forecasts in an interval format.arXiv preprint arXiv:2005.12881, 2020
-
[11]
Olivares, Boris N
Cristian Challu, Kin G. Olivares, Boris N. Oreshkin, Federico García, Gonzalo Mena, and Artur Dubrawski. NHITS: Neural hierarchical interpolation for time series forecasting.Proceedings of the AAAI Conference on Artificial Intelligence, 37(6):6989–6997, 2023
2023
-
[12]
Learning Phrase Representations using RNN Encoder-Decoder for Statistical Machine Translation
Kyunghyun Cho, Bart van Merriënboer, Caglar Gulcehre, Dzmitry Bahdanau, Fethi Bougares, Holger Schwenk, and Yoshua Bengio. Learning phrase represen- tations using RNN encoder–decoder for statistical machine translation.arXiv preprint arXiv:1406.1078, 2014
work page internal anchor Pith review arXiv 2014
-
[13]
The united states covid-19 forecast hub dataset.medRxiv, 2021
Estee Y Cramer, Yuxin Huang, Yijin Wang, Evan L Ray, Matthew Cornell, Jo- hannes Bracher, Andrea Brennen, Alvaro J Castro Rivadeneira, Aaron Gerding, Katie House, et al. The united states covid-19 forecast hub dataset.medRxiv, 2021
2021
-
[14]
Evaluation of individual and ensemble probabilistic forecasts of covid-19 mortality in the united states.Proceedings of the National Academy of Sciences, 119(15):e2113561119, 2022
Estee Y Cramer, Evan L Ray, Velma K Lopez, Johannes Bracher, Andrea Brennen, Alvaro J Castro Rivadeneira, Aaron Gerding, Tilmann Gneiting, Katie H House, Yuxin Huang, et al. Evaluation of individual and ensemble probabilistic forecasts of covid-19 mortality in the united states.Proceedings of the National Academy of Sciences, 119(15):e2113561119, 2022
2022
-
[15]
Urbanization and humidity shape the intensity of influenza epidemics in us cities.Science, 362(6410):75–79, 2018
Benjamin D Dalziel, Stephen Kissler, Julia R Gog, Cecile Viboud, Ottar N Bjørn- stad, C Jessica E Metcalf, and Bryan T Grenfell. Urbanization and humidity shape the intensity of influenza epidemics in us cities.Science, 362(6410):75–79, 2018
2018
-
[16]
Summary results of the 2014-2015 darpa chikungunya challenge.BMC infectious diseases, 18:1–14, 2018
Sara Y Del Valle, Benjamin H McMahon, Jason Asher, Richard Hatchett, Joceline C Lega, Heidi E Brown, Mark E Leany, Yannis Pantazis, David J Roberts, Sean Moore, et al. Summary results of the 2014-2015 darpa chikungunya challenge.BMC infectious diseases, 18:1–14, 2018
2014
-
[17]
An interactive web-based dashboard to track covid-19 in real time.The Lancet infectious diseases, 20(5):533– 534, 2020
Ensheng Dong, Hongru Du, and Lauren Gardner. An interactive web-based dashboard to track covid-19 in real time.The Lancet infectious diseases, 20(5):533– 534, 2020
2020
-
[18]
Jeffrey L. Elman. Finding structure in time.Cognitive Science, 14(2):179–211, 1990
1990
-
[19]
Outbreak and case definitions
Centers for Disease Control and Prevention. Outbreak and case definitions. https: //www.cdc.gov/urdo/php/surveillance/outbreak-case-definitions.html. Accessed: 2025-05-14
2025
-
[20]
Epidemickabu a new method to identify epidemic waves and their peaks and valleys.medRxiv, pages 2024–03, 2024
Lina Marcela Ruiz Galvis, Anderson Alexis Ruales Barbosa, Oscar Ignacio Men- doza Cardozo, Noël Christopher Barengo, Jose L Peñalvo, and Paula Andrea Diaz Valencia. Epidemickabu a new method to identify epidemic waves and their peaks and valleys.medRxiv, pages 2024–03, 2024
2024
-
[21]
Olivares
Azul Garza, Max Mergenthaler Canseco, Cristian Challú, and Kin G. Olivares. StatsForecast: Lightning fast forecasting with statistical and econometric models. PyCon Salt Lake City, Utah, US 2022, 2022
2022
-
[22]
Probabilistic forecasts, calibration and sharpness.Journal of the Royal Statistical Society Series B: Statistical Methodology, 69(2):243–268, 2007
Tilmann Gneiting, Fadoua Balabdaoui, and Adrian E Raftery. Probabilistic forecasts, calibration and sharpness.Journal of the Royal Statistical Society Series B: Statistical Methodology, 69(2):243–268, 2007
2007
-
[23]
MIT Press, 2016
Ian Goodfellow, Yoshua Bengio, and Aaron Courville.Deep learning. MIT Press, 2016
2016
-
[24]
Long short-term memory.Neural Computation, 9(8):1735–1780, 1997
Sepp Hochreiter and Jürgen Schmidhuber. Long short-term memory.Neural Computation, 9(8):1735–1780, 1997
1997
-
[25]
Evaluation of an open forecasting challenge to assess skill of west nile virus neuroinvasive disease prediction.Parasites & Vectors, 16(1):11, 2023
Karen M Holcomb, Sarabeth Mathis, J Erin Staples, Marc Fischer, Christopher M Barker, Charles B Beard, Randall J Nett, Alexander C Keyel, Matteo Marcantonio, Marissa L Childs, et al. Evaluation of an open forecasting challenge to assess skill of west nile virus neuroinvasive disease prediction.Parasites & Vectors, 16(1):11, 2023
2023
-
[26]
OTexts, 2018
Rob J Hyndman and George Athanasopoulos.Forecasting: principles and practice. OTexts, 2018
2018
-
[27]
An open challenge to advance probabilistic forecasting for dengue epidemics.Proceedings of the National Academy of Sciences, 116(48):24268– 24274, 2019
Michael A Johansson, Karyn M Apfeldorf, Scott Dobson, Jason Devita, Anna L Buczak, Benjamin Baugher, Linda J Moniz, Thomas Bagley, Steven M Babin, Erhan Guven, et al. An open challenge to advance probabilistic forecasting for dengue epidemics.Proceedings of the National Academy of Sciences, 116(48):24268– 24274, 2019
2019
-
[28]
Foundation time series models for forecasting and policy evaluation in infectious disease epidemics.medRxiv, pages 2025–02, 2025
Suprabhath Kalahasti, Benjamin Faucher, Boxuan Wang, Claudio Ascione, Ri- cardo Carbajal, Maxime Enault, Christophe Vincent Cassis, Titouan Launay, Caroline Guerrisi, Pierre-Yves Boëlle, et al. Foundation time series models for forecasting and policy evaluation in infectious disease epidemics.medRxiv, pages 2025–02, 2025
2025
-
[29]
Pems: Pre-trained epidemic time-series models.arXiv preprint arXiv:2311.07841, 2023
Harshavardhan Kamarthi and B Aditya Prakash. Pems: Pre-trained epidemic time-series models.arXiv preprint arXiv:2311.07841, 2023
-
[30]
Coordinating collaborative infectious disease modeling projects with the hubverse.medRxiv: the preprint server for health sciences, 2025
Melissa Kerr, Rebecca Borchering, Alvaro Castro Rivadeneira, Lucie Contamin, Sebastian Funk, Harry Hochheiser, Emily Howerton, Anna Krystalli, Li Shan- dross, Nicholas G Reich, et al. Coordinating collaborative infectious disease modeling projects with the hubverse.medRxiv: the preprint server for health sciences, 2025
2025
-
[31]
Flynn, René Vidal, Austin Reiter, and Gregory D
Colin Lea, Michael D. Flynn, René Vidal, Austin Reiter, and Gregory D. Hager. Temporal convolutional networks for action segmentation and detection.Proceed- ings of the IEEE Conference on Computer Vision and Pattern Recognition (CVPR), pages 156–165, 2017
2017
-
[32]
Arık, Nicolas Loeff, and Tomas Pfister
Bryan Lim, Sercan Ö. Arık, Nicolas Loeff, and Tomas Pfister. Temporal fusion transformers for interpretable multi-horizon time series forecasting.International Journal of Forecasting, 37(4):1748–1764, 2021
2021
-
[33]
The us covid-19 and influenza scenario modeling hubs: delivering long-term projections to guide policy.Epidemics, 46:100738, 2024
Sara L Loo, Emily Howerton, Lucie Contamin, Claire P Smith, Rebecca K Borcher- ing, Luke C Mullany, Samantha Bents, Erica Carcelen, Sung-mok Jung, Tiffany Bogich, et al. The us covid-19 and influenza scenario modeling hubs: delivering long-term projections to guide policy.Epidemics, 46:100738, 2024
2024
-
[34]
Challenges of covid-19 case forecasting in the us, 2020–2021.PLoS compu- tational biology, 20(5):e1011200, 2024
Velma K Lopez, Estee Y Cramer, Robert Pagano, John M Drake, Eamon B O’Dea, Madeline Adee, Turgay Ayer, Jagpreet Chhatwal, Ozden O Dalgic, Mary A Ladd, et al. Challenges of covid-19 case forecasting in the us, 2020–2021.PLoS compu- tational biology, 20(5):e1011200, 2024
2020
-
[35]
Raimundo Seguí López-Peñalver, Rubén Cañas-Cañas, Jorge Casaña-Mohedo, José Vicente Benavent-Cervera, Julio Fernández-Garrido, Raúl Juárez-Vela, Ana Pellín-Carcelén, Vicente Gea-Caballero, and Vicente Andreu-Fernández. Predic- tive potential of SARS-Cov-2 RNA concentration in wastewater to assess the dynamics of COVID-19 clinical outcomes and infections.S...
2023
-
[36]
Applying infectious disease forecasting to public health: a path forward using influenza forecasting examples.BMC Public Health, 19(1):1659, 2019
Chelsea S Lutz, Mimi P Huynh, Monica Schroeder, Sophia Anyatonwu, F Scott Dahlgren, Gregory Danyluk, Danielle Fernandez, Sharon K Greene, Nodar Kip- shidze, Leann Liu, et al. Applying infectious disease forecasting to public health: a path forward using influenza forecasting examples.BMC Public Health, 19(1):1659, 2019
2019
-
[37]
The m3-competition: results, conclusions and implications.International journal of forecasting, 16(4):451–476, 2000
Spyros Makridakis and Michele Hibon. The m3-competition: results, conclusions and implications.International journal of forecasting, 16(4):451–476, 2000
2000
-
[38]
The m4 competition: 100,000 time series and 61 forecasting methods.International Journal of Forecasting, 36(1):54–74, 2020
Spyros Makridakis, Evangelos Spiliotis, and Vassilios Assimakopoulos. The m4 competition: 100,000 time series and 61 forecasting methods.International Journal of Forecasting, 36(1):54–74, 2020
2020
-
[39]
The m5 competition: Background, organization, and implementation.International Journal of Forecasting, 38(4):1325–1336, 2022
Spyros Makridakis, Evangelos Spiliotis, and Vassilios Assimakopoulos. The m5 competition: Background, organization, and implementation.International Journal of Forecasting, 38(4):1325–1336, 2022
2022
-
[40]
Sarabeth M Mathis, Alexander E Webber, Tomás M León, Erin L Murray, Mon- ica Sun, Lauren A White, Logan C Brooks, Alden Green, Addison J Hu, Roni Rosenfeld, et al. Evaluation of flusight influenza forecasting in the 2021–22 and 2022–23 seasons with a new target laboratory-confirmed influenza hospitaliza- tions.Nature communications, 15(1):6289, 2024
2021
-
[41]
Olivares, Cristian Challú, Federico Garza, Max Mergenthaler Canseco, and Artur Dubrawski
Kin G. Olivares, Cristian Challú, Federico Garza, Max Mergenthaler Canseco, and Artur Dubrawski. NeuralForecast: User friendly state-of-the-art neural forecasting models. PyCon Salt Lake City, Utah, US 2022, 2022
2022
-
[42]
Oreshkin, Dmitri Carpov, Nicolas Chapados, and Yoshua Bengio
Boris N. Oreshkin, Dmitri Carpov, Nicolas Chapados, and Yoshua Bengio. N- BEATS: Neural basis expansion analysis for interpretable time series forecasting. International Conference on Learning Representations, 2020. Adiga et al
2020
-
[43]
A collaborative multiyear, multimodel assessment of seasonal influenza forecasting in the united states.Proceedings of the National Academy of Sciences, 116(8):3146–3154, 2019
Nicholas G Reich, Logan C Brooks, Spencer J Fox, Sasikiran Kandula, Craig J McGowan, Evan Moore, Dave Osthus, Evan L Ray, Abhinav Tushar, Teresa K Yamana, et al. A collaborative multiyear, multimodel assessment of seasonal influenza forecasting in the united states.Proceedings of the National Academy of Sciences, 116(8):3146–3154, 2019
2019
-
[44]
Epidemic tracking and forecasting: Lessons learned from a tumultuous year.Proceedings of the National Academy of Sciences, 118(51):e2111456118, 2021
Roni Rosenfeld and Ryan J Tibshirani. Epidemic tracking and forecasting: Lessons learned from a tumultuous year.Proceedings of the National Academy of Sciences, 118(51):e2111456118, 2021
2021
-
[45]
On the predictability of infectious disease outbreaks.Nature communications, 10(1):898, 2019
Samuel V Scarpino and Giovanni Petri. On the predictability of infectious disease outbreaks.Nature communications, 10(1):898, 2019
2019
-
[46]
Multi-model ensembles in infectious disease and public health: Methods, interpretation, and implementation in r
Li Shandross, Emily Howerton, Lucie Contamin, Harry Hochheiser, Anna Krys- talli, Nicholas G Reich, Evan L Ray, et al. Multi-model ensembles in infectious disease and public health: Methods, interpretation, and implementation in r. medRxiv, pages 2024–06, 2025
2024
-
[47]
The epibench platform to propel ai/ml-based epidemic forecasting: A prototype demonstration reaching human expert-level performance
Ajitesh Srivastava, Tianjian Xu, and Viktor K Prasanna. The epibench platform to propel ai/ml-based epidemic forecasting: A prototype demonstration reaching human expert-level performance. InInternational Workshop on Health Intelligence, pages 165–179. Springer, 2021
2021
-
[48]
A framework for evaluating epidemic forecasts.BMC infectious diseases, 17(1):345, 2017
Farzaneh Sadat Tabataba, Prithwish Chakraborty, Naren Ramakrishnan, Srini- vasan Venkatramanan, Jiangzhuo Chen, Bryan Lewis, and Madhav Marathe. A framework for evaluating epidemic forecasts.BMC infectious diseases, 17(1):345, 2017
2017
-
[49]
Willem G van Panhuis, Anne Cross, and Donald S Burke. Project tycho 2.0: a repository to improve the integration and reuse of data for global population health.Journal of the American Medical Informatics Association, 25(12):1608–1617, 2018
2018
-
[50]
Informer: Beyond efficient transformer for long sequence time-series forecasting.Proceedings of the AAAI Conference on Artificial Intelli- gence, 35(12):11106–11115, 2021
Haoyi Zhou, Shanghang Zhang, Jieqi Peng, Shuai Zhang, Jianxin Li, Hui Xiong, and Wancai Zhang. Informer: Beyond efficient transformer for long sequence time-series forecasting.Proceedings of the AAAI Conference on Artificial Intelli- gence, 35(12):11106–11115, 2021. A Disease- and Outcome-Specific Baseline Performance IDOBE: Infectious Disease Outbreak fo...
2021
discussion (0)
Sign in with ORCID, Apple, or X to comment. Anyone can read and Pith papers without signing in.