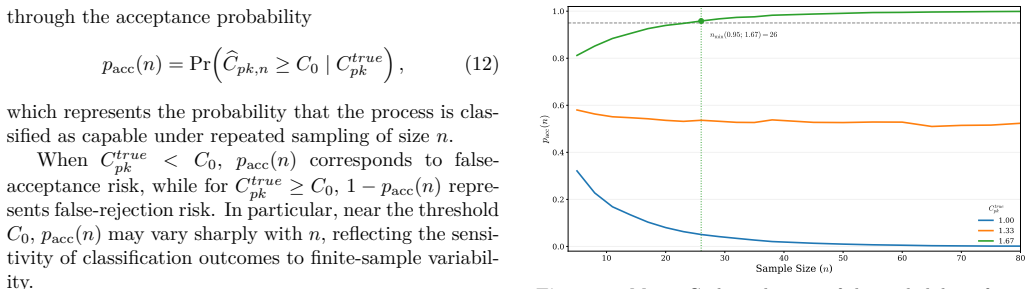
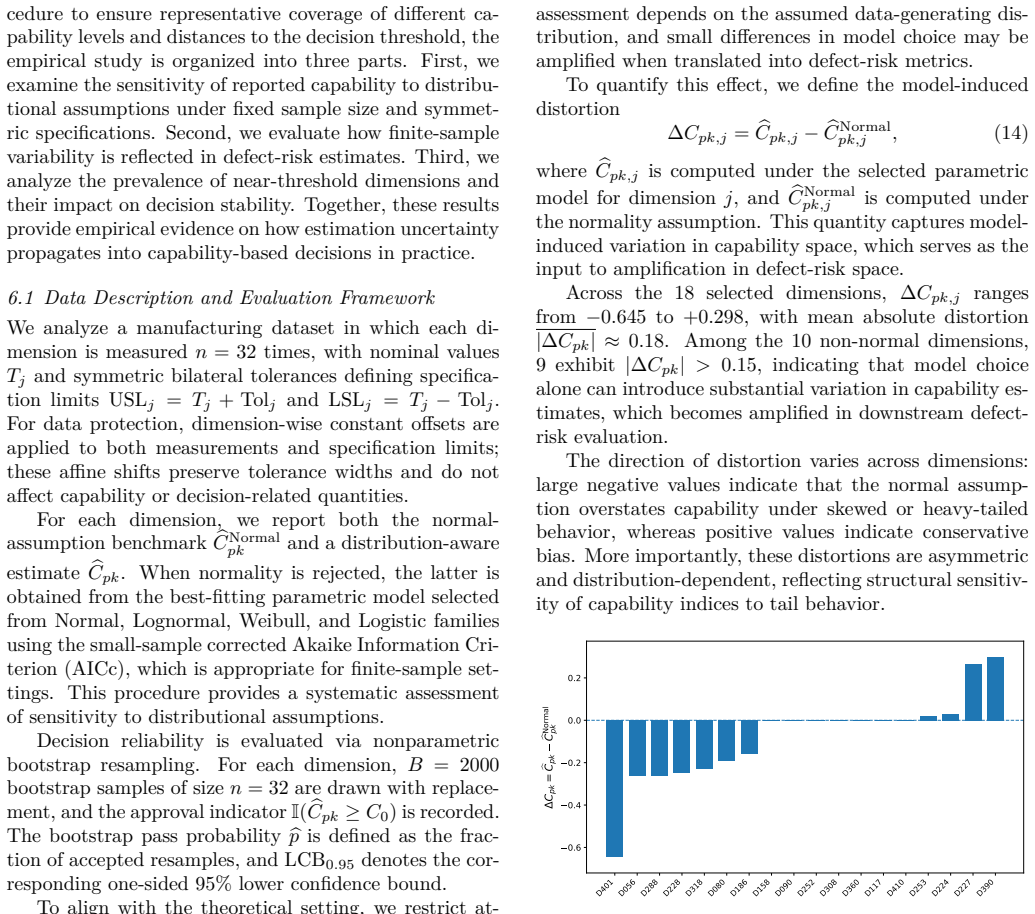
Recognition: 2 theorem links
· Lean TheoremNonlinear Amplification of Finite-Sample Uncertainty in Capability-Based Decisions
Pith reviewed 2026-05-11 01:10 UTC · model grok-4.3
The pith
Finite-sample errors in capability indices amplify nonlinearly into defect probability estimates
A machine-rendered reading of the paper's core claim, the machinery that carries it, and where it could break.
Core claim
Capability estimators vary approximately linearly with process dispersion, but defect probabilities depend on tail curvature, causing small estimation errors to be disproportionately amplified in defect probability and parts-per-million rates, so that capability assessments that appear stable in index space exhibit substantial variability in defect-risk space particularly near decision thresholds.
What carries the argument
The nonlinear amplification mechanism that maps linear capability-index uncertainty through tail curvature into defect-probability variability.
If this is right
- Sample-size planning must be linked to required decision reliability in defect-risk space rather than index precision alone.
- Capability-based approvals need explicit uncertainty propagation to defect metrics to avoid threshold instability.
- Reliability-aware decision rules are required to account for the amplified variability observed in simulations and real data.
- The mechanism supplies a unified account of finite-sample instabilities that appear in manufacturing practice.
Where Pith is reading between the lines
- The same tail-curvature amplification may appear in other statistical decisions that convert linear estimates into probabilities, such as reliability or risk thresholds.
- Moving decision boundaries away from steep regions of the defect-probability curve could reduce observed instability.
- The framework invites explicit sample-size formulas that target acceptable variance in PPM rates directly.
Load-bearing premise
The dominant source of decision instability is the nonlinear mapping from capability index to tail probability rather than model misspecification or non-stationarity in the process data.
What would settle it
Monte Carlo runs or industrial datasets in which defect-probability variability matches only the linear propagation of index variance, with no extra spread from tail curvature near thresholds, would falsify the claimed amplification.
Figures
read the original abstract
This paper studies the propagation of finite-sample uncertainty under nonlinear transformations commonly used in statistical decision systems. In particular, we consider process capability indices, which are widely used in manufacturing practice but are estimated from finite samples, rendering the resulting approval decisions inherently uncertain. We show that such uncertainty cannot be fully explained by estimator variability alone, but is substantially influenced by a nonlinear amplification mechanism through which capability uncertainty is transformed into defect-risk metrics. While capability estimators vary approximately linearly with process dispersion, defect probabilities depend on tail curvature, causing small estimation errors to be disproportionately amplified in measures such as defect probability and parts-per-million (PPM) rates. Consequently, capability assessments that appear stable in index space may exhibit substantial variability in defect-risk space, particularly near decision thresholds. This insight provides a unified explanation of finite-sample decision instability, motivates reliability-aware decision formulations, and links sample-size requirements directly to decision reliability. Monte Carlo simulations and industrial data analyses validate the proposed mechanism and demonstrate its practical implications, including the impact of distributional assumptions on defect-risk estimation.
Editorial analysis
A structured set of objections, weighed in public.
Referee Report
Summary. The paper claims that finite-sample uncertainty in process capability index estimators propagates through nonlinear tail mappings (e.g., to defect probabilities and PPM rates) in a manner that cannot be fully explained by estimator variability alone. Small errors in the capability index are disproportionately amplified near decision thresholds due to tail curvature, producing substantial instability in defect-risk metrics even when index values appear stable. Monte Carlo simulations and industrial data analyses are presented as validation, with implications for reliability-aware decisions and sample-size requirements tied to decision reliability.
Significance. If the nonlinear amplification mechanism can be isolated from other sources of variability, the work supplies a coherent explanation for observed instabilities in capability-based manufacturing decisions and directly connects sample-size planning to decision reliability. The attempt to unify estimator variability with tail nonlinearity and to demonstrate practical consequences via both simulation and real data is a constructive contribution to applied statistics in quality control.
major comments (2)
- [Monte Carlo Simulations] Monte Carlo Simulations section: the central claim that uncertainty 'cannot be fully explained by estimator variability alone' and is 'substantially influenced' by nonlinear amplification requires an explicit baseline comparison (e.g., delta-method or first-order Taylor expansion of the tail probability applied to the same estimated indices) to quantify the incremental contribution of tail curvature versus inherent estimator variance. No such comparison is described, leaving the dominance of the nonlinear mechanism unverified.
- [Industrial Data Analyses] Industrial Data Analyses section: the validation asserts support from real data but supplies no quantitative results, error bars, confidence intervals, or description of controls for confounding factors such as non-stationarity or model misspecification. Without these, the degree of empirical support for the amplification claim cannot be assessed.
minor comments (2)
- [Abstract] Abstract: the summary of validation results is entirely qualitative; adding one or two key quantitative findings (e.g., observed amplification factors or PPM variability ranges) would improve informativeness.
- [Introduction] Notation: the distinction between linear variation in the capability estimator and nonlinear tail mapping is stated clearly in prose but would benefit from an explicit equation contrasting the two mappings (e.g., a first-order vs. full nonlinear expression for defect probability).
Simulated Author's Rebuttal
We thank the referee for the insightful comments on our manuscript. We address each of the major comments below, indicating the changes we plan to make in the revised version.
read point-by-point responses
-
Referee: [Monte Carlo Simulations] Monte Carlo Simulations section: the central claim that uncertainty 'cannot be fully explained by estimator variability alone' and is 'substantially influenced' by nonlinear amplification requires an explicit baseline comparison (e.g., delta-method or first-order Taylor expansion of the tail probability applied to the same estimated indices) to quantify the incremental contribution of tail curvature versus inherent estimator variance. No such comparison is described, leaving the dominance of the nonlinear mechanism unverified.
Authors: We agree that providing an explicit baseline comparison would better isolate the contribution of the nonlinear amplification mechanism. In the revised manuscript, we will augment the Monte Carlo Simulations section with a comparison against a first-order approximation (such as the delta method applied to the tail probability function) using the same estimated capability indices. This will allow us to quantify the additional variability introduced by the tail curvature beyond what is attributable to estimator variance alone. We believe this addition will substantiate our central claim more rigorously. revision: yes
-
Referee: [Industrial Data Analyses] Industrial Data Analyses section: the validation asserts support from real data but supplies no quantitative results, error bars, confidence intervals, or description of controls for confounding factors such as non-stationarity or model misspecification. Without these, the degree of empirical support for the amplification claim cannot be assessed.
Authors: We acknowledge the need for more detailed quantitative reporting in the Industrial Data Analyses section. In the revision, we will include specific numerical results from the data analyses, along with error bars and confidence intervals for the key defect-risk metrics. Additionally, we will describe the steps taken to address potential confounding factors, including checks for stationarity and sensitivity to distributional assumptions. This will enable a better evaluation of the empirical validation provided by the industrial data. revision: yes
Circularity Check
No circularity: mathematical distinction and simulation validation are self-contained
full rationale
The paper's core argument distinguishes linear finite-sample variability of capability-index estimators from the nonlinear curvature of the tail-probability mapping (e.g., defect probability or PPM). This distinction is presented as a direct mathematical property of the transformation, not derived from any fitted parameter or self-referential definition. Validation is supplied by Monte Carlo experiments and industrial data that compare observed variability against the claimed mechanism; no equation is shown to reduce the target quantity to a quantity defined by the same data or by a prior self-citation. No self-citation load-bearing steps, uniqueness theorems, or ansatz smuggling are indicated in the provided text. The derivation therefore remains independent of its inputs.
Axiom & Free-Parameter Ledger
axioms (2)
- domain assumption Capability indices are estimated from finite samples drawn from a process whose distribution permits tail-probability calculations.
- domain assumption Defect probability is obtained by evaluating the tail of the fitted distribution beyond specification limits.
Lean theorems connected to this paper
-
IndisputableMonolith/Cost/FunctionalEquation.leanwashburn_uniqueness_aczel unclearAσ = z ϕ(z) / (1−Φ(z)) = z r(z) ... Aσ = 3 Cpk r(3 Cpk)
-
IndisputableMonolith/Foundation/RealityFromDistinction.leanreality_from_one_distinction unclearVar([PPM) ≈ ∇h⊤ Σ ∇h ... Var([PPM) ≫ Var(Ĉpk)
Reference graph
Works this paper leans on
-
[1]
Victor E. Kane. Process Capability Indices.Jour- nal of Quality Technology, 18(1):41–52, January
-
[2]
ISSN 0022-4065. doi: 10.1080/00224065.1986. 11978984
-
[3]
Mohammed Z. Anis. Basic Process Capability In- dices: An Expository Review.International Statis- tical Review, 76(3):347–367, December 2008. ISSN 0306-7734, 1751-5823. doi: 10.1111/j.1751-5823. 2008.00060.x
-
[4]
Samuel Kotz and Norman L. Johnson. Process Ca- pability Indices—A Review, 1992–2000.Journal of Quality Technology, 34(1):2–19, January 2002. ISSN 0022-4065, 2575-6230. doi: 10.1080/00224065.2002. 11980119
-
[5]
Douglas C Montgomery.Introduction to statistical quality control. John wiley & sons, 2020
work page 2020
-
[6]
Chien-Wei Wu, WL Pearn, and Samuel Kotz. An overview of theory and practice on process capability indices for quality assurance.International journal of production economics, 117(2):338–359, 2009
work page 2009
-
[7]
ISO/TR. Statisticalmethodsinprocessmanagement – capability and performance – part 4: Process capa- bility estimates and performance measures. ISO/TR 22514-4:2016 (2016)
work page 2016
-
[8]
Guidelines for implementation of statistical process control (spc) - part 1: Elements of spc
ISO. Guidelines for implementation of statistical process control (spc) - part 1: Elements of spc. ISO 11462-1:2001 (2001)
work page 2001
-
[9]
ISO/TR. Statisticalmethodsinprocessmanagement 9 – capability and performance – part 1: General prin- ciples and concepts. ISO/TR 22514-1:2014 (2014)
work page 2014
-
[10]
W. L. Pearn, Samuel Kotz, and Norman L. Johnson. Distributional and Inferential Properties of Process Capability Indices.Journal of Quality Technology, 24(4):216–231, October 1992. ISSN 0022-4065, 2575-
work page 1992
-
[11]
doi: 10.1080/00224065.1992.11979403
-
[12]
Confidence bounds for capability indices.Journal of Quality Technology, 24(4):188–195, 1992
Robert H Kushler and Paul Hurley. Confidence bounds for capability indices.Journal of Quality Technology, 24(4):188–195, 1992
work page 1992
-
[13]
Thomas Mathew, George Sebastian, and KM Kurian. Generalized confidence intervals for process capability indices.Quality and reliability engineering international, 23(4):471–481, 2007
work page 2007
-
[14]
NF Zhang, GA Stenback, and DM Wardrop. Interval estimation of process capability index cpk.Commu- nications in Statistics-Theory and Methods, 19(12): 4455–4470, 1990
work page 1990
-
[15]
Mahmoud A. Mahmoud, G. Robin Henderson, Eu- genio K. Epprecht, and William H. Woodall. Esti- mating the Standard Deviation in Quality-Control Applications.Journal of Quality Technology, 42(4): 348–357, October 2010. ISSN 0022-4065, 2575-6230. doi: 10.1080/00224065.2010.11917832
-
[16]
Encarnación Álvarez, Pablo J. Moya-Férnandez, Francisco J. Blanco-Encomienda, and Juan F. Muñoz. Methodological insights for industrial qual- ity control management: The impact of various es- timators of the standard deviation on the process capability index.Journal of King Saud University - Science, 27(3):271–277, July 2015. ISSN 10183647. doi: 10.1016/j...
-
[17]
K. S. Chen and W. L. Pearn. An ap- plication of non-normal process capability in- dices.Quality and Reliability Engineering In- ternational, 13(6):355–360, 1997. ISSN 1099-
work page 1997
-
[18]
doi: 10.1002/(SICI)1099-1638(199711/12)13: 6<355::AID-QRE125>3.0.CO;2-V
-
[19]
Jann-Pygn Chen and Cherng G. Ding. A new pro- cess capability index for non-normal distributions. International Journal of Quality & Reliability Man- agement, 18(7):762–770, October 2001. ISSN 0265- 671X. doi: 10.1108/02656710110396076
-
[20]
Process capability calculations for non-normal distributions.Quality progress, 22: 95–100, 1989
John A Clements. Process capability calculations for non-normal distributions.Quality progress, 22: 95–100, 1989
work page 1989
-
[21]
Alan J Collins. Bootstrap confidence limits on pro- cess capability indices.Journal of the Royal Sta- tistical Society: Series D (The Statistician), 44(3): 373–378, 1995
work page 1995
-
[22]
Finite-sample decision insta- bility in threshold-based process capability approval
Fei Jiang and Lei Yang. Finite-sample decision insta- bility in threshold-based process capability approval. arXiv:2603.11315, 2026
-
[23]
AF Bissell. How reliable is your capability index? Journal of the Royal Statistical Society Series C: Ap- plied Statistics, 39(3):331–340, 1990
work page 1990
-
[24]
Fei Jiang and Lei Yang. Practical process capa- bility indices workflows.The International Jour- nal of Advanced Manufacturing Technology, pages 1–19, 2026. doi: 10.1007/s00170-026-17782-7. URL https://doi.org/10.1007/s00170-026-17782-7
-
[25]
Fei Jiang and Lei Yang. Risk-calibrated process ca- pability approval with finite samples.arXiv preprint arXiv:2603.14479, 2026
work page internal anchor Pith review arXiv 2026
-
[26]
Leslie R Pendrill. Using measurement uncer- tainty in decision-making and conformity assess- ment.Metrologia, 51(4):S206–S218, 2014
work page 2014
-
[27]
Use of the ppm and its function in the production process.Procedia Manufacturing, 13:608–615, 2017
L Bebr, K Bícová, and H Zídková. Use of the ppm and its function in the production process.Procedia Manufacturing, 13:608–615, 2017
work page 2017
-
[28]
Mats Deleryd. On the gap between theory and prac- tice of process capability studies.International Jour- nal of Quality & Reliability Management, 15(2):178– 191, 1998
work page 1998
-
[29]
Morris H DeGroot.Optimal statistical decisions. John Wiley & Sons, 2005
work page 2005
-
[30]
Erich Leo Lehmann and Joseph P Romano.Testing statistical hypotheses. Springer, 2005
work page 2005
-
[31]
Springer Science & Business Me- dia, 2013
James O Berger.Statistical decision theory and Bayesian analysis. Springer Science & Business Me- dia, 2013
work page 2013
-
[32]
Cambridge university press, 2000
Aad W Van der Vaart.Asymptotic statistics, vol- ume 3. Cambridge university press, 2000. 10
work page 2000
discussion (0)
Sign in with ORCID, Apple, or X to comment. Anyone can read and Pith papers without signing in.