Recognition: 1 theorem link
· Lean TheoremAIMIP Phase 1: systematic evaluations of AI weather and climate models
Pith reviewed 2026-05-11 00:57 UTC · model grok-4.3
The pith
AI weather and climate models simulate historical climate and forcing responses as well as conventional physically-based models, though some underestimate warming trends and diverge in out-of-sample tests.
A machine-rendered reading of the paper's core claim, the machinery that carries it, and where it could break.
Core claim
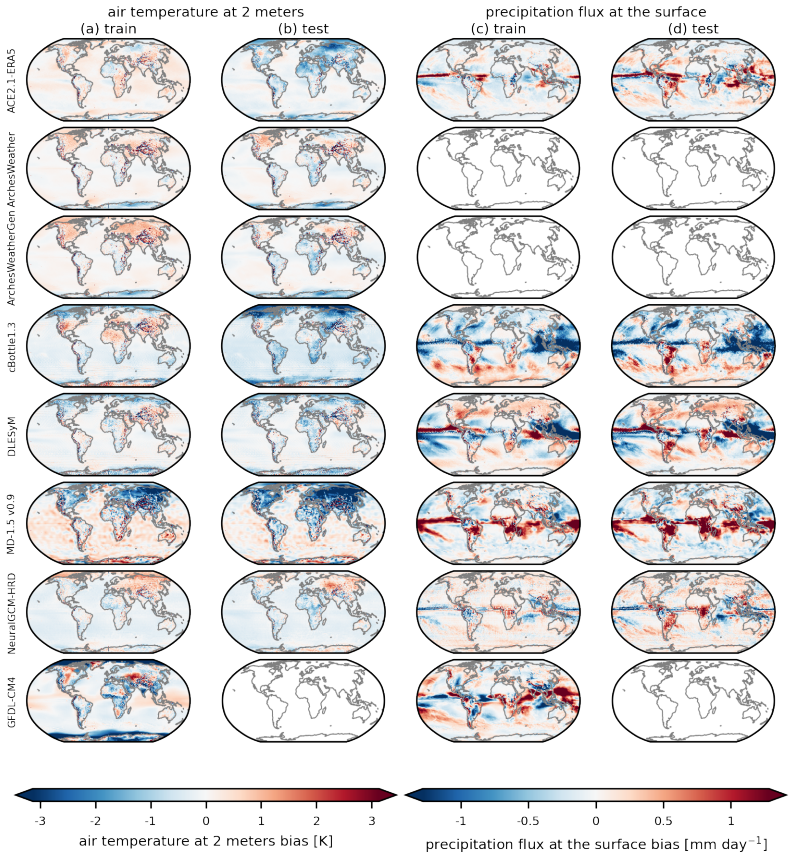
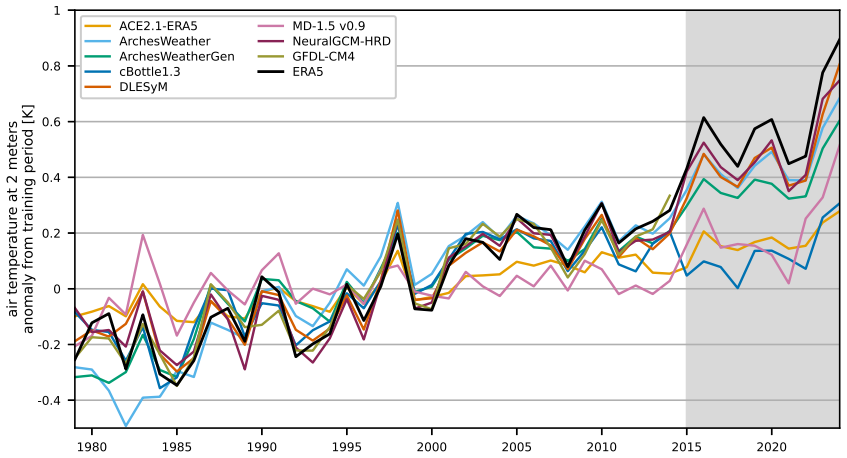
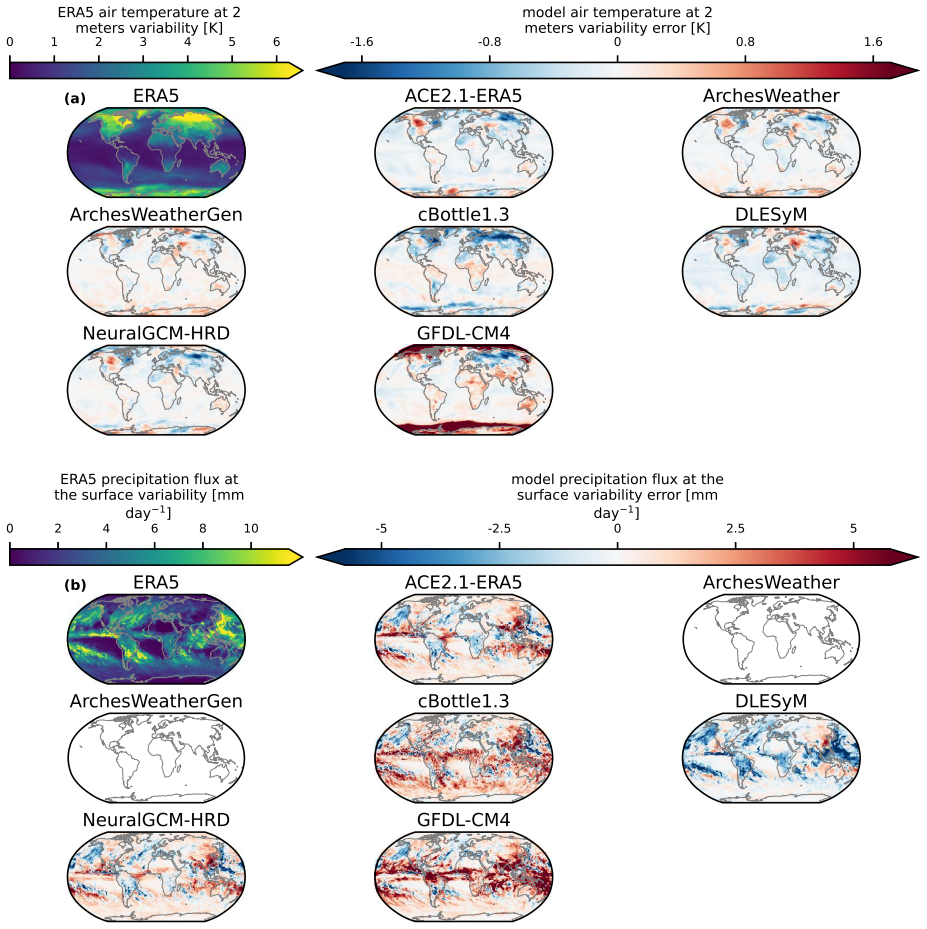
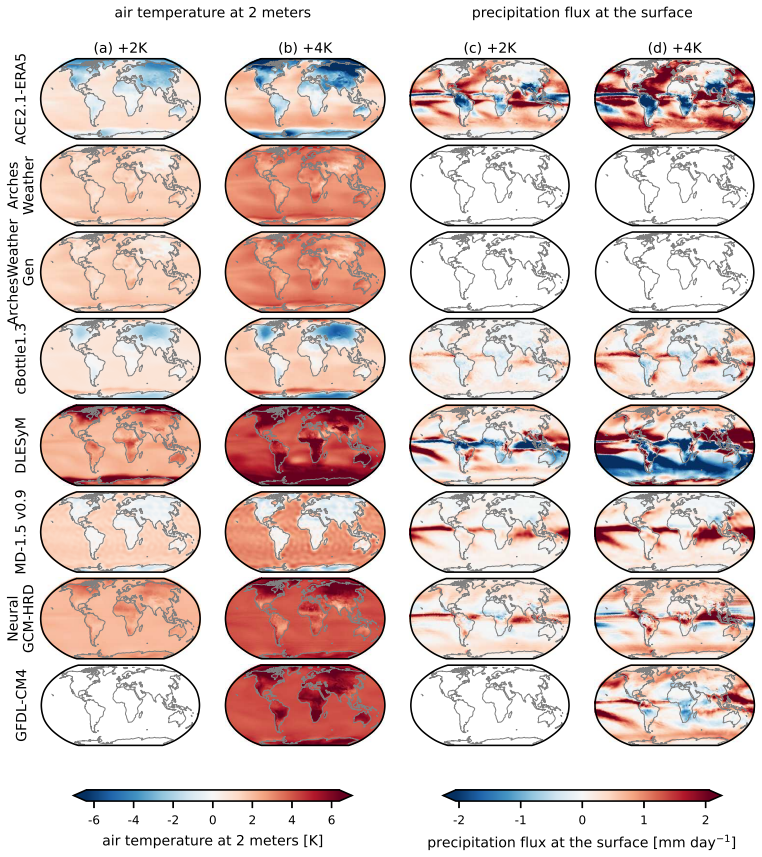
AIMIP Phase 1 defines a common experiment, output format, and training rules for AI weather and climate models that forces them to simulate the atmosphere given specified historical sea surface temperatures over 1979-2024. Applying five evaluation criteria—biases, trends, response to El Niño-related sea surface temperature anomalies, temporal variability, and out-of-sample generalization—the project finds that the AI models reproduce historical climate and forcing responses at a level comparable to a conventional physically-based model, while some underestimate historical warming trends and their predictions diverge in the out-of-sample tests. The resulting dataset is released publicly for追加
What carries the argument
The common experiment specification and the five evaluation criteria that allow direct comparison of different AI architectural choices against a baseline physically-based model.
If this is right
- AI models can be considered viable for reproducing historical climate states and responses to known forcings at a level comparable to traditional models.
- Some AI models will require targeted fixes to avoid underestimating long-term warming trends.
- Divergence among AI models in out-of-sample tests indicates that generalization to unseen conditions is not yet uniform.
- The public release of the evaluation dataset enables additional community tests beyond the five core criteria.
Where Pith is reading between the lines
- If the AIMIP evaluation standards are adopted widely, future AI model development will likely prioritize explicit constraints on trend accuracy and generalization.
- The approach could be extended to test AI models under future emissions scenarios that go beyond historical data.
- These results may encourage hybrid models that combine AI components with physical constraints to address the observed weaknesses in trend capture.
Load-bearing premise
That training solely against historical reanalysis data under the stated constraints, combined with the five chosen evaluation criteria, is sufficient to assess and build trust in the models' reliability for climate applications.
What would settle it
An independent run of the same models on a post-2024 observation period that shows all AI models matching the conventional model's accuracy without underestimating trends or diverging from each other would falsify the reported limitations.
Figures


read the original abstract
We present the AI weather and climate model intercomparison project (AIMIP), phase 1. Drawing from the rich tradition of intercomparisons in climate model development, we specify a common experiment, output data format, and training constraints (namely, training against historical reanalysis data) for AIMIP Phase 1 models. We aim to identify differences in modeling frameworks and AI architectural choices that influence model behavior, and build trust in AI weather and climate models through open data and evaluation. AIMIP Phase 1 models must simulate the atmosphere given specified historical sea surface temperatures over 1979-2024. We evaluate the models' performance using five major evaluation criteria: biases, trends, response to El Ni\~{n}o-related sea surface temperature anomalies, temporal variability, and out-of-sample generalization tests. We find that the AI models are able to simulate the historical climate and response to forcing as well as a conventional physically-based model, but some AI models underestimate historical warming trends, and their predictions diverge in the out-of-sample generalization tests. We describe the AIMIP Phase 1 dataset that is publicly available for additional evaluations.
Editorial analysis
A structured set of objections, weighed in public.
Referee Report
Summary. The paper introduces the AI weather and climate model intercomparison project (AIMIP) Phase 1. It defines a common experimental protocol requiring participating AI models to simulate the atmosphere given prescribed historical sea surface temperatures (SSTs) over 1979-2024, with training constrained to historical reanalysis data. Performance is assessed against a conventional physically-based model using five criteria: biases, trends, response to El Niño-related SST anomalies, temporal variability, and out-of-sample generalization tests. The central finding is that the AI models perform comparably to the conventional model on these metrics, although some underestimate historical warming trends and diverge in generalization tests. A public dataset of the evaluations is released to support further analysis.
Significance. If the results hold under the stated protocol, this establishes an open, standardized benchmark for AI-based atmospheric models forced by prescribed SSTs. The public dataset and emphasis on identifying architectural differences represent concrete steps toward reproducibility and community evaluation in a rapidly developing area. The work draws productively from the tradition of climate model intercomparisons but remains scoped to atmospheric response rather than full coupled climate dynamics.
major comments (2)
- [Abstract] Abstract: The claim that AI models 'simulate the historical climate and response to forcing as well as a conventional physically-based model' is conditioned on an experimental setup that prescribes historical SSTs and evaluates only the atmospheric component. This omits coupled ocean-atmosphere dynamics, sea-ice interactions, and long-term feedbacks that govern internal variability and trend attribution in standard climate applications. The manuscript should explicitly state whether the conventional model was run under identical prescribed-SST boundary conditions and discuss the implications for generalizing the parity result to free-running coupled configurations.
- [Evaluation section (implied by abstract)] Evaluation criteria description: The five criteria (biases, trends, El Niño response, temporal variability, out-of-sample tests) are listed but lack detail on the precise metrics, statistical significance testing, error estimation, or how 'as well as' is quantified (e.g., no reported effect sizes or p-values for trend differences). Without these, it is difficult to assess whether the reported underestimation of warming trends by some AI models is robust or whether the generalization divergences are statistically meaningful.
minor comments (1)
- [Abstract and introduction] The abstract and introduction would benefit from a brief table or bullet list summarizing the exact training constraints, output variables, and data format requirements to improve readability for readers unfamiliar with the project.
Simulated Author's Rebuttal
We thank the referee for their constructive comments, which help clarify the scope and strengthen the presentation of our results. We address each major comment below and will revise the manuscript accordingly.
read point-by-point responses
-
Referee: [Abstract] Abstract: The claim that AI models 'simulate the historical climate and response to forcing as well as a conventional physically-based model' is conditioned on an experimental setup that prescribes historical SSTs and evaluates only the atmospheric component. This omits coupled ocean-atmosphere dynamics, sea-ice interactions, and long-term feedbacks that govern internal variability and trend attribution in standard climate applications. The manuscript should explicitly state whether the conventional model was run under identical prescribed-SST boundary conditions and discuss the implications for generalizing the parity result to free-running coupled configurations.
Authors: We agree that the abstract should more precisely describe the experimental protocol. The conventional physically-based model was run with identical prescribed historical SST boundary conditions over 1979-2024 to enable a direct comparison of atmospheric responses. We will revise the abstract to state this explicitly and add a brief note on the implications: this setup isolates the atmospheric component's response to SST forcing and does not include coupled ocean-atmosphere dynamics, sea-ice interactions, or full long-term feedbacks, so the parity result applies specifically to prescribed-SST atmospheric simulations rather than free-running coupled climate models. revision: yes
-
Referee: [Evaluation section (implied by abstract)] Evaluation criteria description: The five criteria (biases, trends, El Niño response, temporal variability, out-of-sample tests) are listed but lack detail on the precise metrics, statistical significance testing, error estimation, or how 'as well as' is quantified (e.g., no reported effect sizes or p-values for trend differences). Without these, it is difficult to assess whether the reported underestimation of warming trends by some AI models is robust or whether the generalization divergences are statistically meaningful.
Authors: The full manuscript's evaluation section defines concrete metrics for each criterion (e.g., global and regional mean biases, linear trend slopes computed via least-squares regression over 1979-2024, El Niño composite anomalies, standard deviation of monthly fields for temporal variability, and root-mean-square error on held-out years for generalization). The statement that AI models perform 'as well as' the conventional model is based on these metrics showing comparable magnitudes and patterns in the figures, with explicit call-outs where some AI models underestimate trends. We acknowledge the value of additional statistical detail and will expand the section to include trend standard errors, confidence intervals, and qualitative assessment of whether trend differences exceed inter-model spread or typical variability. Formal p-values for every pairwise difference are not computed in the current analysis, but the underestimation and generalization divergences are robustly visible in the provided figures and data. revision: partial
Circularity Check
No circularity: empirical intercomparison with external benchmarks
full rationale
This is a protocol and evaluation paper for an AI model intercomparison project. It defines a common experimental setup (atmosphere-only simulations forced by prescribed historical SSTs 1979-2024), specifies five evaluation criteria, and reports direct comparisons of model output against independent reanalysis data plus a conventional physics-based model. No derivations, equations, fitted parameters, or self-referential claims appear; performance metrics are computed against external data sources that are not constructed from the AI models themselves. Out-of-sample tests and trend evaluations remain standard held-out or cross-validation procedures rather than tautological renamings of training inputs. The paper contains no load-bearing self-citations that substitute for independent evidence.
Axiom & Free-Parameter Ledger
axioms (1)
- domain assumption Historical reanalysis data provides an accurate representation of past atmospheric states suitable for training and evaluating AI models.
Lean theorems connected to this paper
-
IndisputableMonolith/Foundation/RealityFromDistinction.leanreality_from_one_distinction unclear?
unclearRelation between the paper passage and the cited Recognition theorem.
AIMIP Phase 1 models must simulate the atmosphere given specified historical sea surface temperatures over 1979-2024. We evaluate the models' performance using five major evaluation criteria: biases, trends, response to El Niño-related sea surface temperature anomalies, temporal variability, and out-of-sample generalization tests.
What do these tags mean?
- matches
- The paper's claim is directly supported by a theorem in the formal canon.
- supports
- The theorem supports part of the paper's argument, but the paper may add assumptions or extra steps.
- extends
- The paper goes beyond the formal theorem; the theorem is a base layer rather than the whole result.
- uses
- The paper appears to rely on the theorem as machinery.
- contradicts
- The paper's claim conflicts with a theorem or certificate in the canon.
- unclear
- Pith found a possible connection, but the passage is too broad, indirect, or ambiguous to say the theorem truly supports the claim.
Reference graph
Works this paper leans on
-
[1]
Hydrometeor., 4, 1147–1167,
Adler, R., Huffman, G., Chang, A., Ferraro, R., Xie, P., Janowiak, J., Rudolf, B., Schneider, U., Curtis, S., Bolvin, D., Gruber, A., Susskind, J., and Arkin, P.: The Version 2 Global Precipitation Climatology Project (GPCP) Monthly Precipitation Analysis (1979-Present), J. Hydrometeor., 4, 1147–1167,
1979
-
[2]
Allan, R., Willett, K., John, V ., and Trent, T.: Global Changes in Water Vapor 1979–2020, Journal of Geophysical Research: Atmospheres, 127, https://doi.org/10.1029/2022JD036728,
-
[3]
Arcomano, T., Henn, B., and Bretherton, C.: AIMIP Phase 1 Forcing Dataset, https://doi.org/10.5281/zenodo.17065758,
-
[4]
G., Chelliah, M., and Goldenberg, S
Barnston, A. G., Chelliah, M., and Goldenberg, S. B.: Documentation of a highly ENSO-related sst region in the equatorial pacific: Research note, Atmosphere-Ocean, 35, 367–383, https://doi.org/10.1080/07055900.1997.9649597,
-
[5]
Byrne, M. P. and O’Gorman, P. A.: Land–Ocean Warming Contrast over a Wide Range of Climates: Convective Quasi-Equilibrium Theory and Idealized Simulations, Journal of Climate, 26, 4000–4016, https://doi.org/10.1175/JCLI-D-12-00262.1,
-
[6]
Cinquini, L., Crichton, D., Mattmann, C., Harney, J., Shipman, G., Wang, F., Ananthakrishnan, R., Miller, N., Denvil, S., Morgan, M., Pobre, Z., Bell, G. M., Doutriaux, C., Drach, R., Williams, D., Kershaw, P., Pascoe, S., Gonzalez, E., Fiore, S., and Schweitzer, R.: The Earth System Grid Federation: An open infrastructure for access to distributed geospa...
-
[7]
Couairon, G., Singh, R., Charantonis, A., Lessig, C., and Monteleoni, C.: ArchesWeatherGen: Skillful and compute-efficient probabilistic weather forecasting with machine learning, Science Advances, 12, eadx2372, https://doi.org/10.1126/sciadv.adx2372,
-
[8]
AGU Advances 6(4), 2025–001706 (2025) https://doi.org/10.1029/2025A V001706
Cresswell-Clay, N., Liu, B., Durran, D. R., Liu, Z., Espinosa, Z. I., Moreno, R. A., and Karlbauer, M.: A Deep Learning Earth System Model for Efficient Simulation of the Observed Climate, AGU Advances, 6, https://doi.org/10.1029/2025A V001706,
-
[9]
Dunne, J. P., Hewitt, H. T., Arblaster, J. M., Bonou, F., Boucher, O., Cavazos, T., Dingley, B., Durack, P. J., Hassler, B., Juckes, M., Miyakawa, T., Mizielinski, M., Naik, V ., Nicholls, Z., O’Rourke, E., Pincus, R., Sanderson, B. M., Simpson, I. R., and Taylor, K. E.: An evolving Coupled Model Intercomparison Project phase 7 (CMIP7) and Fast Track in s...
-
[10]
D., Kölling, T., Allured, D., Jelenak, A., Soerensen, A
Eaton, B., Gregory, J., Drach, B., Taylor, K., Hankin, S., Caron, J., Signell, R., Bentley, P., Rappa, G., Höck, H., Pamment, A., Juckes, M., Raspaud, M., Blower, J., Horne, R., Whiteaker, T., Blodgett, D., Zender, C., Lee, D., Hassell, D., Snow, A. D., Kölling, T., Allured, D., Jelenak, A., Soerensen, A. M., Gaultier, L., Herlédan, S., Manzano, F., Bärri...
-
[11]
Eyring, V ., Bony, S., Meehl, G. A., Senior, C. A., Stevens, B., Stouffer, R. J., and Taylor, K. E.: Overview of the Coupled Model Intercomparison Project Phase 6 (CMIP6) experimental design and organization, Geoscientific Model Development, 9, 1937–1958, https://doi.org/10.5194/gmd-9-1937-2016, 2016a. Eyring, V ., Righi, M., Lauer, A., Evaldsson, M., Wen...
-
[12]
Gates, W. L., Boyle, J. S., Covey, C., Dease, C. G., Doutriaux, C. M., Drach, R. S., Fiorino, M., Gleckler, P. J., Hnilo, J. J., Marlais, S. M., Phillips, T. J., Potter, G. L., Santer, B. D., Sperber, K. R., Taylor, K. E., and Williams, D. N.: An Overview of the Results of the Atmospheric Model Intercomparison Project (AMIP I), Bulletin of the American Me...
-
[13]
Gorski, K. M., Hivon, E., Banday, A. J., Wandelt, B. D., Hansen, F. K., Reinecke, M., and Bartelmann, M.: HEALPix: A Framework for High-Resolution Discretization and Fast Analysis of Data Distributed on the Sphere, The Astrophysical Journal, 622, 759–771, https://doi.org/10.1086/427976,
work page internal anchor Pith review doi:10.1086/427976
-
[14]
G., Blanton, C., McHugh, C., Nikonov, S., Radhakrishnan, A., Rand, K., Zadeh, N
Guo, H., John, J. G., Blanton, C., McHugh, C., Nikonov, S., Radhakrishnan, A., Rand, K., Zadeh, N. T., Balaji, V ., Durachta, J., Dupuis, C., Menzel, R., Robinson, T., Underwood, S., Vahlenkamp, H., Bushuk, M., Dunne, K. A., Dussin, R., Gauthier, P. P., Ginoux, P., Griffies, S. M., Hallberg, R., Harrison, M., Hurlin, W., Lin, P., Malyshev, S., Naik, V ., ...
-
[15]
Hall, K. J. C. and Molina, M. J.: Monthly Diffusion v0.9: A Latent Diffusion Model for the First AI-MIP, http://arxiv.org/abs/2604.13481,
work page internal anchor Pith review Pith/arXiv arXiv
-
[16]
Henn, B., Bretherton, C., Koldunov, N. V ., and Watt-Meyer, O.: ai2cm/AIMIP: Manuscript preprint release, https://doi.org/10.5281/zenodo.20072878, 2026a. Henn, B., Watt-Meyer, O., Arcomano, T., McGibbon, J., Clark, S., Wu, E., Perkins, W., Kwa, A., Duncan, J., and Bretherton, C.: ai2cm/ACE2.1-ERA5-AIMIP: ACE2.1-ERA5: AIMIP Phase 1 submission, https://doi....
-
[17]
30 Kochkov, D., Yuval, J., Langmore, I., Norgaard, P., Smith, J., Mooers, G., Klöwer, M., Lottes, J., Rasp, S., Düben, P., Hatfield, S., Battaglia, P., Sanchez-Gonzalez, A., Willson, M., Brenner, M. P., and Hoyer, S.: Neural general circulation models for weather and climate, Nature, 632, 1060–1066, https://doi.org/10.1038/s41586-024-07744-y,
-
[18]
A., Simmons, A., Vamborg, F., and Rodwell, M
Lavers, D. A., Simmons, A., Vamborg, F., and Rodwell, M. J.: An evaluation of ERA5 precipitation for climate monitoring, Quarterly Journal of the Royal Meteorological Society, 148, 3152–3165, https://doi.org/10.1002/qj.4351,
-
[19]
J., Ahn, M.-S., Ordonez, A., Ullrich, P
Lee, J., Gleckler, P. J., Ahn, M.-S., Ordonez, A., Ullrich, P. A., Sperber, K. R., Taylor, K. E., Planton, Y . Y ., Guilyardi, E., Durack, P., Bonfils, C., Zelinka, M. D., Chao, L.-W., Dong, B., Doutriaux, C., Zhang, C., V o, T., Boutte, J., Wehner, M. F., Pendergrass, A. G., Kim, D., Xue, Z., Wittenberg, A. T., and Krasting, J.: Systematic and objective ...
-
[20]
Mauzey, C., Durack, P., Taylor, K. E., Florek, P., Doutriaux, C., Nadeau, D., Hogan, E., Kettleborough, J., Weigel, T., kjoti, jmrgonza, Nicholls, Z., Betts, E., Seddon, J., and Wachsmann, F.: PCMDI/CMOR: CMOR v3.8.0, https://doi.org/10.5281/zenodo.10946710,
-
[21]
McTaggart-Cowan, R., Magnusson, L., Polichtchouk, I., Ackerley, D., Koehler, M., Casati, B., Chen, J.-H., Hudson, D., Ujiie, M., Aziz, N. A., et al.: WP-MIP: An Artificial Intelligence, Hybrid and Physically Based Model Intercomparison Project for Weather Prediction, arXiv preprint arXiv:2604.16643,
work page internal anchor Pith review Pith/arXiv arXiv
-
[22]
Rombach, R., Blattmann, A., Lorenz, D., Esser, P., and Ommer, B.: High-Resolution Image Synthesis with Latent Diffusion Models, http: //arxiv.org/abs/2112.10752,
-
[23]
Sutton, R. T., Dong, B., and Gregory, J. M.: Land/sea warming ratio in response to climate change: IPCC AR4 model results and comparison with observations, Geophysical Research Letters, 34, https://doi.org/10.1029/2006GL028164,
-
[24]
Taylor, K. E., Williamson, D., and Zwiers, F.: AMIP Sea Surface Temperature and Sea Ice Concentration Boundary Conditions, https: //pcmdi.llnl.gov/mips/amip/details/index.html, accessed: 2024-04-01,
2024
-
[25]
E., Juckes, M., Balaji, V ., Cinquini, L., Denvil, S., Durack, P
Taylor, K. E., Juckes, M., Balaji, V ., Cinquini, L., Denvil, S., Durack, P. J., Elkington, M., Guilyardi, E., Kharin, S., Lautenschlager, M., Lawrence, B., Nadeau, D., and Stockhause, M.: CMIP6 Model Output Metadata Requirements, Data Reference Syntax (DRS) and Con- trolled V ocabularies (CVs), https://doi.org/10.5281/zenodo.15670624,
-
[26]
Ullrich, P. A., Barnes, E. A., Collins, W., Dagon, K., Duan, S., Elms, J., Lee, J., Leung, L. R., Lu, D., Molina, M. J., O’Brien, T. A., and Rebassoo, F. O.: Recommendations for Comprehensive and Independent Evaluation of Machine Learning-Based Earth System Models, Journal of Geophysical Research: Machine Learning and Computation, 2, https://doi.org/10.10...
-
[27]
Watt-Meyer, O., Henn, B., McGibbon, J., Clark, S. K., Kwa, A., Perkins, W. A., Wu, E., Harris, L., and Bretherton, C. S.: ACE2: ac- curately learning subseasonal to decadal atmospheric variability and forced responses, npj Climate and Atmospheric Science, 8, 205, https://doi.org/10.1038/s41612-025-01090-0,
-
[28]
J., Andrews, T., Bodas-Salcedo, A., Bony, S., Bretherton, C
Webb, M. J., Andrews, T., Bodas-Salcedo, A., Bony, S., Bretherton, C. S., Chadwick, R., Chepfer, H., Douville, H., Good, P., Kay, J. E., Klein, S. A., Marchand, R., Medeiros, B., Siebesma, A. P., Skinner, C. B., Stevens, B., Tselioudis, G., Tsushima, Y ., and Watanabe, M.: 31 The Cloud Feedback Model Intercomparison Project (CFMIP) contribution to CMIP6, ...
-
[29]
Yuval, J., Langmore, I., Kochkov, D., and Hoyer, S.: Neural general circulation models for modeling precipitation, Science Advances, 12, 1060–1066, https://doi.org/10.1126/sciadv.adv6891,
-
[30]
Simulation Characteristics With Prescribed SSTs, Journal of Advances in Modeling Earth Systems, 10, 691–734, https://doi.org/https://doi.org/10.1002/2017MS001208,
-
[31]
Zhuang, J. et al.: pangeo-data/xESMF: Universal Regridder for Geospatial Data, https://doi.org/10.5281/zenodo.4294774,
-
[32]
Second, the AMIP algorithm for calculating monthly values for SST and SIC is problematic
First, it does not extend past 2022, while AIMIP Phase 1 inference simulations cover through 2024 to maximize the possible length of high-quality obser- vational comparison. Second, the AMIP algorithm for calculating monthly values for SST and SIC is problematic. It involves specifying mid-month values that, when linearly interpolated in time, give the mo...
2022
-
[33]
Different parts of the denoising are carried out by different networks, with the higher noise levels being denoised by less trained/early-stopped versions of the network
cBottle1.3, like the published version, is an Ensemble-of-Experts model. Different parts of the denoising are carried out by different networks, with the higher noise levels being denoised by less trained/early-stopped versions of the network. This is to avoid overfitting at large noise levels (see Brenowitz et al. (2025) for details). For every model, we...
2025
-
[34]
Numbers indicate the amount of noisy samples this network is trained on. Physics Indices: –p1 checkpoints: –training-state-000512000.checkpoint –training-state-002048000.checkpoint –training-state-009856000.checkpoint –p2 checkpoints: –training-state-000512000.checkpoint –training-state-002176000.checkpoint –training-state-009984000.checkpoint –p3 checkpo...
1979
-
[35]
Computation is over 1979 and a cutoff of 0.1 mm is used to define a dry day
41 Figure C11.Dry-day fraction error in ERA5 (top left panel) and dry day fraction errors versus ERA5 (subsequent panels). Computation is over 1979 and a cutoff of 0.1 mm is used to define a dry day. 42 Appendix D: Selected results at 2.8 ◦ resolution We show selected results at 2.8 ◦ resolution, with NeuralGCM instead of NeuralGCM-HRD. In Figs. D1 and D2...
1979
discussion (0)
Sign in with ORCID, Apple, or X to comment. Anyone can read and Pith papers without signing in.